1. Introduction
Urn models are one of the fundamental objects in classical probability theory and have been studied for a long time in various degrees of generality. We refer the reader to classical sources [Reference Johnson and Kotz12, Reference Kolchin, Sevastyanov and Chistyakov16, Reference Kotz and Balakrishnan17, Reference Mahmoud18] for a complete account of the theory and discussions of different models, and, e.g., to [Reference Bobecka, Hitczenko, López-Blázquez, Rempała and Wesołowski4, Reference Gnedin, Hansen and Pitman7, Reference Hwang and Janson9] for some of the more recent developments. Perhaps the most heavily studied characteristic is the number of occupied urns after n balls have been thrown in. One reason for this is that it is often interpreted as a measure of diversity of a given population. Actually, more refined characteristics, e.g. the number of urns containing the prescribed number of balls (and its asymptotics), have subsequently been studied for various urn models; see, e.g., [Reference Karlin13, Reference Kolchin, Sevastyanov and Chistyakov16, Reference Mikhailov20], or [Reference Barbour and Gnedin2] and references therein for more recent developments. In diversity analysis, the number
 $K_r$
of urns with exactly r balls is called the abundance count of order r. In particular, the popular estimator of species richness called the Chao estimator is based on
 $K_1$
and
 $K_2$
(with a more sophisticated version also using
 $K_3$
and
 $K_4$
); see, e.g., [Reference Chao and Chiu5]. In [Reference Hwang and Janson9] the authors used analytical methods based on Poissonization and de-Poissonization to prove that the number of empty urns is asymptotically normal as long as its variance grows to infinity (this is clearly the minimal requirement). As a by-product of their method they established the Poissonian asymptotics of the number of balls that fall into non-empty urns when the variance is finite and under additional assumptions on the distribution among boxes. We mention in passing that the number of balls falling into non-empty urns is sometimes called the number of collisions. Under the uniformity assumption for the distribution of balls, it has been used, for example, for testing random number generators (see [Reference Knuth14, Section 3.3.2 I] for more details). We also refer to [Reference Arratia, Garibaldi and Kilian1] and references therein for another illustration of how this concept is used, e.g. in cryptology.
Our main aim here is to consider the number of balls falling into urns already containing r balls (thus, the number of collisions corresponds to
 $r=1$
). Relying on martingale-type methods, we provide sufficient conditions for both Poissonian and normal asymptotics for the number of balls falling into such urns.
One way to formulate the problem is as follows. There is a collection (possibly infinite) of distinct containers in which balls are to be inserted. All containers have the same finite capacity r. Each arriving ball is to be placed in one of the containers, randomly and independently of other balls. However, if the container selected for a given ball is already full, the ball lands in the overflow basket. We are interested in the number of balls in that basket when more and more balls appear. The notion of overflow is not entirely new and has appeared, for example, in the context of collision resolution for hashing algorithms; see the discussion under ‘External searching’ in [Reference Knuth15, Section 6.4]. We also refer to subsequent work [Reference Monahan21, Reference Ramakrishna23] for the computation of the probability that there is no overflow (under the uniformity assumption), and to [Reference Dupuis, Nuzman and Whiting6], which, in part, concerns the estimation of the probability of unusually large overflow. As far as we are aware, however, the asymptotic behavior of the overflow has not been systematically investigated.
More precisely, we consider the following model. For any
 $n\ge 1$
, let
 $X_{n,1},\ldots,X_{n,n}$
be independent and identically distributed (i.i.d.) random variables with values in
 $ M_n\subset {\mathbb N}\,:\!=\,\{1,2,\ldots\}$
, and let
 $p_{n,m}=\mathbb{P}(X_{n,1}=m)$
,
 $m\in M_n$
, be the common distribution among the boxes for each of the n balls in the nth experiment. Here,
 $X_{n,j}$
is interpreted as a random label of the urn selected for the jth ball in the nth experiment. Also let
 \begin{equation} N_{n,k}(m)=\sum_{j=1}^{k-1} \textbf{1}_{\{X_{n,j}=m\}} \end{equation}
for any
 $n\in {\mathbb N}$
,
 $k\in\{1,\ldots,n,n+1\}$
, and
 $m\in M_n$
, where
 $\textbf{1}_{\{\cdot\}}$
denotes the indicator of the event within brackets. That is,
 $N_{n,k}(m)$
is the number of balls among the first
 $k-1$
balls for which the mth box was selected.
Let r be a given positive integer that denotes the (same) capacity of every container. Then
 \begin{equation} Y_{n,k}=\sum_{m\in M_n} \textbf{1}_{\{X_{n,k}=m\}} \textbf{1}_{\{N_{n,k}(m)\ge r \}}\end{equation}
is 1 if the kth ball lands in the overflow, and is 0 otherwise. Naturally,
 $Y_{n,k}=0$
for
 $k=1,\ldots,r$
. Consequently, the size of the overflow, denoted
 $V_{n,r}$
, can be written as
 \begin{equation} V_{n,r}=\sum_{k=1}^n Y_{n,k}.\end{equation}
We are interested in the asymptotic distribution of
 $V_{n,r}$
as
 $n\to\infty$
. We show that there are regimes related to
 $p_{n,m}$
under which the limiting distribution of
 $V_{n,r}$
(possibly standardized) is either Poisson or normal. These regimes are defined through the limiting behavior of the sequences
 $n p_n^*$
and
 $n^{r+1} \sum_{m\in M_n} p_{n,m}^{r+1}$
, where
 $p_n^*=\sup_{m\in M_n} p_{n,m}$
.
We find it convenient to introduce auxiliary sequences of random variables
 $X_n$
,
 $Y_n$
,
 $n \ge 1$
, such that, for any
 $n\in{\mathbb N}$
, the random variables
 $X_n, Y_n,X_{n,1},\ldots,X_{n,n}$
are i.i.d. This allows us to simplify expressions in general because sums over
 $m\in M_n$
can be represented as expectations, and the computations are compactly carried out by means of conditional expectations. For example,
 $\sum_{m\in M_n} p_{n,m}^{r+1}=\mathbb{E} p^{r}_{X_n}$
, where
 $p^{}_{X_n}$
stands for the random variable
 $p_{n,X_n}$
. Convergence in probability and in distribution (as
 $n\to\infty$
) are denoted by
 $\stackrel{\mathbb{P}}{\to}$
and
 $\stackrel{{\textrm{d}}}{\to}$
, respectively.
We present our main results in Section 2; these give conditions for Poissonian and Gaussian asymptotics of the overflow. We also describe the limiting behavior for the number of full containers. Intermediate technical results are found in Section 3, and the proofs of the main theorems are presented in Section 4. Section 5 includes some remarks concerning the asymptotic behavior of the mean of
 $V_{n,r}$
.
2. Main results
2.1. Poissonian asymptotics
Theorem 1. Let
 $\textrm{Pois}(\mu)$
denote the Poisson distribution with parameter
 $\mu\in(0,\infty)$
. If
 \begin{equation} n^{r+1}\mathbb{E} \, p_{X_n}^r \to (r+1)!\mu , \end{equation}
 \begin{equation} n\,p_n^* \to 0,\quad \end{equation}
then
 $V_{n,r}\stackrel{\textrm{d}}{\to} \textrm{Pois}(\mu)$
.
Proof. See Section 4.1.
Example 1. Consider the uniform case, that is,
 $p_{n,j}={1}/{m_n}$
, for
 $j\in M_n=\{1,\ldots,m_n\}$
. Then
 \begin{equation}np_n^*=\frac{n}{m_n} , \qquad n^{r+1}\mathbb{E}\,p_{X_n}^r=\frac{n^{r+1}}{m_n^r}.\end{equation}
Take
 $m_n=\Big\lfloor an^{\tfrac{r+1}{r}}\Big\rfloor$
,
 $a>0$
. Then, by (6),
 $np_n^*\to 0$
and
 $n^{r+1}\mathbb{E}\,p_{X_n}^r\to{1}/{a^r}$
. Consequently, Theorem 1 yields
 $V_{n,r}\stackrel{\textrm{d}}{\to}\textrm{Pois}(\mu)$
, with
 $\mu={1}/({a^r(r+1)!)}$
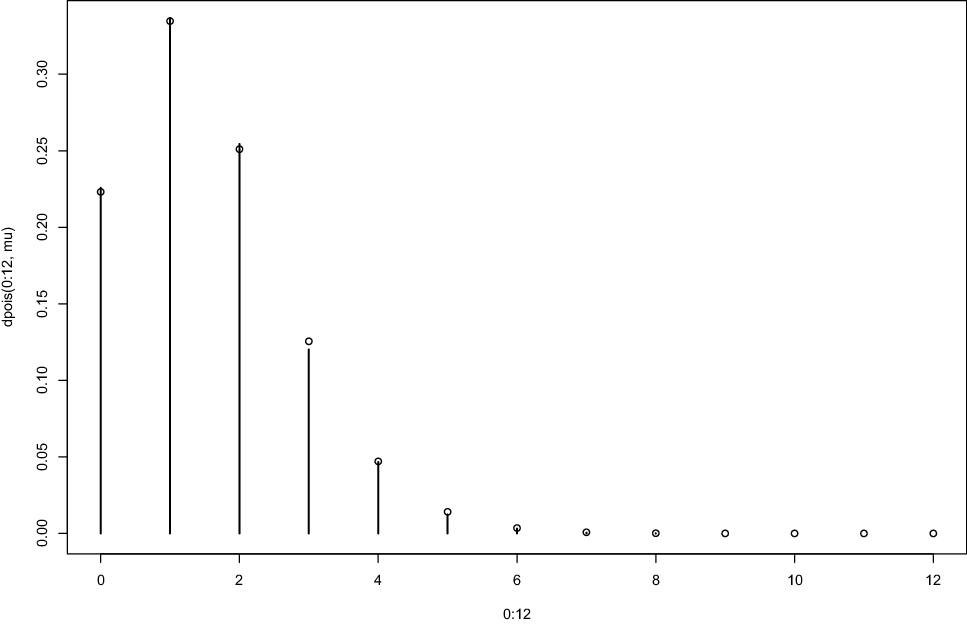
. Illustrative simulations are shown in Fig. 1.
Simulations of the overflow in the uniform case with
 $r=2$
,
 $n=10^5$
,
 $m_n=\big\lfloor an^{\tfrac{r+1}{r}}\big\rfloor$
, and
 $a=1/3$
(i.e.
 $m_{10^5}=10\,540\,925$
and
 $\mu=1.5$
) are shown as vertical lines (
 $10^4$
repetitions), while Poisson probabilities for
 $k=0,\ldots,12$
,
 $\textrm{dpois}(0\,{:}\,12,\mu)$
, are depicted by circles.

Example 2. Consider the geometric case, with
 $p_{n,j}=p_n(1-p_n)^{\,j}$
,
 $j\in M_n=\{0,1,2,\ldots\}$
. Then
 \begin{equation}np_n^*=np_n , \qquad n^{r+1}\mathbb{E}\,p_{X_n}^r=\frac{(np_n)^{r+1}}{1-(1-p_n)^{r+1}}.\end{equation}
Take
 $p_n={a}/{n^{(r+1)/r}}$
,
 $a>0$
. Then, by (7),
 $np_n^*={a}/{n^{1/r}}\to 0$
and
 \begin{equation*}n^{r+1}\mathbb{E}\,p_{X_n}^r=\frac{a^rp_n}{(r+1)p_n+o(p_n)}\to \frac{a^r}{r+1}.\end{equation*}
Consequently, Theorem 1 yields
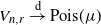 $V_{n,r}\stackrel{\textrm{d}}{\to}\textrm{Pois}(\mu)$
, with
 $\mu = {a^r}/{[(r+1)!(r+1)]}$
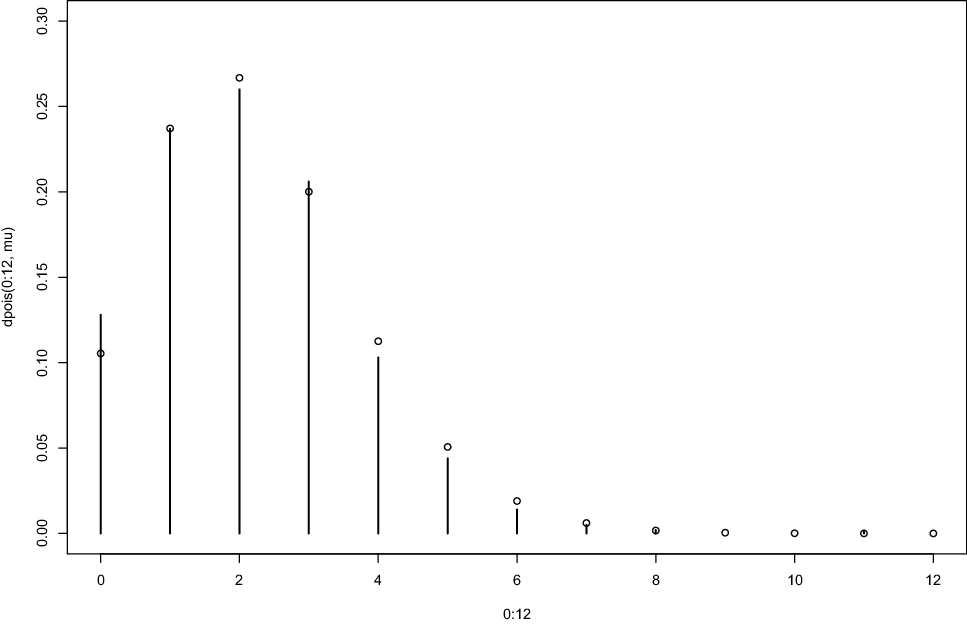
. Illustrative simulations are shown in Fig. 2.
Simulations of the overflow in the geometric case with
 $r=3$
,
 $n=10^5$
,
 $p_n=a n^{-(r+1)/r}$
with
 $a=6$
(i.e.
 $p_{10^5}\approx 1.29\times10^{-6}$
and
 $\mu=2.25$
) are shown as vertical lines (
 $10^3$
repetitions), while Poisson probabilities for
 $k=0,\ldots,12$
,
 $\textrm{dpois}(0\,{:}\,12,\mu)$
, are depicted by circles.

Hwang and Janson [Reference Hwang and Janson9] used the method of Poissonization and de-Poissonization to establish the asymptotic normality for the number of occupied boxes under the weakest possible assumption that its variance tends to infinity. As a by-product of their approach they derived Theorem 1 for
 $r=1$
(see [Reference Hwang and Janson9, Theorem 8.2]). The proof we present in Section 4.1 is entirely different and relies on a martingale-type convergence result from [Reference Beśka, Kłopotowski and Słomiński3].
2.2. Normal asymptotics
Theorem 2. Assume that
 $np_n^*$
is bounded, and that
 $n^{r+1}\mathbb{E}\,p_{X_n}^r\to\infty$
. Then
 \begin{equation*} \frac{V_{n,r}-\mathbb{E}\,V_{n,r}}{\sqrt{\textrm{Var}\,V_{n,r}}}\stackrel{\textrm{d}}{\to} \textrm{N}(0,1).\end{equation*}
Proof. See Section 4.2.
The boundedness of
 $np_n^*$
may be interpreted as the asymptotic negligibility condition, which is a natural requirement for central limit theorem (CLT) type results. The assumption
 $n^{r+1}\mathbb{E}\,p_{X_n}^r\to\infty$
is to ensure that the variance
 $\textrm{Var}\,V_{n,r}$
grows to infinity with n, a necessary condition for the CLT. In Proposition 1 we show that
 $\mathbb{E}\, V_{n,r}$
and
 $\textrm{Var}\,V_{n,r}$
are of order
 $n^{r+1}\mathbb{E}\,p_{X_n}^r$
.
Proposition 1. Assume that
 $np_n^*$
is bounded and let
 $\lambda=\limsup np_n^*\ge 0$
. Then
 \begin{equation} \frac{\Gamma_\lambda(r+1)}{r!}\le \liminf\frac{\mathbb{E}\,V_{n,r}}{n^{r+1}\mathbb{E}\,p_{X_n}^r}\le \limsup\frac{\mathbb{E}\,V_{n,r}}{n^{r+1}\mathbb{E}\,p_{X_n}^r}\le \frac{1}{(r+1)!}, \end{equation}
where, for
 $p>0$
and
 $x\ge0$
we have set
 $\Gamma_x(p)\,:\!=\, \int_0^1t^{p-1}\textrm{e}^{-xt}\,\textrm{d} t$
. If, in addition,
 $n^{r+1}\mathbb{E}\,p_{X_n}^r\to\infty$
, then
 \begin{equation} \frac{\textrm{e}^{-2\lambda}}{(r+1)!}\le\liminf \frac{\textrm{Var}\,V_{n,r}}{n^{r+1}\mathbb{E}\,p_{X_n}^r}\le\limsup \frac{\textrm{Var}\,V_{n,r}}{n^{r+1}\mathbb{E}\,p_{X_n}^r}\le \frac{1}{r!}. \end{equation}
Proof. See Section 4.2.2.
Remark 1. Since
 $\Gamma_0(p)=1/p$
, it follows immediately that if
 $\lambda=0$
then the limit of
 ${\mathbb{E}\,V_{n,r}}/{\big[n^{r+1}\mathbb{E}\,p_{X_n}^r\big]}$
in (8) exists and equals
 $1/{(r+1)!}$
, regardless of the values of
 $(p_{n,k})$
. As we will see in Section 5, the situation is more complex when
 $\lambda>0$
.
Example 3. Consider the uniform case, with
 $p_{n,j}={1}/{m_n}$
,
 $j\in M_n=\{1,\ldots,m_n\}$
. Then
 $n^{r+1}\mathbb{E}\,p_{X_n}^r={n^{r+1}}/{m_n^r}\to \infty$
and
 $np_n^*={n}/{m_n}\to \lambda\ge 0$
. Thus, by Theorem 2,
 \begin{equation*}\frac{V_{n,r}-\mathbb{E}\,V_{n,r}}{\sqrt{\textrm{Var}\,V_{n,r}}}\stackrel{\textrm{d}}{\to} \textrm{N}(0,1).\end{equation*}
In particular,
 $m_n=\lfloor\kappa n^a\rfloor$
with
 $a\in[1,\,1+r^{-1})$
and
 $\kappa>0$
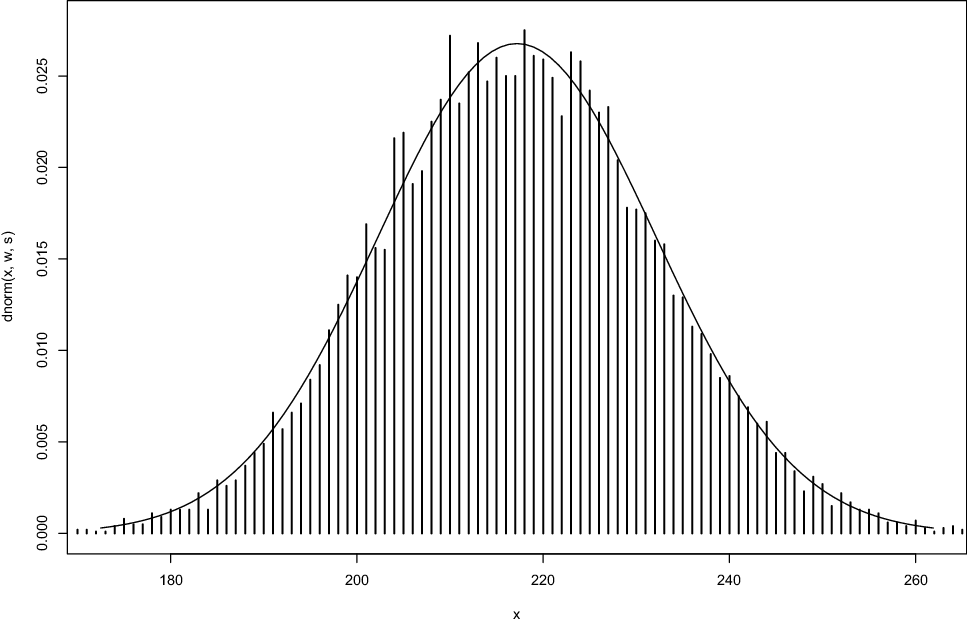
yields normal asymptotics. Illustrative simulations are shown in Fig. 3.
Simulations of the overflow in the uniform case with
 $r=2$
,
 $n=10^4$
,
 $m_{n}=\lfloor n^a\rfloor$
with
 $a=1.1$
(i.e.
 $m_{n}=25\,118$
) are shown as vertical lines (
 $10^4$
repetitions) vs. the graph of the normal density
 $\textrm{dnorm}(x,w,s)$
, where
 $w=217.2$
and
 $s=14.9$
are the empirical mean and standard deviation, respectively.

Example 4. Consider the geometric case, with
 $p_{n,j}=p_n(1-p_n)^{\,j}$
,
 $j\in M_n=\{0,1,2,\ldots\}$
, and
 $p_n=1/{n^a}$
,
 $a\in[1,\,1+r^{-1})$
. Then (7) yields
 \begin{equation*}n^{r+1}\mathbb{E}\,p_{X_n}^r=\frac{n^{r+1-ra}}{r+1+o(1)}\to \infty.\end{equation*}
Moreover,
 \begin{equation*} np_n^*=np_n=n^{1-a}\to \left\{\begin{array}{l@{\quad}l} 1, & a=1, \\[4pt]0, & 1<a<1+r^{-1}.\end{array} \right.\end{equation*}
Thus, the asymptotic normality of
 $V_{n,r}$
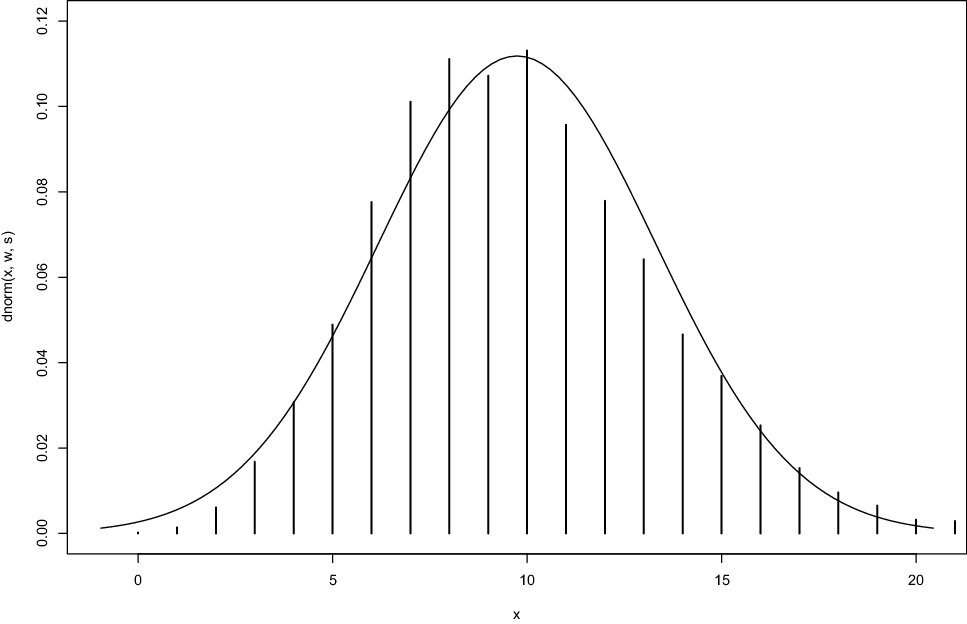
follows from the above theorem. Illustrative simulations are shown in Fig. 4.
Simulations of the overflow in the geometric case with
 $r=4$
,
 $n=10^4$
,
 $a=1$
are shown as vertical lines (
 $10^4$
repetitions) vs. the graph of the normal density
 $\textrm{dnorm}(x,w,s)$
, where
 $w=9.74$
and
 $s=3.57$
are the empirical mean and standard deviation, respectively.

2.3. Phase transition
In this short subsection we combine the results on the Poisson and normal asymptotics given in Theorems 1 and 2 in order to identify a critical capacity r that separates two asymptotic phases, normal and degenerate, the phase transition being through the Poissonian asymptotic regime.
Proposition 2. Let
 $np_n^*\to 0$
. Assume there exists an
 $r\in\{1,2,\ldots\}$
such that (4) holds. Then
-
(i)
 ${(V_{n,s}-\mathbb{E}\,V_{n,s})}/{\sqrt{\textrm{Var}\,V_{n,s}}}\stackrel{\textrm{d}}{\to}\textrm N(0,1)$
for
$s\in\{1,\ldots,r-1\}$
,
-
(ii)
$V_{n,r}\stackrel{\textrm{d}}{\to}\textrm{Pois}(\mu)$
, -
(iii)
$V_{n,s}\stackrel{\mathbb{P}}{\to}0$
for
$s\in\{r+1,r+2,\ldots\}$
.


Proof. See Section 4.3.
2.4. Asymptotics for the number of full containers
Let
 $L_{n,r}$
denote the number of full containers and
 $K_{n,r}$
the number of full containers without overflow. The main idea is to represent
 $L_{n,r}$
and
 $K_{n,r}$
in terms of the size of the overflow
 $V_{n,r}$
.
Note from (1) that
 $N_{n,n+1}(m)$
is the total number of balls in the sample for which the mth box was selected. Thus,
 $K_{n,r}=\sum_{j\in M_n}\textbf{1}_{\{N_{n,n+1}(j)=r\}}=L_{n,r}-L_{n,r+1}$
and
 $L_{n,r}=\sum_{j\in M_n}\textbf{1}_{\{N_{n,n+1}(j)\ge r\}}$
. We note that
 \begin{equation*}\begin{split}L_{n,r}&=\sum_{j\in M_n}\sum_{k=1}^n\textbf{1}_{\{X_{n,k}=j\}}\textbf{1}_{\{N_{n,k}(j)=r-1\}}\\&=\sum_{j\in M_n}\sum_{k=1}^n\textbf{1}_{\{X_{n,k}=j\}}\textbf{1}_{\{N_{n,k}(j)\ge r-1\}}-\sum_{j\in M_n}\sum_{k=1}^n\textbf{1}_{\{X_{n,k}=j\}}\textbf{1}_{\{N_{n,k}(j)\ge r\}}.\end{split}\end{equation*}
That is,
 \begin{equation}L_{n,r}=V_{n,r-1}-V_{n,r} , \qquad K_{n,r}=V_{n,r-1}-2V_{n,r}+V_{n,r+1}.\end{equation}
Note that in the case
 $r=1$
we have
 $V_{n,0}=n$
and thus
 $L_{n,1}$
, which is the number of non-empty boxes, is
 \begin{equation}L_{n,1}=n-V_{n,1} ,\end{equation}
and
 $K_{n,1}$
, which is the number of singleton boxes, is
 \begin{equation}K_{n,1}=n-2V_{n,1}+V_{n,2}.\end{equation}
These representations of
 $K_{n,r}$
and
 $L_{n,r}$
in terms of
 $V_{n,r-1}$
,
 $V_{n,r}$
, and
 $V_{n,r+1}$
allow us to read the Poissonian asymptotics of these two sequences from Theorem 1. For
 $K_{n,r}$
the forthcoming statement was proved in [Reference Kolchin, Sevastyanov and Chistyakov16, Theorem III.3.1].
Theorem 3. Assume that
 $np_n^*\to 0$
.
-
(i) If
$r>1$
and
$n^r\mathbb{E}\,p_{X_n}^{r-1}\to r!\mu$
then
$L_{n,r}\stackrel{\textrm{d}}{\to}\textrm{Pois}(\mu)$
and
$K_{n,r}\stackrel{\textrm{d}}{\to}\textrm{Pois}(\mu)$
. -
(ii) If
$r=1$
and
$n^2\mathbb{E}\,p^{}_{X_n}\to2\mu$
then
$n-L_{n,1}\stackrel{\textrm{d}}{\to}\textrm{Pois}(\mu)$
and
$\tfrac12({n-K_{n,1}})\stackrel{\textrm{d}}{\to}\textrm{Pois}(\mu)$
.


Proof. See Section 4.4
Note that, under the assumptions of Theorem 3, we have
 $L_{n,r}-K_{n,r}\stackrel{\mathbb{P}}\to 0$
in case (i) and
 $L_{n,1}-K_{n,1}\stackrel{\textrm{d}}{\to}\textrm{Pois}(\mu)$
in case (ii). To see these two facts, note that
 $L_{n,r}-K_{n,r}=V_{n,r}-V_{n,r+1}$
for all
 $r=1,2,\ldots$
and, under the assumptions of Theorem 3, both
 $V_{n,r},V_{n,r+1}\stackrel{\mathbb{P}}{\to}0$
in case (i), while
 $V_{n,2}\stackrel{\mathbb{P}}{\to} 0$
and
 $V_{n,1}\stackrel{\textrm{d}}{\to}\textrm{Pois}(\mu)$
in case (ii).
The representations in (10) are also useful for getting Gaussian asymptotics of
 $L_{n,r}$
and
 $K_{n,r}$
from Theorem 2 in the case
 $\lambda=0$
.
Theorem 4. Assume that
 $np_n^*\to 0$
and
 $r\ge 1$
.
-
(i) If
$n^{r+1}\mathbb{E}\,p_{X_n}^r\to\infty$
then
\begin{equation*} \frac{L_{n,r}-\mathbb{E}\,L_{n,r}}{\sqrt{\textrm{Var}\,L_{n,r}}}\stackrel{\textrm{d}}{\to} \textrm{N}(0,1). \end{equation*}
-
(ii) If
$n^{r+2}\mathbb{E}\,p_{X_n}^{r+1}\to\infty$
then
\begin{equation*} \frac{K_{n,r}-\mathbb{E}\,K_{n,r}}{\sqrt{\textrm{Var}\,K_{n,r}}}\stackrel{\textrm{d}}{\to} \textrm{N}(0,1). \end{equation*}


Proof. See Section 4.4.
3. Intermediate technical results
In this section we provide the notation, definitions, and technical results that are needed in the proofs of the theorems.
3.1. Multinomial distribution and negative association
Note that, for distinct
 $m_1,\ldots,m_s\in M_n$
and any
 $k=1,\ldots,n$
,
 $(N_{n,k}(m_1)$
, …,
 $N_{n,k}(m_s))$
has a multinomial distribution, denoted
 $\textrm{Mn}_s(k-1;\, p_{n,m_1},\ldots,p_{n,m_s})$
, i.e.
 \begin{equation*}\mathbb{P}(N_{n,k}(m_1)=i_1,\ldots,N_{n,k}(m_s)=i_s) = \left(\begin{array}{c}k-1\\i_1,\ldots,i_s\end{array}\right) \Bigg(1-\sum_{v=1}^s\,p_{n,v}\Bigg)^{k-1-\sum_{v=1}^s\,i_v}\prod_{v=1}^sp_{n,m_v}^{i_v} \end{equation*}
for
 $i_v\ge 0$
,
 $v=1,\ldots,s$
, and
 $\sum_{v=1}^si_v\le k-1$
. In particular,
 $N_{n,k}(m)$
has the binomial distribution
 $\operatorname{Bin}\!(k-1, p_{n,m})$
, i.e.
 $\mathbb{P}(N_{n,k}(m)=i)=\scriptsize\left(\begin{array}{c}k-1\\i\end{array}\right)p_{n,m}^iq_{n,m}^{k-1-i}$
,
 $i=0,\ldots,k-1$
, where
 $q_{n,m}=1-p_{n,m}$
. Also, let
 $N_{n,k}^\ell(m)=N_{n,\ell}(m)-N_{n,k}(m)=\sum_{j=k}^{\ell-1}\textbf{1}_{\{X_{n,j}=m\}}$
for
 $k<\ell$
, and
 $N_{n,k}^\ell(m)=0$
for
 $k\ge \ell$
. Then, for distinct
 $j_1,\ldots,j_t\in M_n$
and
 $k<\ell$
,
 $(N_{n,k}^\ell(j_1),\ldots,N_{n,k}^\ell(j_t))$
has distribution
 $\textrm{Mn}_t(\ell-k;\, p_{n,j_1},\ldots,p_{n,j_t})$
. Moreover, the random vectors
 $(N_{n,k}(m_1),\ldots,N_{n,k}(m_s))$
and
 $(N_{n,k}^\ell(j_1),\ldots,N_{n,k}^\ell(j_t))$
are independent since the former is a function of
 $X_{n,1},\ldots,X_{n,k-1}$
and the latter of
 $X_{n,k},\ldots,X_{n,\ell-1}$
.
Further, it is well known that multinomial random variables are negatively upper-orthant dependent (NUOD; see, e.g., [Reference Mallows19], where this observation seems to have appeared for the first time, or [Reference Jogdeo and Patil11]). That is, for
 $m_1\neq m_2$
,
 \begin{equation}\small\mathbb{P}(N_{n,k}(m_1)\ge x_1,\,N_{n,k}(m_2)\ge x_2)\le \mathbb{P}(N_{n,k}(m_1)\ge x_1)\,\mathbb{P}(N_{n,k}(m_2)\ge x_2).\end{equation}
As such, they are also negatively associated (NA); see [Reference Joag-Dev and Proschan10] for the definition and basic properties P1–P7. We recall three of these properties that we will use:
-
P4: A subset of two or more NA random variables is NA.
-
P6: Increasing functions defined on disjoint subsets of a set of NA random variables are NA.
-
P7: The union of independent sets of NA random variables is NA.
Since
 $\{N_{n,k}(m_1),\ldots, N_{n,k}(m_t)\}$
and
 $\{N_{n,k}^\ell(j_1),\ldots,N_{n,k}^\ell(j_t)\}$
are independent sets of NA random variables, by property P7,
 $\{N_{n,k}(m_1)$
, …,
 $N_{n,k}(m_t)$
,
 $N_{n,k}^\ell(j_1)$
, …,
 $N_{n,k}^\ell(j_t)\}$
is also NA. In particular, by P4, for distinct
 $m_1$
,
 $m_2$
,
 $n_1$
, and
 $n_2$
, the subset
 $\{N_{n,k}(m_1)$
,
 $N_{n,k}(n_1)$
,
 $N_{n,k}(m_2)$
,
 $N_{n,k}(n_2)$
,
 $N_{n,k}^\ell(m_2)$
,
 $N_{n,k}^\ell(n_2)\}$
is NA as well. Finally, noting that
 $N_{n,\ell}(m)=N_{n,k}(m)+N_{n,k}^\ell(m)$
, we conclude by P6 that
 $N_{n,k}(m_1)$
,
 $N_{n,k}(n_1)$
,
 $N_{n,\ell}(m_2)$
, and
 $N_{n,\ell}(n_2)$
are NA.
Consequently, the following extended versions of the NUOD property (13) hold:
 \begin{align}\mathbb{P}(N_{n,k}(m_1) & \ge x_1, N_{n,k}(n_1)\ge y_1,N_{n,\ell}(m_2)\ge x_2,N_{n,\ell}(n_2)\ge y_2) \nonumber\\[3pt]& \le\mathbb{P}(N_{n,k}(m_1)\ge x_1)\mathbb{P}(N_{n,k}(n_1)\ge y_1)\mathbb{P}(N_{n,\ell}(m_2)\ge x_2)\mathbb{P}(N_{n,\ell}(n_2)\ge y_2) ,\end{align}
and, taking
 $y_1=y_2=0$
in (14),
 \begin{equation} \mathbb{P}(N_{n,k}(m_1)\ge x_1,\,N_{n,\ell}(m_2)\ge x_2)\le \mathbb{P}(N_{n,k}(m_1)\ge x_1)\,\mathbb{P}(N_{n,\ell}(m_2)\ge x_2).\end{equation}
3.2. Conditional expectations
Let
 $\mathcal{F}_{n,k} = \sigma(X_{n,1},\ldots,X_{n,k})$
be the
 $\sigma$
-algebra generated by
 $X_{n,1},\ldots,X_{n,k}$
for
 $k=1,\ldots,n$
, and note that
 $N_{n,j}(m)$
is
 $\mathcal{F}_{n,k}$
-measurable, for any
 $m\in M_n$
,
 $k\ge j-1$
. Note also that, for any n, k,
 $X_n$
is independent of
 $\mathcal{F}_{n,k}$
. Then
 $Y_{n,j}$
can be written as
 \begin{equation*} Y_{n,j}=\mathbb{E}\bigg(\frac{\textbf{1}_{\{X_{n,j}=X_n\}}}{p^{}_{X_n}}\textbf{1}_{\{N_{n,j}(X_n)\ge r\}} \, \Big| \, \mathcal{F}_{n,n}\bigg).\end{equation*}
So, for
 $j\ge k$
,
 \begin{align} \mathbb{E}(Y_{n,j} \mid \mathcal{F}_{n,k-1}) & = \mathbb{E}\bigg(\frac{\textbf{1}_{\{X_{n,j}=X_n\}}}{p^{}_{X_n}}\textbf{1}_{\{N_{n,j}(X_n)\ge r\}} \, \Big| \, \mathcal{F}_{n,k-1}\bigg) \nonumber \\ & = \mathbb{E}\bigg(\mathbb{E}\bigg(\frac{\textbf{1}_{\{X_{n,j}=X_n\}}}{p^{}_{X_n}}\textbf{1}_{\{N_{n,j}(X_n)\ge r\}} \, \Big| \, X_n,\mathcal{F}_{n,j-1}\bigg) \, \Big| \, \mathcal{F}_{n,k-1}\bigg) \nonumber \\ & = \mathbb{E}\bigg(\mathbb{E}\bigg(\frac{\textbf{1}_{\{X_{n,j}=X_n\}}}{p^{}_{X_n}} \, \Big| \, X_n,\mathcal{F}_{n,j-1}\bigg)\textbf{1}_{\{N_{n,j}(X_n)\ge r\}} \, \Big| \, \mathcal{F}_{n,k-1}\bigg) \nonumber \\ & = \mathbb{E}\big(\textbf{1}_{\{N_{n,j}(X_n)\ge r\}}\mid\mathcal{F}_{n,k-1}\big).\end{align}
Hence,
 $\mathbb{E}(Y_{n,j}\mid\mathcal{F}_{n,k})=\mathbb{E}(\textbf{1}_{\{N_{n,j}(X_n)\ge r\}}\mid\mathcal{F}_{n,k})$
for
 $j>k$
, and
 $\mathbb{E}(Y_{n,k} \mid \mathcal{F}_{n,k})=Y_{n,k}$
.
Note that the representation in (16) implies
 \begin{equation}\mathbb{E}(Y_{n,k}\mid\mathcal{F}_{n,k-1})=\mathbb{P}(N_{n,k}(X_n)\ge r\mid\mathcal{F}_{n,k-1})=\mathbb{P}(N_{n,k}(X_n)\ge r\mid\mathcal{F}_{n,n}).\end{equation}
Taking expectations of both extremes of (16), we get
 \begin{equation} \mathbb{E}\,Y_{n,j}=\mathbb{P}(N_{n,j}(X_n)\ge r)=\mathbb{E}\,\mathbb{P}(N_{n,j}(X_n)\ge r\mid X_n)=\mathbb{E}\sum_{i=r}^{j-1}\binom{j-1}{i}\,p_{X_n}^iq_{X_n}^{j-1-i},\end{equation}
where
 $q^{}_{X_n}=1-p^{}_{X_n}$
. Furthermore, for
 $k,\ell=1\ldots,n$
, (17) yields
 \begin{equation*} \mathbb{E}(\mathbb{E}(Y_{n,k} \mid \mathcal{F}_{n,k-1})\mathbb{E}(Y_{n,\ell}\mid\mathcal{F}_{n,\ell-1}))=\mathbb{E}(\mathbb{P}(N_{n,k}(X_n)\ge r\mid\mathcal{F}_{n,n})\mathbb{P}(N_{n,\ell}(Y_n)\ge r\mid\mathcal{F}_{n,n})),\end{equation*}
and, because
 $N_{n,k}(X_n)$
and
 $N_{n,\ell}(Y_n)$
are conditionally independent given
 $\mathcal{F}_{n,n}$
, it follows that
 $\mathbb{E}(\mathbb{E}\,(Y_{n,k} \mid \mathcal{F}_{n,k-1})\mathbb{E}(Y_{n,\ell} \mid \mathcal{F}_{n,\ell-1})) = \mathbb{P}(N_{n,k}(X_n)\ge r,N_{n,\ell}(Y_n)\ge r)$
. Consequently, for any
 $k,\ell$
,
 \begin{equation} \textrm{Cov}\!\left(\mathbb{E}(Y_{n,k}\mid\mathcal{F}_{n,k-1}),\mathbb{E}(Y_{n,\ell}\mid\mathcal{F}_{n,\ell-1})\right)=\textrm{Cov}(\textbf{1}_{\{N_{n,k}(X_n)\ge r\}},\textbf{1}_{\{N_{n,\ell}(Y_n)\ge r\}}).\end{equation}
3.3. Two useful lemmas
In the proof of Theorem 1 we use the following results, obtained from (4) and (5).
Lemma 1. (i) Let s be a positive integer. If (4) and (5) hold, then
 \begin{equation} n^s\mathbb{E}\,p_{X_n}^s \to 0 ,\ \ \quad\quad \end{equation}
 \begin{equation} n^{s+1}\mathbb{E}\,p_{X_n}^s \to0, \quad s>r. \end{equation}
(ii) If
 $np_n^*$
,
 $n\ge 1$
, is bounded and
 $n^{r+1}\mathbb{E}\,p_{X_n}^r\to\infty$
then
 \begin{equation} n^{s+1}\mathbb{E}\,p_{X_n}^s\to\infty,\quad 0<s<r. \end{equation}
Proof. (i) Since
 $n^s\mathbb{E}\,p_{X_n}^s\le (np_n^*)^{s}$
, (20) follows from (5). Also, (21) follows from (4) and (5) since
 $n^{s+1}\mathbb{E}\,p_{X_n}^s\le (np_n^*)^{s-r}n^{r+1}\mathbb{E}\,p_{X_n}^r$
.
(ii) For
 $s<r$
, by (4) and (5) we get
 $n^{s+1}\mathbb{E}\,p_{X_n}^s\ge n^{r+1}\mathbb{E}\,p_{X_n}^r({1}/{(np_n^*)^{r-s}})\to\infty$
.
We also need the following simple estimate of the tail of a binomial sum.
Lemma 2. Let m,n be positive integers such that
 $m\le n$
, and let
 $p\in(0,1)$
. Then
 \begin{equation} \sum_{i=m}^n\left(\begin{array}{c}n\\i\end{array}\right)p^i(1-p)^{n-i}\le \frac{(np)^m}{m!}. \end{equation}
Proof. The left-hand side of (23) is
 $\mathbb{P}(B_n\ge m)$
, where
 $B_n$
has distribution
 $\operatorname{Bin}\!(n,p)$
. We argue by induction on
 $n\ge m$
. Note that for
 $n=m$
the left-hand side of (23) is
 $p^m$
and the right-hand side is
 $({m^m}/{m!})p^m$
. Since
 $m^m\ge m!$
the result follows. For any
 $n\ge 1$
, by induction we have
 \begin{align*} \mathbb{P}(B_{n+1}\ge m) & = \mathbb{P}(B_n\ge m-1)p+\mathbb{P}(B_n\ge m)(1-p) \\ & \le \frac{(np)^{m-1}}{(m-1)!}p+\frac{(np)^m}{m!}(1-p) \le \frac{((n+1)p)^m}{m!}, \end{align*}
where the last inequality follows from
 $mn^{m-1}+n^m(1-p)\le(n+1)^m$
.
4. Proof of Theorems
4.1. Poisson convergence
The proof of Theorem 1 is based on the following theorem due to [Reference Beśka, Kłopotowski and Słomiński3]; see Corollary 5 therein.
Theorem 5. Let
 $\{Y_{n,k},\,k=1,\ldots,n;\,n\ge 1\}$
be a double sequence of non-negative random variables adapted to a row-wise increasing double sequence of
 $\sigma$
-fields
 $\{\mathcal{F}_{n,k},$
 $k=1,\ldots,n;\,n\ge 1\}$
, and let
 $\eta>0$
. If
 \begin{equation} \max_{1\le k\le n}\mathbb{E}(Y_{n,k} \mid \mathcal{F}_{n,k-1}) \stackrel{\mathbb{P}}{\to} 0, \end{equation}
 \begin{equation} \sum_{k=1}^n\mathbb{E}(Y_{n,k} \mid \mathcal{F}_{n,k-1}) \stackrel{\mathbb{P}}{\to} \eta , \\ \end{equation}
 \begin{equation} \sum_{k=1}^n\mathbb{E}(Y_{n,k}\textbf{1}_{\{|Y_{n,k}-1|>\varepsilon\}} \mid \mathcal{F}_{n,k-1}) \stackrel{\mathbb{P}}{\to} 0 \quad \text{for any $\varepsilon > 0$}, \end{equation}
then
 $\sum_{k=1}^nY_{n,k}\stackrel{\textrm{d}}{\to}\textrm{Pois}(\eta)$
.
Proof of Theorem
1.We show that conditions (24), (25) (with
 $\eta=\mu$
), and (26) of Theorem 5 are satisfied for
 $Y_{n,k}$
, defined in (2). First, we note that (26) is trivial because, for
 $\varepsilon<1$
,
 $Y_{n,k}=0$
if and only if
 $\textbf{1}_{\{|Y_{n,k}-1|>\varepsilon\}}=1$
.
The rest of the proof is divided into three steps. In Step I we check (24). Then we prove that (25) holds in quadratic mean, i.e.
 $\mathbb{E}\big(\!\sum_{k=1}^n\mathbb{E}(Y_{n,k}\mid\mathcal{F}_{n,k-1}) - \mu\big)^2\to0$
. To that end we show that
 $\sum_{k=1}^n\mathbb{E}\,Y_{n,k}\to\mu$
and
 $\textrm{Var}\sum_{k=1}^n\mathbb{E}(Y_{n,k}\mid\mathcal{F}_{n,k-1})\to 0$
in Steps II and III, respectively.
Step I: We prove (24) using (17). Clearly,
 $\textbf{1}_{\{N_{n,k}(m)\ge r\}}\le \textbf{1}_{\{N_{n,l}(m)\ge r\}}$
for
 $k\le l$
, so
 $\max_{1\le k\le n}\mathbb{E}(Y_{n,k} \mid \mathcal{F}_{n,k-1})=\mathbb{E}(Y_{n,n}\mid\mathcal{F}_{n,n-1})$
. Note also that, due to (18), (23), and (20),
 $\mathbb{E}\, Y_{n,n}=\mathbb{E}\sum_{i=r}^{n-1}\scriptsize\big(\begin{array}{c}n-1\\i\end{array}\big)p_{X_n}^{i}q_{X_n}^{n-1-i}\le n^r\mathbb{E}\,p_{X_n}^r\to0$
. Consequently, Markov’s inequality implies that
 $\mathbb{E}(Y_{n,n}\mid\mathcal{F}_{n,n-1})\stackrel{\mathbb{P}}{\to}0$
, and (24) follows.
Step II: To prove that
 $\lim\sum_{k=1}^n\mathbb{E}\,Y_{n,k}= \mu$
we show that
 $\limsup$
and
 $\liminf$
are respectively bounded above and below by
 $\mu$
. From (18), (23), and (4),
 \begin{align} \sum_{k=1}^n\mathbb{E}\, Y_{n,k} = \mathbb{E}\sum_{k=1}^n\sum_{i=r}^{k-1}\left(\begin{array}{c}k-1\\i\end{array}\right)p_{X_n}^{i}q_{X_n}^{k-1-i} & \le\mathbb{E}\sum_{k=1}^n\frac{(k-1)^rp_{X_n}^r}{r!} \nonumber\\ & \le \frac{n^{r+1}}{(r+1)!}\mathbb{E}\,p_{X_n}^r\to\mu,\end{align}
so
 $\limsup\sum_{k=1}^n\mathbb{E}\,Y_{n,k}\le \mu$
.
Additionally, since by (18) we have
 $\mathbb{E}\,Y_{n,k}=\mathbb{P}(N_{n,k}(X_n)\ge r)\ge \mathbb{P}(N_{n,k}(X_n)=r)$
and
 $(1-p)^k\ge 1-kp$
,
 $p\in(0,1)$
, then
 \begin{align} \sum_{k=1}^n\mathbb{E}\,Y_{n,k}&\ge \sum_{k=1}^n\left(\begin{array}{c}k-1\\r\end{array}\right)\mathbb{E}\,p_{X_n}^{r}q_{X_n}^{k-1-r} \nonumber\\ & \ge \mathbb{E}\,p_{X_n}^{r}\sum_{k=1}^n\left(\begin{array}{c}k-1\\r\end{array}\right)-\mathbb{E}\,p_{X_n}^{r+1}\,\sum_{k=1}^n\left(\begin{array}{c}k-1\\r\end{array}\right)(k-1-r).\end{align}
Further, observe that
 \begin{equation*} \frac{(r+1)!}{n^{r+1}}\sum_{k=1}^n\left(\begin{array}{c}k-1\\r\end{array}\right)\to1 , \qquad \frac{r!(r+2)}{n^{r+2}}\sum_{k=1}^n\left(\begin{array}{c}k-1\\r\end{array}\right)\!(k-1-r)\to1.\end{equation*}
Thus, by (4) and (21), the right-hand side of (28) converges to
 $\mu$
, and so we have
 $\liminf\sum\limits_{k=1}^n\mathbb{E}\,Y_{n,k}\ge \mu$
.
Step III: We prove that
 $W_n\,:\!=\,\textrm{Var}\sum_{k=1}^n\mathbb{E}(Y_{n,k}\mid\mathcal{F}_{n,k-1})\to 0$
by relying on the NUOD property of
 $N_{n,k}(m_1)$
and
 $N_{n,\ell}(m_2)$
, for distinct
 $m_1,m_2\in M_n$
. In what follows we compute and bound some expectations that add up to
 $W_n$
. First, note from (19) that
 \begin{equation*} \begin{split} W_n&=\sum_{k,\ell=1}^{n}\textrm{Cov}(\mathbb{E}(Y_{n,k}\mid\mathcal{F}_{n,k-1}),\mathbb{E}(Y_{n,\ell}\mid\mathcal{F}_{n,l-1}))\\ &=\sum_{k,\ell=1}^{n}\textrm{Cov}(\textbf{1}_{\{N_{n,k}(X_n)\ge r\}},\textbf{1}_{\{N_{n,\ell}(Y_n)\ge r\}}). \end{split}\end{equation*}
For U, V square-integrable random variables and
 $\mathcal{G}$
a
 $\sigma$
-algebra, let the conditional covariance be defined as
 $\textrm{Cov}(U,V\mid{\mathcal{G}})=\mathbb{E}(UV\mid{\mathcal{G}})-\mathbb{E}(U\mid{\mathcal{G}})\mathbb{E}(V\mid{\mathcal{G}})$
. Also, let
 $\textbf{1}_k(m)=\textbf{1}_{\{N_{n,k}(m)\ge r\}}$
(for simplicity) and
 $k\wedge \ell=\min\{k,l\}$
. Then, by the i.i.d. assumption on
 $X_{n,1},\ldots,X_{n,n}, X_n,Y_n$
, we have
 \begin{align} \textrm{Cov}(\textbf{1}_k(X_n),\textbf{1}_\ell(Y_n)\mid X_n,Y_n) & = \mathbb{E}(\textbf{1}_k(X_n)\textbf{1}_\ell(Y_n)\mid X_n,Y_n) \nonumber\\ & \quad - \mathbb{E}(\textbf{1}_k(X_n)\mid X_n)\mathbb{E}(\textbf{1}_\ell(Y_n)\mid Y_n).\end{align}
Furthermore,
 \begin{align} \mathbb{E}(\textbf{1}_k(X_n)\textbf{1}_\ell(Y_n)\mid X_n,Y_n)\textbf{1}_{\{X_n=Y_n\}} & = \mathbb{E}(\textbf{1}_{\{X_n=Y_n\}}\textbf{1}_k(X_n)\textbf{1}_\ell(Y_n)\mid X_n,Y_n) \nonumber \\ & = \mathbb{E}(\textbf{1}_{\{X_n=Y_n\}}\textbf{1}_k(X_n)\textbf{1}_\ell(X_n)|X_n,Y_n) \nonumber \\ & = \mathbb{E}(\textbf{1}_{k\wedge \ell}(X_n)\mid X_n)\textbf{1}_{\{X_n=Y_n\}},\end{align}
where the last equality follows from
 $\textbf{1}_k(m)\le \textbf{1}_\ell(m)$
for
 $k\le \ell$
, because
 $N_{n,k}(m)\ge r$
implies
 $N_{n,\ell}(m)\ge r$
. So, from (29) and (30), we get
 \begin{equation} \textrm{Cov}(\textbf{1}_k(X_n),\textbf{1}_\ell(Y_n)\mid X_n,Y_n)\textbf{1}_{\{X_n=Y_n\}}\le\mathbb{E}(\textbf{1}_{k\wedge \ell}(X_n)\mid X_n)\textbf{1}_{\{X_n=Y_n\}}.\end{equation}
Furthermore, by the NUOD property (15),
 \begin{align} \mathbb{E}(\textbf{1}_k(X_n)\textbf{1}_\ell(Y_n)\mid X_n,Y_n) \textbf{1}_{\{X_n\ne Y_n\}} & = \mathbb{E}(\textbf{1}_{\{X_n\not=Y_n\}}\textbf{1}_k(X_n)\textbf{1}_\ell(Y_n)\mid X_n,Y_n) \nonumber \\ & \le \mathbb{E}(\textbf{1}_{\{X_n\not=Y_n\}}\textbf{1}_k(X_n)\mid X_n,Y_n)\mathbb{E}(\textbf{1}_{\{X_n\not=Y_n\}}\textbf{1}_\ell(Y_n)\mid X_n,Y_n) \nonumber \\ & = \mathbb{E}(\textbf{1}_{k}(X_n)\mid X_n)\mathbb{E}(\textbf{1}_{\ell}(Y_n)\mid Y_n)\textbf{1}_{\{X_n\not=Y_n\}}.\end{align}
Hence, from (29) and (32), we have
 \begin{equation} \textrm{Cov}(\textbf{1}_k(X_n),\textbf{1}_\ell(Y_n)\mid X_n,Y_n)\textbf{1}_{\{X_n\not=Y_n\}}\le0.\end{equation}
And, finally, from (31) and (33),
 \begin{equation} \textrm{Cov}(\textbf{1}_k(X_n),\textbf{1}_\ell(Y_n)\mid X_n,Y_n)\le\mathbb{E}(\textbf{1}_{k\wedge \ell}(X_n)\mid X_n)\textbf{1}_{\{X_n=Y_n\}}.\end{equation}
Let us write
 \begin{align*} \textrm{Cov}(\textbf{1}_k(X_n),\textbf{1}_\ell(Y_n)) & = \mathbb{E}\,\textrm{Cov}(\textbf{1}_k(X_n),\textbf{1}_\ell(Y_n)\mid X_n,Y_n) \\& \quad + \textrm{Cov}(\mathbb{E}(\textbf{1}_k(X_n)\mid X_{n},Y_n),\mathbb{E}(\textbf{1}_\ell(Y_n)\mid X_{n},Y_n)).\end{align*}
By the independence of
 $X_n$
and
 $Y_n$
we can write
 $\mathbb{E}(\textbf{1}_k(X_n)\mid X_{n},Y_n)=\mathbb{E}(\textbf{1}_k(X_n)\mid X_{n})$
and
 $\mathbb{E}(\textbf{1}_\ell(Y_n)\mid X_{n},Y_n)=\mathbb{E}(\textbf{1}_\ell(Y_n)\mid Y_n)$
. Thus, again referring to the independence of
 $X_n$
and
 $Y_n$
, we conclude that the second term above vanishes. Applying (34), we thus get
 \begin{align} \textrm{Cov}(\textbf{1}_k(X_n),\textbf{1}_\ell(Y_n)) & \le \mathbb{E}\,\mathbb{E}(\textbf{1}_{k\wedge \ell}(X_n)\mid X_n)\textbf{1}_{\{X_n=Y_n\}} \nonumber\\ & = \mathbb{E}\,\textbf{1}_{k\wedge \ell}(X_n)\textbf{1}_{\{X_n=Y_n\}} = \mathbb{E}\,\textbf{1}_{k\wedge \ell}(X_n)p^{}_{X_n}.\end{align}
Note that in the first equality above we used the identity
 $\mathbb{E}(\textbf{1}_{k\wedge \ell}(X_n)\mid X_{n}) = \mathbb{E}(\textbf{1}_{k\wedge \ell}(X_n)\mid X_{n},Y_n)$
, i.e. we referred again to the independence of
 $X_n$
and
 $Y_n$
.
Also, by (23),
 \begin{equation*} \mathbb{E}(\textbf{1}_{k\wedge \ell}(X_n)p^{}_{X_n}\mid X_n) = \sum_{i=r}^{(k\wedge \ell)-1}\left(\begin{array}{c}(k\wedge \ell)-1\\i\end{array}\right) p_{X_n}^{i}q_{X_n}^{(k\wedge \ell)-1-i}p^{}_{X_n}\le(k-1)^rp^{r+1}_{X_n}.\end{equation*}
Finally, taking expectation above and adding over k and
 $\ell$
, from (35) we obtain
 \begin{equation*} W_n\le \sum_{k,\ell=1}^n(k-1)^r\mathbb{E}\, p_{X_n}^{r+1}\le n^{r+2}\mathbb{E}\,p_{X_n}^{r+1}\to0,\end{equation*}
where convergence to 0 follows from (21). Since
 $W_n\ge 0$
, it holds that
 $W_n\to 0$
.
4.2. Gaussian convergence
The proof of Theorem 2 is split into several steps, which are presented in four subsections below. In Section 4.2.1 we decompose
 $V_{n,r}-\mathbb{E}\,V_{n,r}$
as the sum of martingale differences
 $\sum_{k=1}^nd_{n,k}$
, with suitably defined (uniformly bounded)
 $d_{n,k}$
. In Section 4.2.2 we prove Proposition 1. In Section 4.2.3 we show that
 $\textrm{Var}\sum_{k=1}^n\textrm{Var}(d_{n,k}\mid\mathcal{F}_{n,k-1})$
is
 $o((n^{r+1}\mathbb{E}\,p_{X_n}^r)^2)$
. In the final part of the proof in Section 4.2.4 we use this bound and the growth rate for
 $\textrm{Var}\,V_{n,r}$
to conclude the proof by the martingale central limit theorem.
4.2.1. Martingale differences decomposition
Lemma 3. The centered size of the overflow can be represented as
 $V_{n,r}-\mathbb{E}\,V_{n,r}=\sum_{k=1}^nd_{n,k}$
, where the
 $d_{n,k}$
are martingale differences defined by
 \begin{equation} d_{n,k}=\sum_{j=k}^n\big(\mathbb{E}(Y_{n,j}\mid\mathcal{F}_{n,k})-\mathbb{E}(Y_{n,j}\mid\mathcal{F}_{n,k-1})\big). \end{equation}
Proof. Clearly,
 $\mathbb{E}(d_{n,k}\mid\mathcal{F}_{n,k-1})=0$
. Further, noting that
 $\mathcal{F}_{n,0}$
is the trivial
 $\sigma$
-algebra,
 \begin{align*} \sum_{k=1}^{n}d_{n,k} & = \sum_{j=1}^{n}\sum_{k=1}^j(\mathbb{E}(Y_{n,j}\mid\mathcal{F}_{n,k})-\mathbb{E}(Y_{n,j}\mid\mathcal{F}_{n,k-1})) \\ & = \sum_{j=1}^{n}(\mathbb{E}(Y_{n,j}\mid\mathcal{F}_{n,j})-\mathbb{E}\,Y_{n,j})= V_{n,r}-\mathbb{E}\, V_{n,r}. \end{align*}
Lemma 4. The martingale differences
 $d_{n,k}$
of (36) are uniformly bounded and can be represented as
 \begin{equation*} d_{n,k}=\mathbb{E}\bigg(\frac{\textbf{1}_{\{X_{n,k}=X_n\}}-p^{}_{X_n}}{p^{}_{X_n}}\textbf{1}_{\{N_{n,k}(X_n)+N_{n,k+1}^{n+1}(X_n)\ge r\}} \, \Big| \, \mathcal{F}_{n,k}\bigg). \end{equation*}
Proof. Let
 $n,r\in{\mathbb N}, j> k$
and note that
 $N_{n,j}(X_n)=N_{n,k}(X_n)+\textbf{1}_{\{X_{n,k}=X_n\}}+N_{n,k+1}^j(X_n)=U_j+J$
, where, for simplicity, we let
 $V=N_{n,k}(X_n)$
,
 $U_j=V+N_{n,k+1}^j(X_n)\ge V$
, and
 $J=\textbf{1}_{\{X_{n,k}=X_n\}}$
. Then
 $\{U_j+J\ge r\}=\{U_j\ge r\}\cup\{U_j= r-1,J=1 \}$
. Clearly,
 $\{V\ge r \}\subseteq \{U_j\ge r\}$
, and thus we have
 $\{U_j+J\ge r \}=\{V\ge r \}\cup \{U_j\ge r, V<r\}\cup\{U_j= r-1,J=1\}$
. Consequently, by (16) we can write
 \begin{equation*} \begin{split} \mathbb{E}(Y_{n,j}\mid\mathcal{F}_{n,k}) & = \mathbb{E}(\textbf{1}_{\{V\ge r\}}\mid\mathcal{F}_{n,k}) + \mathbb{E}(\textbf{1}_{\{U_j\ge r,V<r\}}\mid\mathcal{F}_{n,k}) + \mathbb{E}(\textbf{1}_{\{U_j= r-1,J=1\}}\mid\mathcal{F}_{n,k}) \\ & = \mathbb{E}(\textbf{1}_{\{V\ge r\}}\mid\mathcal{F}_{n,k-1}) + \mathbb{E}(\textbf{1}_{\{U_j\ge r,V<r\}}\mid\mathcal{F}_{n,k-1}) + \mathbb{E}(J\textbf{1}_{\{U_j= r-1\}}\mid\mathcal{F}_{n,k}), \end{split} \end{equation*}
where
 $\mathcal{F}_{n,k}$
is changed to
 $\mathcal{F}_{n,k-1}$
in the first two conditional expectations due to the independence of
 $X_{n,k}$
and
 $(X_{n,j},\;j\in\{1,\ldots,n\}\setminus\{k\})$
(note that V and
 $U_j$
depend only on the latter set of variables and do not depend on
 $X_{n,k}$
). Similarly,
 $\mathbb{E}(Y_{n,j}\mid\mathcal{F}_{n,k-1}) = \mathbb{E}(\textbf{1}_{\{V\ge r\}}\mid \mathcal{F}_{n,k-1}) + \mathbb{E}(\textbf{1}_{\{U_j\ge r,V<r\}}\mid \mathcal{F}_{n,k-1}) + \mathbb{E}(J\textbf{1}_{\{U_j= r-1\}}\mid \mathcal{F}_{n,k-1})$
. Also, note that
 $\mathbb{E}\!\left(J\textbf{1}_{\{U_j= r-1\}}\mid \mathcal{F}_{n,k-1}\right)=\mathbb{E}\!\left(\textbf{1}_{\{U_j= r-1\}}p^{}_{X_n} \mid \mathcal{F}_{n,k}\right)$
. Therefore, for
 $j>k$
,
 $\mathbb{E}(Y_{n,j}\mid \mathcal{F}_{n,k})-\mathbb{E}(Y_{n,j}\mid \mathcal{F}_{n,k-1})=\mathbb{E}\!\left(\textbf{1}_{\{U_j= r-1\}}(J-p^{}_{X_n}) \mid \mathcal{F}_{n,k}\right)$
. Thus,
 \begin{equation*} e_{n,k} \,:\!=\, \sum_{j=k+1}^{n}(\mathbb{E}(Y_{n,j}\mid \mathcal{F}_{n,k})-\mathbb{E}(Y_{n,j}\mid \mathcal{F}_{n,k-1})) =\mathbb{E}\Bigg((J-p^{}_{X_n}) \sum_{j=k+1}^{n}\textbf{1}_{\{U_j= r-1\}} \, \Big| \, \mathcal{F}_{n,k}\Bigg). \end{equation*}
Observe that, for
 $j>k$
,
 \begin{equation*}\mathbb{E}\bigg(\frac{\textbf{1}_{\{X_{n,j}=X_n\}}}{p_{X_n}} \, \Big| \, X_n, \mathcal{F}_{n,j-1}\bigg)=1.\end{equation*}
Then
 \begin{equation*} \begin{split} e_{n,k} & = \mathbb{E}\Bigg((J-p^{}_{X_n}) \sum_{j=k+1}^{n}\textbf{1}_{\{U_j= r-1\}}\mathbb{E}\bigg(\frac{\textbf{1}_{\{X_{n,j}=X_n\}}}{p_{X_n}} \, \Big| \, X_n, \mathcal{F}_{n,j-1}\bigg) \, \Big| \, \mathcal{F}_{n,k}\Bigg) \\ & = \mathbb{E}\Bigg(\mathbb{E}\Bigg(\frac{J-p^{}_{X_n}}{p^{}_{X_n}} \sum_{j=k+1}^{n}\textbf{1}_{\{U_j= r-1\}}\textbf{1}_{\{X_{n,j}=X_n\}} \, \Big| \, X_n, \mathcal{F}_{n,j-1}\Bigg) \, \Big| \, \mathcal{F}_{n,k}\Bigg) \\ & = \mathbb{E}\Bigg(\frac{J-p^{}_{X_n}}{p^{}_{X_n}}\textbf{1}_{\{V<r\}} \sum_{j=k+1}^{n}\textbf{1}_{\{U_j= r-1\}}\textbf{1}_{\{X_{n,j}=X_n\}} \, \Big| \, \mathcal{F}_{n,k}\Bigg), \end{split} \end{equation*}
where in the last expression we used the fact that
 $\{V<r\}\supset \{U_j=r-1\}$
for
 $j>k$
. Observe also that
 $\sum_{j=k+1}^{n}\textbf{1}_{\{U_j= r-1\}}\textbf{1}_{\{X_{n,j}=X_n\}}=\textbf{1}_{\{U_j=r-1, U_{j+1}=r,\text{ for some } j\in\{k+1,\ldots,n\}\}}$
is equal to
 $\textbf{1}_{\{U_{n+1}\ge r\}}$
on the event
 $\{V<r\}$
(note that
 $U_{k+1}=V$
). That is, using the original notation,
 \begin{equation*} \sum_{j=k+1}^n\textbf{1}_{\{N_{n,k}(X_n)+N_{n,k+1}^j(X_n)=r-1\}}\textbf{1}_{\{X_{n,j}=X_n\}}=\textbf{1}_{\{N_{n,k}(X_n)+N_{n,k+1}^{n+1}(X_n)\ge r\}} \end{equation*}
on the event
 $\{N_{n,k}(X_n)<r\}$
, and so
 \begin{equation*} e_{n,k}=\mathbb{E}\bigg(\frac{\textbf{1}_{\{X_{n,k}=X_n\}}-p^{}_{X_n}}{p^{}_{X_n}}\textbf{1}_{\{N_{n,k}(X_n)<r\}} \textbf{1}_{\{N_{n,k}(X_n)+N_{n,k+1}^{n+1}(X_n)\ge r\}} \, \Big| \, \mathcal{F}_{n,k}\bigg). \end{equation*}
Finally, since
 \begin{equation*} Y_{n,k}-\mathbb{E}(Y_{n,k}\mid \mathcal{F}_{n,k-1}) = \mathbb{E}\bigg(\frac{\textbf{1}_{\{X_{n,k}=X_n\}}-p^{}_{X_n}}{p^{}_{X_n}}\textbf{1}_{\{N_{n,k}(X_n)\ge r\}}\,\Big|\,\mathcal{F}_{n,k}\bigg), \end{equation*}
we conclude that
 \begin{align} & d_{n,k} = Y_{n,k}-\mathbb{E}(Y_{n,k}\mid \mathcal{F}_{n,k-1})+e_{n,k} \nonumber \\ & = \mathbb{E}\bigg(\frac{\textbf{1}_{\{X_{n,k}=X_n\}}-p^{}_{X_n}}{p^{}_{X_n}}\big(\textbf{1}_{\{N_{n,k}(X_n)\ge r\}}+\textbf{1}_{\{N_{n,k}(X_n)<r\}} \textbf{1}_{\{N_{n,k}(X_n)+N_{n,k+1}^{n+1}(X_n)\ge r\}}\big)\,\Big|\,\mathcal{F}_{n,k}\bigg) \nonumber \\ & = \mathbb{E}\bigg(\frac{\textbf{1}_{\{X_{n,k}=X_n\}}-p^{}_{X_n}}{p^{}_{X_n}}\textbf{1}_{\{N_{n,k}(X_n)+N_{n,k+1}^{n+1}(X_n)\ge r\}}\,\Big|\,\mathcal{F}_{n,k}\bigg). \end{align}
For the boundedness of
 $d_{n,k}$
, note that
 \begin{equation*} |d_{n,k}|\le \mathbb{E}\bigg(\bigg|\frac{\textbf{1}_{\{X_{n,k}=X_n\}}-p^{}_{X_n}}{p^{}_{X_n}}\bigg| \, \Big| \, \mathcal{F}_{n,k}\bigg)\le \sum_{m\in M_n}\big|\textbf{1}_{\{X_{n,k}=m\}}-p_{n,m}\big|\le2. \end{equation*}
4.2.2. Growth rate of the expected value and variance
Proof of Proposition 1.We first prove (8). For the upper bound in (8) note that, by the representation in (3) and the estimates in (27), it follows that
 \begin{equation*} \frac{\mathbb{E}\,V_{n,r}}{n^{r+1}\mathbb{E}\,p_{X_n}^r}\le \frac{1}{(r+1)!}. \end{equation*}
Similarly, for the lower bound, by the first part of (28) we have
 \begin{equation*} \mathbb{E}\,V_{n,r} \ge \mathbb{E}\sum_{k=1}^n\binom{k-1}{r}p_{X_n}^r(1-p_{X_n})^{k-r-1} \ge \mathbb{E}\,p_{X_n}^r\sum_{k=1}^n\binom{k-1}{r}(1-p_n^*)^{k-r-1}. \end{equation*}
Since, for any m and any odd j, we have
 $(1-x)^m\ge \sum_{i=0}^j\,\tbinom{m}{i}\,({-}x)^i$
, we get, for any odd j,
 \begin{equation*} \begin{split} \frac{\mathbb{E}\,V_{n,r}}{n^{r+1}\mathbb{E}\,p_{X_n}^r} & \ge \frac{1}{n^{r+1}}\sum_{k=1}^n\binom{k-1}{r}\sum_{i=0}^j\binom{k-r-1}{i}({-}p_n^*)^i \\ & = \sum_{i=0}^j({-}1)^i(np_n^*)^i\frac{\sum_{k=1}^n\tbinom{k-1}{r}\tbinom{k-r-1}{i}}{n^{r+i+1}}. \end{split} \end{equation*}
Note that
 \begin{equation*} \begin{split} \frac{1}{n^{r+i+1}}\sum_{k=1}^n\binom{k-1}{r}\binom{k-r-1}{i} & = \frac{1}{n^{r+i+1}r!i!}\sum_{k=1}^n\frac{(k-1)!}{(k-i-r-1)!} \\ & = \frac{\tbinom{r+i}{r}\tbinom{n}{r+i+1}}{n^{r+i+1}}\to\frac{1}{r!i!(r+i+1)}. \end{split} \end{equation*}
Consequently,
 \begin{equation*} \begin{split} \liminf\frac{\mathbb{E}\,V_{n,r}}{n^{r+1}\mathbb{E}\,p_{X_n}^r} & \ge \frac{1}{r!}\sum_{i=0}^{\infty}\frac{({-}\lambda)^i}{i!(i+r+1)} \\ & = \frac{1}{r!}\sum_{i=0}^{\infty} \frac{({-}\lambda)^i}{i!}\int_0^{1}x^{r+i}\,\textrm{d} x = \frac1{r!}\int_0^{1}x^r\textrm{e}^{-\lambda x}\,\textrm{d} x = \frac{\Gamma_\lambda(r+1)}{r!}, \end{split} \end{equation*}
which proves the lower bound in (8).
To prove (9), let
 $p_x=p_{n,x}$
,
 $q_x=1-p_x$
, and
 \begin{equation} T_{n,k}(x)=\sum_{i=r-N_{n,k}(x)}^{n-k}\binom{n-k}{i}p_{x}^iq_{x}^{n-k-i}. \end{equation}
Then
 \begin{align*} & \mathbb{E}\bigg(\frac{\textbf{1}_{\{X_{n,k}=X_n\}}-p^{}_{X_n}}{p^{}_{X_n}}\textbf{1}_{\{N_{n,k}(X_n)+N_{n,k+1}^{n+1}(X_n)\ge r\}} \, \Big| \, X_n,\mathcal{F}_{n,k}\bigg) \\& \qquad = \mathbb{E}\bigg(\frac{\textbf{1}_{\{X_{n,k}=X_n\}}-p^{}_{X_n}}{p^{}_{X_n}}T_{n,k}(X_n)\,\Big|\,X_n,\mathcal{F}_{n,k}\bigg) , \end{align*}
and so
 \begin{equation*} d_{n,k}=\mathbb{E}\bigg(\frac{\textbf{1}_{\{X_{n,k}=X_n\}}-p^{}_{X_n}}{p^{}_{X_n}}T_{n,k}(X_n)\,\Big|\,\mathcal{F}_{n,k}\bigg). \end{equation*}
Also, recalling that
 $X_n,Y_n, X_{n,1},\ldots,X_{n,n}$
are i.i.d.,
 \begin{equation*} \begin{split} d_{n,k}^2 & = \mathbb{E}\bigg(\frac{\textbf{1}_{\{X_{n,k}=X_n\}}-p^{}_{X_n}}{p^{}_{X_n}}T_{n,k}(X_n)\,\Big|\,\mathcal{F}_{n,k}\bigg)\mathbb{E}\bigg(\frac{\textbf{1}_{\{X_{n,k}=Y_n\}}-p^{}_{Y_n}}{p^{}_{Y_n}}T_{n,k}(Y_n)\,\Big|\,\mathcal{F}_{n,k}\bigg) \\ & = \mathbb{E}\bigg(\frac{\textbf{1}_{\{X_{n,k}=X_n\}}-p^{}_{X_n}}{p^{}_{X_n}}T_{n,k}(X_n)\frac{\textbf{1}_{\{X_{n,k}=Y_n\}}-p^{}_{Y_n}}{p^{}_{Y_n}}T_{n,k}(Y_n)\,\Big|\,\mathcal{F}_{n,k}\bigg), \end{split} \end{equation*}
where the second equality follows from the conditional independence, given
 $\mathcal{F}_{n,k}$
, of
 \begin{equation*} \frac{\textbf{1}_{\{X_{n,k}=X_n\}}-p^{}_{X_n}}{p^{}_{X_n}} T_{n,k}(X_n) \quad \textrm{and} \quad \frac{\textbf{1}_{\{X_{n,k}=Y_n\}}-p^{}_{Y_n}}{p^{}_{Y_n}}T_{n,k}(Y_n). \end{equation*}
In what follows we compute
 $\mathbb{E}\big(d_{n,k}^2\mid \mathcal{F}_{n,k-1}\big)$
by considering the cases
 $X_n=Y_n$
and
 $X_n\not=Y_n$
. We get
 \begin{align*} \mathbb{E}(d_{n,k}^2\mid \mathcal{F}_{n,k-1}) & = \mathbb{E}\bigg(\textbf{1}_{\{X_n=Y_n\}}\bigg(\tfrac{\textbf{1}_{\{X_{n,k}=X_n\}}-p^{}_{X_n}}{p^{}_{X_n}}\bigg)^2T_{n,k}^2(X_n)\,\Big|\,\mathcal{F}_{n,k-1}\bigg) \\ & \quad + \mathbb{E}\bigg(\textbf{1}_{\{X_n\not=Y_n\}}\frac{(\textbf{1}_{\{X_{n,k}=X_n\}}-p^{}_{X_n})(\textbf{1}_{\{X_{n,k}=Y_n\}}-p^{}_{Y_n})}{p^{}_{X_n}p^{}_{Y_n}}T_{n,k}(X_n)T_{n,k}(Y_n)\,\Big|\,\mathcal{F}_{n,k-1}\bigg) \\ & \quad = \mathbb{E}\bigg(\textbf{1}_{\{X_n=Y_n\}}\frac{1-p^{}_{X_n}}{p^{}_{X_n}}T_{n,k}^2(X_n) \, \Big| \, \mathcal{F}_{n,k-1}\bigg)\\ & \quad - \mathbb{E}\big(\textbf{1}_{\{X_n\not=Y_n\}}T_{n,k}(X_n)T_{n,k}(Y_n)\mid \mathcal{F}_{n,k-1}\big), \end{align*}
where the second equality above is obtained from conditioning inside both expectations with respect to
 $X_n, Y_n,\mathcal{F}_{n,k-1}$
. Finally, integrating out
 $Y_n$
in the first expectation we get
 \begin{align} \mathbb{E}(d_{n,k}^2\mid \mathcal{F}_{n,k-1}) & = \mathbb{E}(q^{}_{X_n} T_{n,k}^2(X_n)\mid \mathcal{F}_{n,k-1}) \nonumber\\ & \quad - \mathbb{E}(\textbf{1}_{\{X_n\not=Y_n\}}T_{n,k}(X_n)T_{n,k}(Y_n)\mid \mathcal{F}_{n,k-1}), \end{align}
and consequently
 \begin{equation} \textrm{Var}\, d_{n,k}=\mathbb{E}\, d_{n,k}^2=\mathbb{E}\,q^{}_{X_n} T_{n,k}^2(X_n)-\mathbb{E}\,\textbf{1}_{\{X_n\not=Y_n\}}T_{n,k}(X_n)T_{n,k}(Y_n). \end{equation}
For the upper bound of the variance, note that
 $0<T_{n,k}(X_n)\le 1$
and thus (40) implies
 $\textrm{Var}\,d_{n,k}\le\mathbb{E}\, d_{n,k}^2\le\mathbb{E}\,T_{n,k}(X_n)$
. Also,
 $\mathbb{E}( T_{n,k}(X_n)\mid X_n,\mathcal{F}_{n,k})=\mathbb{P}( N_{n,k}(X_n)+N_{n,k+1}^{n+1}(X_n)\ge r\mid X_n,\mathcal{F}_{n,k})$
, and so
 \begin{align} \mathbb{E}( T_{n,k}(X_n)\mid X_n) & = \mathbb{P}( N_{n,k}(X_n)+N_{n,k+1}^{n+1}(X_n)\ge r\mid X_n) \nonumber\\ & \le \mathbb{P}( N_{n,n+1}(X_n)\ge r\mid X_n). \end{align}
Now, recalling that
 $N_{n,n+1}(m)$
has distribution
 $\operatorname{Bin}\!(n, p_{n,m})$
for
 $m\in M_n$
, and using (23), the right-hand side of (41) is bounded by
 $n^rp^r_{X_n}/r!$
. Last, taking expectations, we obtain
 $\textrm{Var}\,d_{n,k}\le n^r\mathbb{E}\, p^r_{X_n}/r!$
, and consequently
 \begin{equation} \textrm{Var}\,V_{n,r}= \sum_{k=1}^n\,\textrm{Var}\,d_{n,k}\le \frac{n^{r+1}\mathbb{E}\,p_{X_n}^r}{r!}. \end{equation}
In order to bound
 $\textrm{Var}\,d_{n,k}$
from below we first find an upper bound for the last term (with the minus sign) in (40). To that end, note that
 $T_{n,k}(x)$
, defined in (38), can be written as
 $T_{n,k}(x)=\mathbb{P}(B_{n-k}(x)+N_{n,k}(x)\ge r\mid \mathcal{F}_{n,k})$
, where
 $B_{n-k}(x)$
is
 $\operatorname{Bin}\!(n-k,p_x)$
, independent of
 $X_n,Y_n,\mathcal{F}_{n,n}$
, so
 $T_{n,k}(X_n)=\mathbb{P}(B_{n-k}(X_n)+N_{n,k}(X_n)\ge r\mid X_n,\mathcal{F}_{n,k})$
and
 \begin{equation} \mathbb{E}(T_{n,k}(x)\mid X_n)=\mathbb{P}(B_{n-k}(x)+N_{n,k}(x)\ge r\mid X_n). \end{equation}
Furthermore, for
 $y\ne x$
let
 $B_{n-k}(y)$
be a
 $\operatorname{Bin}\!(n-k,p_y)$
random variable, independent of
 $X_n,Y_n,\mathcal{F}_{n,n}$
and independent of
 $B_{n-k}(x)$
. Then
 $J_{n,k}\,:\!=\,\mathbb{E}(\textbf{1}_{\{X_n\not=Y_n\}}T_{n,k}(X_n)T_{n,k}(Y_n)\mid X_n,Y_n,\mathcal{F}_{n,k})$
can be written as
 $J_{n,k}=\mathbb{P}(X_n\not=Y_n, B_{n,k}(X_n)+N_{n,k}(X_n)\ge r, B_{n,k}(Y_n)+N_{n,k}(Y_n)\ge r\mid X_n,Y_n,\mathcal{F}_{n,k})$
, and so
 $\mathbb{E}(J_{n,k}\mid X_n,Y_n)=\mathbb{P}(X_n\not=Y_n, B_{n,k}(X_n)+N_{n,k}(X_n)\ge r,$
 $B_{n,k}(Y_n)+N_{n,k}(Y_n)\ge r\mid X_n,Y_n)$
. Then, since conditionally on
 $X_n, Y_n$
,
 $(N_{n,k}(X_n), N_{n,k}(Y_n))$
is
 $\textrm{Mn}_2(k-1,p_{X_n},p_{Y_n})$
, and because of the NUOD property, we have
 \begin{align*} \mathbb{E}(J_{n,k}\mid X_n,Y_n) & \le \textbf{1}_{\{X_n\not=Y_n\}}\mathbb{P}(B_{n,k}(X_n)+N_{n,k}(X_n)\ge r\mid X_n,Y_n) \\ & \quad \times \mathbb{P}(B_{n,k}(Y_n)+N_{n,k}(Y_n)\ge r\mid X_n,Y_n) \\ & = \textbf{1}_{\{X_n\not=Y_n\}}\mathbb{P}(B_{n,k}(X_n)+N_{n,k}(X_n)\ge r\mid X_n) \\ & \quad \times \mathbb{P}(B_{n,k}(Y_n)+N_{n,k}(Y_n)\ge r\mid Y_n) \\ & = \textbf{1}_{\{X_n\not=Y_n\}}\mathbb{E}(T_{n,k}(X_n)\mid X_n)\mathbb{E}(T_{n,k}(Y_n)\mid Y_n) \\ & = \mathbb{E}(T_{n,k}(X_n)\mid X_n)\mathbb{E}(T_{n,k}(Y_n)\mid Y_n)-\textbf{1}_{\{X_n=Y_n\}}(\mathbb{E}(T_{n,k}(X_n)\mid X_n))^2, \end{align*}
where the second equality follows from the NUOD property and the third from (43). Finally, taking expectations and using the independence of
 $X_n$
and
 $Y_n$
, we get
 $\mathbb{E}\, J_{n,k}\le(\mathbb{E}\, T_{n,k}(X_n))^2-\mathbb{E} \,p^{}_{X_n}(\mathbb{E}(T_{n,k}(X_n)\mid X_n))^2$
. Replacing the rightmost expectation in (40) by this bound, we have
 \begin{align*} \textrm{Var}\,d_{n,k} & \ge \mathbb{E}\,T^2_{n,k}(X_n)-\mathbb{E}\,p^{}_{X_n} T_{n,k}^2(X_n)-(\mathbb{E}\,T_{n,k}(X_n))^2 + \mathbb{E}\,p^{}_{X_n}(\mathbb{E}\,T_{n,k}(X_n)\mid X_n)^2 \\ & = \textrm{Var}\,T_{n,k}(X_n)-\mathbb{E}\,p^{}_{X_n}\textrm{Var}(T_{n,k}(X_n)\mid X_n) \\ & \ge \mathbb{E}\,\textrm{Var}(T_{n,k}(X_n)\mid X_n)-\mathbb{E}\,p^{}_{X_n}\textrm{Var}(T_{n,k}(X_n)\mid X_n). \end{align*}
Note also that
 \begin{equation*} \begin{split} \mathbb{E}\,p^{}_{X_n}\textrm{Var}(T_{n,k}(X_n)\mid X_n) & \le \mathbb{E}\,p^{}_{X_n}\mathbb{E}(T^2_{n,k}(X_n)\mid X_n) \\ & \le \mathbb{E}\,p^{}_{X_n} T_{n,k}(X_n) \le \frac{n^{r}\mathbb{E}\,p_{X_n}^{r+1}}{r!} \le \frac{np_n^*}{nr!}\,n^{r}\mathbb{E}\,p_{X_n}^r. \end{split} \end{equation*}
Thus, since
 $np_n^*$
is bounded,
 \begin{equation*}\sum_{k=1}^n\textrm{Var}\,d_{n,k}\ge \sum_{k=1}^n\mathbb{E}\,\textrm{Var}(T_{n,k}(X_n)\mid X_n)+o(n^{r+1}\mathbb{E}\,p_{X_n}^r).\end{equation*}
Finally, observe that
 $T_{n,k}(x)$
can be written in the form
 $T_{n,k}(x)=\sum_{j=0}^{\infty}P_{j}(x)\textbf{1}_j(x)$
, where
 $P_{j}(x)=\tbinom{n-k}{j}\,p_{x}^j\,q_{x}^{n-k-j}$
and
 $\textbf{1}_j(x)=\textbf{1}_{\{N_{n,k}(x)\ge r-j\}}$
. Therefore,
 \begin{equation*} \textrm{Var}\,T_{n,k}(x)=\sum_{j=0}^{\infty}P_j^2(x)\textrm{Var}\,\textbf{1}_j(x)+2\sum_{j_1<j_2}P_{j_1}(x)P_{j_2}(x)\textrm{Cov}\!\left(\textbf{1}_{j_1}(x),\textbf{1}_{j_2}(x)\right). \end{equation*}
Since
 $\textbf{1}_{j_1}(x)\le \textbf{1}_{j_2}(x)$
, it follows that the double sum above is non-negative and so
 \begin{equation*} \begin{split} \textrm{Var}\,T_{n,k}(x) & \ge \sum_{j=0}^{\infty}P_j^2(x)\textrm{Var}\,\textbf{1}_j(x) \ge P_0^2(x)\textrm{Var}\,\textbf{1}_0(x) \\ & = (1-p_x)^{2(n-k)}\mathbb{P}(N_{n,k}(x)\ge r)\mathbb{P}(N_{n,k}(x)< r) \\ & \ge (1-p_x)^{2(n-k)}\mathbb{P}(N_{n,k}(x)= r)\mathbb{P}(N_{n,k}(x)=0) \\ & = \binom{k-1}{r}p_x^r(1-p_x)^{2n-r-2} \ge \binom{k-1}{r}p_x^r(1-p_n^*)^{2n}. \end{split} \end{equation*}
Consequently,
 $\textrm{Var} (T_{n,k}(X_n)\mid X_n)\ge \tbinom{k-1}{r}p^{r}_{X_n}(1-p_n^*)^{2n}$
, and so
 $\sum_{k=1}^n\textrm{Var}\,d_{n,k}\ge (1-p_n^*)^{2n}\mathbb{E}\,p_{X_n}^r \sum_{k=1}^n\tbinom{k-1}{r}+o(n^{r+1}\mathbb{E}\,p_{X_n}^r)$
. Finally, since
 $\limsup np_n^*=\lambda$
,
 \begin{equation*} \liminf\frac{\sum_{k=1}^n\textrm{Var}\,d_{n,k}}{n^{r+1}\mathbb{E}\,p_{X_n}^r } \ge \liminf\frac{(1-p_n^*)^{2n}}{(r+1)!}=\frac{\textrm{e}^{-2\lambda}}{(r+1)!}.\end{equation*}
4.2.3. Variance of the sum of conditional variances
Lemma 5. Under the hypotheses of Theorem 2,
 \begin{equation} W_n\,:\!=\,\textrm{Var}\sum_{k=1}^n\mathbb{E}(d_{n,k}^2\mid \mathcal{F}_{n,k-1})=o((n^{r+1}\mathbb{E}\,p_{X_n}^r)^2). \end{equation}
Proof. We first rewrite (39) as
 $\mathbb{E}(d_{n,k}^2\mid \mathcal{F}_{n,k-1}) = \mathbb{E}(A_{n,k}(X_n)-B_{n,k}(X_n,Y_n)\mid \mathcal{F}_{n,k-1})=\alpha_{n,k}-\beta_{n,k}$
, where
 $A_{n,k}(x)=q_{x}T_{n,k}^2(x)$
,
 $B_{n,k}(x,y)=\textbf{1}_{\{x\neq y\}}T_{n,k}(x)T_{n,k}(y)$
,
 $\alpha_{n,k}=\mathbb{E}(A_{n,k}(X_n)\mid \mathcal{F}_{n,k-1})$
, and
 $\beta_{n,k}=\mathbb{E}(B_{n,k}(X_n,Y_n)\mid \mathcal{F}_{n,k-1})$
. So, letting
 $W_n^\alpha=\textrm{Var}\sum_{k=1}^n\alpha_{n,k}$
and
 $W_n^\beta=\textrm{Var}\sum_{k=1}^n\beta_{n,k}$
, and noting that
 $\textrm{Var} (X+Y)\le 2(\textrm{Var}\, X+\textrm{Var}\, Y)$
, we have
 \begin{equation} W_n\le 2W_n^\alpha+2W_n^\beta. \end{equation}
Then,
 \begin{equation} W_n^\alpha=\sum_{k=1}^n\textrm{Var}\,\alpha_{n,k}+2\sum_{1\le k<\ell\le n}\textrm{Cov}(\alpha_{n,k},\alpha_{n,\ell}), \end{equation}
and the analogous formula holds for
 $W_n^\beta$
. In what follows we express the variances and covariances of
 $\alpha_{n,k}$
and
 $\beta_{n,k}$
in terms of
 $A_{n,k}(X_n)$
and
 $B_{n,k}(X_n,Y_n)$
. For simplicity, let
 $Z_n=$
 $(X_n,Y_n)$
,
 $Z^{\prime}_n=(X^{\prime}_n,Y^{\prime}_n)$
; then
 $\textrm{Var}\, \alpha_{n,k} = \textrm{Cov}(A_{n,k}(X_n),A_{n,k}(X^{\prime}_n))$
,
 $\textrm{Cov}(\alpha_{n,k},\alpha_{n,\ell})=\textrm{Cov}(A_{n,k}$
 $(X_n),A_{n,\ell}(X^{\prime}_n))$
,
 $\textrm{Var}\, \beta_{n,k} = \textrm{Cov}(B_{n,k}(Z_n),B_{n,k}(Z^{\prime}_n))$
, and
 $\textrm{Cov}(\beta_{n,k},\beta_{n,\ell})=\textrm{Cov}(B_{n,k}(Z_n),$
 $B_{n,\ell}(Z^{\prime}_n))$
, where
 $X^{\prime}_n$
and
 $Y^{\prime}_n$
are such that
 $X_n$
,
 $X^{\prime}_n$
,
 $Y_n$
,
 $Y^{\prime}_n$
,
 $X_{n,1}$
, …,
 $X_{n,n}$
are i.i.d. for any
 $n\ge 1$
. We only check the first formula; the others are obtained similarly:
 \begin{equation*} \begin{split} \mathbb{E}\,\alpha_{n,k}^2 & = \mathbb{E}(\mathbb{E}(A_{n,k}(X_n)\mid \mathcal{F}_{n,k-1})\mathbb{E}(A_{n,k}(X^{\prime}_n)\mid \mathcal{F}_{n,k-1})) \\ & = \mathbb{E}(\mathbb{E}(A_{n,k}(X_n)A_{n,k}(X^{\prime}_n)\mid \mathcal{F}_{n,k-1})) \\ & = \mathbb{E}(A_{n,k}(X_n)A_{n,k}(X^{\prime}_n)), \\ (\mathbb{E}\,\alpha_{n,k})^2 & = (\mathbb{E}\,A_{n,k}(X_n))^2=(\mathbb{E}\,A_{n,k}(X_n))(\mathbb{E}\,A_{n,k}(X^{\prime}_n)), \end{split} \end{equation*}
and the formula for
 $\textrm{Var}\, \alpha_{n,k}$
follows.
We now compute bounds for the covariances defined above. Since
 $A_{n,k}(x)$
and
 $B_{n,k}(x,y)$
are bounded above by
 $T_{n,k}(x)\le 1$
, reasoning as in the paragraph preceding (42) we have
 \begin{equation} \textrm{Cov}(A_{n,k}(X_n),A_{n,k}(X^{\prime}_n)) \le \mathbb{E}\,A_{n,k}(X_n)A_{n,k}(X^{\prime}_n) \le \mathbb{E}\,T_{n,k}(X_n)\le n^{r}\mathbb{E}\,p_{X_n}^r \end{equation}
 \begin{equation} \textrm{Cov}(B_{n,k}(Z_n),B_{n,k}(Z^{\prime}_n)) \le \mathbb{E}\,B_{n,k}(Z_n)B_{n,k}(Z^{\prime}_n) \le \mathbb{E}\,T_{n,k}(X_n)\le n^{r}\mathbb{E}\,p_{X_n}^r. \end{equation}
Next, we handle
 $\textrm{Cov}(A_{n,k}(X_n),A_{n,\ell}(X^{\prime}_n))$
, which requires somewhat more effort than the previous covariances because the crude bounds do not yield the right order in n. Since
 $A_{n,k}(x)=(1-p_x)T^2_{n,k}(x)$
,
 \begin{equation} \textrm{Cov}(A_{n,k}(X_n),A_{n,\ell}(X^{\prime}_n))=\textrm{Cov}(T_{n,k}^2(X_n),T^2_{n,\ell}(X^{\prime}_n))+O(n^r\mathbb{E}\,p_{X_n}^{r+1}) \end{equation}
because each of the remaining three covariances is bounded by an expression of the form
 $\mathbb{E}\, p_{X_n}T_{n,k}(X_n)\le cn^r\mathbb{E}\, p_{X_n}^{r+1}$
. To bound the covariance between
 $T_{n,k}^2(X_n)$
and
 $T^2_{n,\ell}(X^{\prime}_n)$
we write
 \begin{align} \mathbb{E}\, T^2_{n,k}(X_n) T^2_{n,\ell}(X^{\prime}_n) & = \mathbb{E} \, \textbf{1}_{\{X_n=X^{\prime}_n\}}T^2_{n,k}(X_n) T^2_{n,\ell}(X_n) \nonumber\\ & \quad + \mathbb{E} \, \textbf{1}_{\{X_n\ne X^{\prime}_n\}}T^2_{n,k}(X_n) T^2_{n,\ell}(X^{\prime}_n) \end{align}
and note that the first expectation in (50) is bounded by
 \begin{equation} \mathbb{E}\, \textbf{1}_{\{X_n=X^{\prime}_n\}}T_{n,k}(X_n)=\mathbb{E}\, p_{X_n}T_{n,k}(X_n)\le cn^r\mathbb{E}\, p_{X_n}^{r+1}, \end{equation}
where c is a positive constant. For the second expectation in (50) we have the following expression, written in terms of (conditionally independent) binomial random variables
 $B_1$
,
 $B_2$
,
 $B^{\prime}_1$
,
 $B^{\prime}_2$
:
 \begin{align} \mathbb{E} \, \textbf{1}_{\{X_n\ne X^{\prime}_n\}}\mathbb{P}(B_{1} & \ge r-N_{n,k}(X_n), B_{2}\ge r-N_{n,k}(X_n), \nonumber\\ B^{\prime}_{1} & \ge r-N_{n,\ell}(X^{\prime}_n), B^{\prime}_{2}\ge r-N_{n,\ell}(X^{\prime}_n) \mid X_n,X^{\prime}_n). \end{align}
Conditionally on
 $(X_n,X^{\prime}_n)$
,
 $B_1$
,
 $B_2$
,
 $B^{\prime}_1$
, and
 $B^{\prime}_2$
are independent, with
 $B_1, B_2$
distributed as
 $\operatorname{Bin}\!(n-k,p_{X_n})$
and
 $B^{\prime}_1, B^{\prime}_2$
as
 $\operatorname{Bin}\!(n-k,p_{X^{\prime}_n})$
. Further,
 $B_1$
,
 $B_2$
,
 $B^{\prime}_1$
, and
 $B^{\prime}_2$
are independent of
 $\mathcal{F}_{n,k}, \mathcal{F}_{n,\ell}$
, conditionally on
 $(X_n,X^{\prime}_n)$
.
Observe that (52) can be rewritten as
 \begin{equation} \mathbb{E}\, \textbf{1}_{\{X_n\ne X^{\prime}_n\}}\mathbb{P}(N_{n,k}(X_n)\ge r-B_{12}, N_{n,\ell}(X^{\prime}_n)\ge r-B^{\prime}_{12}\}\mid X_n,X^{\prime}_n), \end{equation}
where
 $B_{12}=\min\{B_1,B_2\}$
and
 $B^{\prime}_{12}=\min\{B^{\prime}_1,B^{\prime}_2\}$
. Note also that, for
 $x\ne y$
,
 $N_{n,k}(x)$
and
 $N_{n,l}(y)$
are NUOD; see (15). Thus, conditioning on the values of the binomials, using the NUOD property, then integrating over the Bs and using the independence of
 $X_n$
and
 $X^{\prime}_n$
, we have the following upper bound for (53):
 $\mathbb{E}\, \textbf{1}_{\{X_n\ne X^{\prime}_n\}}\mathbb{P}(N_{n,k}(X_n)\ge r-B_{12}\mid X_n)\mathbb{P}( N_{n,\ell}(X^{\prime}_n)\ge r-B^{\prime}_{12}\}\mid X^{\prime}_n)$
, which, after ignoring the indicator and noting that the conditional probabilities (on
 $X_n$
and
 $X^{\prime}_n$
) are independent random variables, can be finally bounded by
 \begin{align} \mathbb{E}\, \mathbb{P}(N_{n,k}(X_n)\ge r-B_{12}\mid X_n)\mathbb{E}\,\mathbb{P}( N_{n,\ell}(X^{\prime}_n)\ge r-B^{\prime}_{12}\}\mid X^{\prime}_n) = \mathbb{E}\,T_{n,k}^2(X_n)\mathbb{E}\,T_{n,\ell}^2(X^{\prime}_n). \end{align}
Therefore, from (49), (50), (51), and (54), we have
 \begin{equation} \textrm{Cov}(T^2_{n,k}(X_n),T^2_{n,\ell}(X^{\prime}_n))\le cn^r\mathbb{E}\,p_{X_n}^{r+1}. \end{equation}
It remains to bound the covariances
 $\textrm{Cov}(B_{n,k}(Z_n),B_{n,\ell}(Z^{\prime}_n))$
. To that end we first consider the expected value of the product:
 \begin{align} \mathbb{E}\, B_{n,k}(Z_n)B_{n,\ell}(Z^{\prime}_n) & \le \mathbb{E}\, \textbf{1}_DT_{n,k}(X_n)T_{n,k}(Y_n)T_{n,\ell}(X^{\prime}_n)T_{n,\ell}(Y^{\prime}_n) \nonumber\\ & \quad + \mathbb{E}\, \textbf{1}_{D^c}T_{n,k}(X_n)T_{n,k}(Y_n)T_{n,\ell}(X^{\prime}_n)T_{n,\ell}(Y^{\prime}_n), \end{align}
where D is the event that
 $X_n$
,
 $Y_n$
,
 $X^{\prime}_n$
, and
 $Y^{\prime}_n$
are all distinct. Then,
 \begin{equation} \mathbb{E}\, \textbf{1}_{D^c}T_{n,k}(X_n)T_{n,k}(Y_n)T_{n,\ell}(X^{\prime}_n)T_{n,\ell}(Y^{\prime}_n) \le \left(\begin{array}{c}4\\2\end{array}\right)\mathbb{E}\, p_{X_n}T_{n,k}(X_n)\le cn^r\mathbb{E}\, p_{X_n}^{r+1}. \end{equation}
Note that, as in (52), the first term on the right-hand side of (56) can be written as
 \begin{align} \mathbb{E} \, \textbf{1}_D\mathbb{P}(B_{1} & \ge r-N_{n,k}(X_n) ,B_{2}\ge r-N_{n,k}(Y_n), \nonumber\\ B^{\prime}_{1} & \ge r-N_{n,\ell}(X^{\prime}_n), B^{\prime}_{2}\ge r-N_{n,\ell}(Y^{\prime}_n)\mid Z_n,Z^{\prime}_n). \end{align}
Conditionally on
 $(Z_n,Z^{\prime}_n)$
,
 $B_1$
,
 $B_2$
,
 $B^{\prime}_1$
, and
 $B^{\prime}_2$
are independent, where
 $B_1$
is
 $\operatorname{Bin}\!(n-k,p_{X_n})$
,
 $B_2$
is
 $\operatorname{Bin}\!(n-k,p_{Y_n})$
,
 $B^{\prime}_1$
is
 $\operatorname{Bin}\!(n-k,p_{X^{\prime}_n})$
, and
 $B^{\prime}_2$
is
 $\operatorname{Bin}\!(n-k,p_{Y^{\prime}_n})$
. Also,
 $B_1$
,
 $B_2$
,
 $B^{\prime}_1$
, and
 $B^{\prime}_2$
are independent of
 $\mathcal{F}_{n,k}, \mathcal{F}_{n,\ell}$
conditionally on
 $(Z_n, Z^{\prime}_n)$
. Now, using the NUOD property (14) and the independence of
 $X_n$
,
 $Y_n$
,
 $X^{\prime}_n$
, and
 $Y^{\prime}_n$
, the expression in (58) is bounded above by
 \begin{align} & \mathbb{E}\, \mathbb{P}(B_{1}\ge r-N_{n,k}(X_n), B_{2}\ge r-N_{n,k}(Y_n)\mid Z_n) \nonumber \\[3pt] & \quad \times \mathbb{P}(B^{\prime}_{1}\ge r-N_{n,\ell}(X^{\prime}_n), B^{\prime}_{2}\ge r-N_{n,\ell}(Y^{\prime}_n)\mid Z^{\prime}_n) \nonumber \\[3pt] & = \mathbb{E}\, \mathbb{P}(B_{1}\ge r-N_{n,k}(X_n), B_{2}\ge r-N_{n,k}(Y_n)\mid Z_n) \nonumber \\[3pt] & \quad \times \mathbb{E}\,\mathbb{P}(B^{\prime}_{1}\ge r-N_{n,\ell}(X^{\prime}_n), B^{\prime}_{2}\ge r-N_{n,\ell}(Y^{\prime}_n)\mid Z^{\prime}_n) \nonumber \\[3pt] & = \mathbb{E} \,T_{n,k}(X_n)T_{n,k}(Y_n)\mathbb{E}\, T_{n,\ell}(X^{\prime}_n)T_{n,l}(Y^{\prime}_n) \nonumber \\[3pt] & = \mathbb{E} \, B_{n,k}(Z_n)\mathbb{E}\, B_{n,\ell}(Z^{\prime}_n)+O(n^r\mathbb{E}\,p_{X_n}^{r+1}). \end{align}
Therefore, from (56), (57), and (59),
 \begin{equation} \textrm{Cov}(B_{n,k}(Z_n),B_{n,\ell}(Z^{\prime}_n))\le cn^r\mathbb{E}\, p_{X_n}^{r+1}. \end{equation}
We complete the proof of (44) by collecting the partial results above to obtain bounds for
 $W_n^\alpha$
and
 $W_n^\beta$
, using formula (46). From (47) and (48),
 $\sum_{k=1}^n\textrm{Var}\,\alpha_{n,k}\le n^{r+1}\mathbb{E}\,p_{X_n}^r$
and
 $\sum_{k=1}^n\textrm{Var}\,\beta_{n,k}\le n^{r+1}\mathbb{E}\,p_{X_n}^r$
. From (49) and (55),
 \begin{equation*} \sum_{1\le k<\ell\le n}\textrm{Cov}(\alpha_{n,k},\alpha_{n,\ell})\le c\!\left(\begin{array}{c}n\\2\end{array}\right)n^r\mathbb{E}\, p_{X_n}^{r+1}\le cnp_n^*\big(n^{r+1}\mathbb{E}\, p_{X_n}^r\big)=o((n^{r+1}\mathbb{E}\, p_{X_n}^r)^2). \end{equation*}
Finally, from (60),
 \begin{equation*} \sum_{1\le k<\ell\le n}\textrm{Cov}(\beta_{n,k},\beta_{n,\ell})\le c\!\left(\begin{array}{c}n\\2\end{array}\right)n^r\mathbb{E}\,p_{X_n}^{r+1}\le cnp_n^*\big(n^{r+1}\mathbb{E}\, p_{X_n}^r\big) =o((n^{r+1}\mathbb{E}\, p_{X_n}^r)^2). \end{equation*}
The conclusion follows from (45), (46), and the bounds for the sums of variances and covariances above.
4.2.4. The final step: the martingale CLT
Proof of Theorem
2.We establish asymptotic normality by applying the martingale central limit theorem (see, e.g., [Reference Helland8, Theorem 2.5]) to the martingale differences
 $(d_{n,k})$
. Since the
 $d_{n,k}$
are uniformly bounded, the conditional Lindeberg condition ([Reference Helland8, Condition (2.5)]) follows from the fact that the variance of the sum grows to infinity. The remaining condition to be checked, [Reference Helland8, Condition (2.7)], is
 \begin{equation*} \frac{\sum_{k=1}^n\mathbb{E} (d_{n,k}^2\mid \mathcal{F}_{n,k-1})}{\sum_{k=1}^n\mathbb{E}\, d_{n,k}^2}\stackrel{\mathbb{P}}\longrightarrow 1, \end{equation*}
or, equivalently,
 \begin{equation*} \frac{\sum_{k=1}^n(\mathbb{E} (d^2_{n,k}\mid \mathcal{F}_{n,k-1})-\mathbb{E}\, d_{n,k}^2)}{\sum_{k=1}^n\mathbb{E}\, d^2_{n,k}}\stackrel{\mathbb{P}}\longrightarrow 0. \end{equation*}
But this follows immediately from the second part of Proposition 1, Lemma 5, and Chebyshev’s inequality.
4.3. Phase transition
Proof of Proposition 2.Note that the Poissonian asymptotics at the critical capacity r follows immediately from Theorem 1.
When
 $r\ge 2$
and
 $s\in\{1,\ldots,r-1\}$
, it follows from (22) of Lemma 1 that the assumptions of Theorem 2 are satisfied and thus we have the normal asymptotics.
When
 $r\ge 1$
and
 $s\in\{r+1,r+2,\ldots\}$
, following (27), we can write, for any
 $\varepsilon>0$
,
 \begin{equation*} \mathbb{P}(V_{n,s}>\varepsilon)\le \frac{\mathbb{E}\,V_{n,s}}{\varepsilon}\le \frac{n^{s+1}\mathbb{E}\,p_{X_n}^s}{{\varepsilon}\,(s+1)!}.\end{equation*}
Thus, (21) of Lemma 1 yields
 $V_{n,s}\stackrel{\mathbb{P}}{\to} 0$
.
4.4. Asymptotics for full containers
Proof of Theorem
3.For the case
 $r>1$
, due to the representations in (10), to prove both results it suffices to show that
 $\mathbb{E}\,V_{n,s}\to 0$
for any fixed
 $s\ge r$
. Since (27) yields
 \begin{equation*} \mathbb{E}\,V_{n,s} \le \frac{n^{s+1}}{(s+1)!}\mathbb{E}\,p_{X_n}^s, \end{equation*}
the result follows from (22) of Lemma 1.
For the case
 $r=1$
, the first part follows from Theorem 1 since (11) implies
 $n-L_{n,1}=V_{n,1}$
. The second also follows from Theorem 1 since (12) gives
 $\frac12({n-K_{n,1}}) = V_{n,1}-\frac12{V_{n,2}}$
and, similarly to the case
 $r>1$
, we have
 $\mathbb{E}\,V_{n,2}\to 0$
.
Proof of Theorem 4.By the representation in (10) we can write
 \begin{equation*} \frac{\textrm{Var}\,L_{n,r}}{\textrm{Var}\,V_{n,r-1}}=1+\frac{\textrm{Var}\,V_{n,r}}{\textrm{Var}\,V_{n,r-1}}-2\frac{\textrm{Cov}(V_{n,r-1},V_{n,r})}{\textrm{Var}\,V_{n,r-1}}. \end{equation*}
Since
 $n^{r+1}\mathbb{E}\,p_{X_n}^r\le np_n^*n^r\mathbb{E}\,p_{X_n}^{r-1}$
, it follows that
 $n^r\mathbb{E}\,p_{X_n}^{r-1}\to \infty$
. Therefore, by Proposition 1, we have
 \begin{equation*} \frac{\textrm{Var}\,V_{n,r}}{\textrm{Var}\,V_{n,r-1}}\le c \frac{n^{r+1}\mathbb{E}\,p_{X_n}^r}{n^r\mathbb{E}\,p_{X_n}^{r-1}}\le c np_n^*\to 0. \end{equation*}
Thus,
 \begin{equation*} \left|\frac{\textrm{Cov}(V_{n,r-1},V_{n,r})}{\textrm{Var}\,V_{n,r-1}}\right|\le\sqrt{\frac{\textrm{Var}\,V_{n,r}}{\textrm{Var}\,V_{n,r-1}}}\to 0, \end{equation*}
and so
 \begin{equation*}\frac{V_{n,r}-\mathbb{E}\,V_{n,r}}{\sqrt{\textrm{Var}\,L_{n,r}}}\stackrel{L^2}{\longrightarrow}0.\end{equation*}
Hence, the first result is a consequence of Theorem 2 since, in view of the representation in (10),
 \begin{equation*} \frac{L_{n,r}-\mathbb{E}\,L_{n,r}}{\sqrt{\textrm{Var}\,L_{n,r}}}=\frac{V_{n,r-1}-\mathbb{E}\,V_{n,r-1}}{\sqrt{\textrm{Var}\,V_{n,r-1}}}\,\sqrt{\frac{\textrm{Var}\,V_{n,r-1}}{\textrm{Var}\,L_{n,r}}}-\frac{V_{n,r}-\mathbb{E}\,V_{n,r}}{\sqrt{\textrm{Var}\,L_{n,r}}}. \end{equation*}
For the second case, by the representation in (10) we can write
 \begin{equation*} \begin{split} \frac{\textrm{Var}\,K_{n,r}}{\textrm{Var}\,V_{n,r-1}}&=1+4\frac{\textrm{Var}\,V_{n,r}}{\textrm{Var}\,V_{n,r-1}}+\frac{\textrm{Var}\,V_{n,r+1}}{\textrm{Var}\,V_{n,r-1}} \\ &\quad-4\frac{\textrm{Cov}(V_{n,r-1},V_{n,r})}{\textrm{Var}\,V_{n,r-1}} -4\frac{\textrm{Cov}(V_{n,r},V_{n,r+1})}{\textrm{Var}\,V_{n,r-1}}+2\frac{\textrm{Cov}(V_{n,r-1},V_{n,r+1})}{\textrm{Var}\,V_{n,r-1}}. \end{split} \end{equation*}
Similarly to the previous case, we conclude that
 $n^s\mathbb{E}\,p_{X_n}^{s-1}\to \infty$
for
 $s=r,r+1$
. Therefore, by the same argument as above, it follows that each of the summands on the right-hand side of the expression above, excluding the first one, converges to 0. Consequently, for
 $s=r,r+1$
,
 \begin{equation*}\frac{V_{n,s}-\mathbb{E}\,V_{n,s}}{\sqrt{\textrm{Var}\,K_{n,r}}}\stackrel{L^2}{\longrightarrow}0.\end{equation*}
Thus, the second result is a consequence of Theorem 2 since, in view of (10),
 \begin{align*} \frac{K_{n,r}-\mathbb{E}\,K_{n,r}}{\sqrt{\textrm{Var}\,K_{n,r}}} & = \frac{V_{n,r-1}-\mathbb{E}\,V_{n,r-1}}{\sqrt{\textrm{Var}\,V_{n,r-1}}}\sqrt{\frac{\textrm{Var}\,V_{n,r-1}}{\textrm{Var}\,K_{n,r}}} \nonumber\\[3pt] & \quad - 2\frac{V_{n,r}-\mathbb{E}\,V_{n,r}}{\sqrt{\textrm{Var}\,K_{n,r}}}+\frac{V_{n,r+1}-\mathbb{E}\,V_{n,r+1}}{\sqrt{\textrm{Var}\,K_{n,r}}}. \end{align*}
5. More on the asymptotics of the mean
As mentioned in Remark 1, when
 $\lambda=\limsup np_n^*=0$
the limit of
 ${\mathbb{E}\, V_{n,r}}/{n^{r+1}\mathbb{E}\, p_{X_n}^r}$
exists, but when
 $\lambda>0$
we were only able to obtain lower and upper bounds for that ratio. Here, under additional assumptions, we consider the existence of the limit when
 $\lambda>0$
. We begin by re-writing an expression for
 $\mathbb{E}\,V_{n,r}$
in a more convenient form.
Lemma 6.
 \begin{equation} \mathbb{E}\,V_{n,r}=\sum_{s=r}^{n-1}\binom{n}{s+1}\binom{s-1}{s-r}({-}1)^{s-r}\mathbb{E}\,p_{X_n}^s. \end{equation}
Proof. Recall, for example from (18), that
 \begin{equation*} \mathbb{E}\,V_{n,r} = \sum_{k=r+1}^n\mathbb{E}\,Y_{n,k} = \mathbb{E}\sum_{k=r+1}^n\sum_{i=r}^{k-1}\binom{k-1}{i}p_{X_n}^i(1-p_{X_n})^{k-1-i}.\end{equation*}
Expanding
 $(1-p_{X_n})^{k-1-i}$
by the binomial formula, we see that the double sum on the right-hand side is
 \begin{align*} \sum_{k=r+1}^n\sum_{i=r}^{k-1}\binom{k-1}{i}\sum_{j=0}^{k-1-i}\binom{k-1-i}{j}({-}1)^{\,j}p_{X_n}^{i+j} \cr& \!\!\!\!\!\!\!\!\!\!\!\!\!\!\!\!\!\!\!\!\!\!\!\!=\sum_{i=r}^{n-1}\sum_{j=0}^{n-1-i}\binom{i+j}{i}({-}1)^{\,j}p_{X_n}^{i+j}\sum_{k=i+j+1}^n\binom{k-1}{i+j}.\end{align*}
Since
 $\sum_{k=i+j+1}^n\tbinom{k-1}{i+j}=\tbinom{n}{i+j+1}$
, we get
 \begin{align*} \sum_{k=r+1}^n\sum_{i=r}^{k-1}\binom{k-1}{i}p_{X_n}^i(1-p_{X_n})^{k-1-i} & = \sum_{i=r}^{n-1}\sum_{j=0}^{n-1-i}\binom{i+j}{i}\binom{n}{i+j+1}({-}1)^{\,j}p_{X_n}^{i+j} \\ & = \sum_{i=r}^{n-1}\sum_{s=i}^{n-1}\binom{s}{i}\binom{n}{s+1}({-}1)^{s-i}p_{X_n}^s \\ & = \sum_{s=r}^{n-1}\binom{n}{s+1}p_{X_n}^s\sum_{i=r}^{s}\binom{s}{i}({-}1)^{s-i}. \end{align*}
The final result follows from the identity
 $\sum_{i=r}^{s}\tbinom{s}{i}({-}1)^{s-i} =\tbinom{s-1}{s-r}({-}1)^{s-r}$
.
To state our condition we need to introduce one more definition. Let
 $\mathcal X_n$
denote the set of distinct values among
 ${p_{n,k}}/{p_n^*}$
,
 $k\in M_n$
. For
 $x\in \mathcal X_n$
, denote
 $K(x)=\{k\in M_n \,:\, x = {p_{n,k}}/{p_n^*}\}$
. Define random variables
 $P_n$
,
 $n\ge 1$
, as follows:
 \begin{equation*}\mathbb{P}\!\left(P_n=x\right)=\frac{1}{\mathbb{E}\,p_{X_n}^r}\sum_{k\in K(x)}p^{r+1}_{n,k},\qquad x\in \mathcal X_n.\end{equation*}
Definition 1. We say that the sequence
 $(X_n)_{n\ge 1}$
is in the class
 $\mathcal{T}(r)$
if the sequence
 $(P_n)_{n\ge 1}$
converges in distribution.
Denote by U the limit of
 $(P_n)_{n\ge 1}$
when it exists, and let
 $\nu_r$
denote the distribution of U. Note that since U is a [0, 1]-valued random variable,
 $(X_n)_{n\ge 1}\in \mathcal{T}(r)$
if and only if
 $\mathbb{E}\,P_n^j\to \mathbb{E}\,U^j$
,
 $j\ge 1$
.
We will show that, for
 $(X_n)_{n\ge 1}\in \mathcal{T}(r)$
, if
 $\lim_{n\to\infty} np_n^*$
exists and is positive then
 \begin{equation*}H(r,\lambda)\,:\!=\,\lim_{n\to\infty}\frac{\mathbb{E}\,V_{n,r}}{n^{r+1}\mathbb{E}\,p_{X_n}^r}\end{equation*}
also exists.
Recall that the generalized hypergeometric function
 $_pF_q$
is defined by
 \begin{equation} _pF_q(a_1,\dots,a_p;\,b_1,\dots,b_q;\,z)=\sum_{k=0}^\infty\frac{(a_1)_k\cdots(a_p)_k}{(b_1)_k\cdots(b_q)_k}\tfrac{z^k}{k!},\end{equation}
where
 $(a)_0=1$
and
 $(a)_k= a(a+1)\cdots(a+k-1)$
for
 $k\ge 1$
. We derive the following representation for
 $H(r,\lambda)$
.
Proposition 3. Let
 $(X_n)_{n\ge 1}$
be in
 $\mathcal{T}(r)$
and
 $np_n^*\to \lambda>0$
. Then
 \begin{equation} H(r,\lambda)=\frac{\mathbb{E}\,\textrm{e}^{-\lambda BU}}{(r+1)!}=\frac{1}{(r+1)!}\int {}_1F_1(r;\,r+2;\,-\lambda u)\;\nu_r(\textrm{d} u), \end{equation}
where B is a beta
 $\textrm B_I(r,2)$
random variable with density
 $f(b)=r(r+1)b^{r-1}(1-b)\textbf{1}_{(0,1)}(b)$
.
Proof. Using (61) we get
 \begin{align*} \frac{\mathbb{E}\,V_{n,r}}{n^{r+1}\mathbb{E}\,p_{X_n}^r} & = \frac{1}{n^{r+1}}\sum_{s=r}^{n-1}\frac{n(n-1)\ldots(n-s)}{s(s+1)}\frac{({-}1)^{s-r}}{(s-r)!(r-1)!}\frac{\mathbb{E}\,p_{X_n}^s}{\mathbb{E}\,p_{X_n}^r} \\ & = \frac{1}{(r-1)!}\sum_{s=r}^{n-1}\frac{n(n-1)\ldots (n-s)}{n^{s+1}s(s+1)}\frac{({-}1)^{s-r}}{(s-r)!}(np_n^*)^{s-r}\mathbb{E}\,P_n^{s-r} \\ & \to \frac{1}{(r-1)!}\sum_{\ell\ge 0}\frac{({-}\lambda)^{\ell}}{\ell!}\frac{\mathbb{E}\,U^{\ell}}{(r+\ell)(r+1+\ell)}=H(r,\lambda), \end{align*}
where the last line holds by the Lebesgue dominated convergence theorem.
Since
 \begin{equation*}\frac{1}{(r+j+1)(r+j)}=\frac{1}{r+j}-\frac{1}{r+j+1}=\int_0^1\big(x^{r+j-1}-x^{r+j}\big)\textrm{d} x,\end{equation*}
we get
 \begin{align*} H(r,\lambda) & = \frac{1}{(r-1)!}\sum_{\ell\ge 0}\frac{({-}\lambda)^{\ell}}{\ell!}\int_{[0,1]}u^\ell\nu_r(\textrm{d} u)\int_0^1x^{r+\ell-1}(1-x)\textrm{d} x \\ & = \frac{1}{(r-1)!}\int_{[0,1]}\int_0^1x^{r-1}(1-x)\sum_{\ell\ge 0}\frac{({-}\lambda x u)^{\ell}}{\ell!}\,\textrm{d} x\,\nu_r(\textrm{d} u) \\ & = \frac{1}{(r+1)!}\int_0^1\int_{[0,1]}\textrm{e}^{-\lambda x u}r(r+1)x^{r-1}(1-x)\nu_r(\textrm{d} u)\textrm{d} x = \frac{\mathbb{E}\,\textrm{e}^{-\lambda BU}}{(r+1)!}, \end{align*}
where B is as specified earlier. This proves the first equality in (63). The second follows by recalling that the Laplace transform of the beta
 $\textrm B_I(\alpha,\beta)$
random variable B is
 $\mathbb{E}\,\textrm{e}^{sB}={}_1F_1(\alpha;\,\alpha+\beta;\,s)$
. Applying this formula conditionally on U in
 $\mathbb{E}\,\textrm{e}^{-\lambda BU}$
and then integrating with respect to U yields the second equality in (63).
The above representation allows us to give a short proof of the bounds (8) in Proposition 1 for the limit
 $H(r,\lambda)$
in
 $\mathcal T(r)$
models. While the upper bound remains the same, the lower is tighter and, as we will see in Example 5, is exact.
Proposition 4. Let
 $(X_n)_{n\ge 1}$
belong to the class
 $\mathcal T(r)$
and
 $np_n^*\to \lambda>0$
. Then
 \begin{equation} \frac{\Gamma_\lambda(r+1)}{r!}<\frac{_1F_1(r;\,r+2;\,-\lambda)}{(r+1)!}\le H(r,\lambda)<\frac{1}{(r+1)!}. \end{equation}
Proof. The upper bound is clear since
 $\mathbb{E}\,\textrm{e}^{-\lambda BU}< 1$
. The inequality is strict since
 $\mathbb{P}(U>0)>0$
.
On the other hand,
 $\mathbb{P}(B\le 1)=1$
. Thus, by the first part of (63), we get
 \begin{equation*} H(r,\lambda)\ge\frac{1}{(r+1)!}\mathbb{E}\,\textrm{e}^{-\lambda U}=\frac{_1F_1(r;\,r+2;\,-\lambda)}{(r+1)!} ,\end{equation*}
which proves the second inequality in (64). Finally, to prove the first one, note that
 \begin{equation*} \frac{_1F_1(r;\,r+2;\,-\lambda)}{(r+1)!}=\frac{\int_0^1\textrm{e}^{-\lambda x}x^{r-1}(1-x)\textrm{d} x}{(r-1)!}.\end{equation*}
Integrating the numerator by parts yields
 \begin{align*} \frac1r\int_0^1 (1-x)\textrm{e}^{-\lambda x}\, \textrm{d} x^r & = \frac1r\int_0^1 x^{r}(\textrm{e}^{-\lambda x}+\lambda(1-x)\textrm{e}^{-\lambda x})\, \textrm{d} x \\ & > \frac1r\int_0^1 x^{r}\textrm{e}^{-\lambda x}\, \textrm{d} x = \frac{\Gamma_\lambda(r+1)}r. \end{align*}
We close by considering several special cases, the first of which shows that the middle inequality in (64) is sharp.
Example 5. (Uniform distribution.) Let
 $p_{n,j}={1}/{m_n}$
,
 $j\in M_n=\{1,\ldots,m_n\}$
,
 $n\ge 1$
. Assume that
 ${n}/{m_n}\to\lambda>0$
. Note that in this case
 $P_n=1$
 $\mathbb{P}$
-a.s.,
 $n\ge 1$
, and thus
 $\nu_r=\delta_1$
. Hence, by (63),
 \begin{equation*}H(r,\lambda)=\frac{{}_1F_1(r;\,r+2;\,-\lambda)}{(r+1)!}.\end{equation*}
Example 6. (Geometric distribution.) Let
 $p_{n,j}=p_n(1-p_n)^{\,j}$
,
 $j\in M_n=\{0,1,\ldots\}$
,
 $n\ge 1$
. Assume that
 $np_n\to\lambda>0$
(note that in this case
 $p_n^*=p_n$
). Then,
 $\nu_r(\textrm{d} u) = (r+1)u^r\textbf{1}_{[0,1]}(u)\textrm{d} u$
and
 \begin{equation} H(r,\lambda)=\frac{{}_2F_2(r,r+1;\,r+2,r+2;\,-\lambda)}{(r+1)!}. \end{equation}
Indeed, with
 $q_n\,:\!=\,1-p_n$
we have
 $\mathbb{P}(P_n=q_n^k)=q_n^{(r+1)k}(1-q_n^{r+1})$
,
 $k=0,1,\ldots$
Therefore, for any
 $\ell=1,2,\ldots$
,
 \begin{equation*} \mathbb{E}\,P_n^{\ell}=\sum_{k\ge 0}q_n^{(\ell+ r+1)k}(1-q_n^{r+1})=\frac{1-q_n^{r+1}}{1-q_n^{\ell+r+1}}\to\frac{r+1}{\ell+r+1}=(r+1)\int_0^1x^{\ell+r}\,\textrm{d} x,\end{equation*}
which implies the assertion on the form of
 $\nu_r$
.
Thus, (63) yields
 \begin{equation*} H(r,\lambda)=\frac{1}{r!}\int^1_0{}_1F_1(r,r+2;\,{-}\lambda u)u^r\,\textrm{d} u.\end{equation*}
Using the Euler integral identity (see, e.g., [22, Eq. 16.5.2]),
 \begin{align*}_{p+1}F_{q+1}(a_1,\ldots,a_p,c;\,b_1,\ldots,b_q,c+d;\,z) \cr&\!\!\!\!\!\!\!\!\!\!\!\!\!\!\!\!\!\!\!\!\!\!\!\!!\!\!\!\!\!\!\!\!\!\! =\frac{\Gamma(c+d)}{\Gamma(c)\Gamma(d)}\int_0^1t^{c-1}(1-t)^{d-1}{}_pF_q(a_1,\ldots,a_p;\,b_1,\ldots,b_q;\,zt)\textrm{d} t , \end{align*}
with
 $p=q=1$
,
 $c=r+1$
, and
 $d=1$
yields (65).
Example 7. (Riemann
 $\zeta$
distribution.) Let
 $p_{n,j}={j^{-\alpha_n}}/{\zeta(\alpha_n)}$
,
 $j\in M_n=\{1,2,\ldots\}$
, and
 $\alpha_n>1$
,
 $n\ge 1$
. Assume that
 $n(\alpha_n-1)\to\lambda$
. Then
 \begin{equation} \nu_r=\sum_{k\ge 1}\frac{k^{-(r+1)}}{\zeta(r+1)}\delta_{1/k}. \end{equation}
and
 \begin{equation} H(r,\lambda)=\frac{1}{(r+1)!}\int_{\mathbb R}{}_1F_2(r;\,r+1,r+2;\,-\lambda x)\,\mu_r(\textrm{d} x), \end{equation}
where
 $\mu_r$
is the probability measure defined on
 $(0,\infty)$
by
 \begin{equation} \mu_r(\textrm{d} x) = \frac{1}{r!\zeta(r+1)}\frac{x^r}{\textrm{e}^x-1}\,\textrm{d} x. \end{equation}
We first justify (66). Since
 $p_n^*=1/\zeta(\alpha_n)$
we have
 \begin{equation*} \mathbb{P}(P_n=k^{-\alpha_n})=\frac{k^{-\alpha_n(r+1)}}{\zeta(\alpha_n(r+1))}.\end{equation*}
We have
 $\alpha_n\to 1$
and thus, by Lebesgue dominated convergence,
 \begin{equation*} \mathbb{E}\,P_n^{\ell}=\sum_{k\ge 1}k^{-\alpha_n \ell}\frac{k^{-\alpha_n(r+1)}}{\zeta(\alpha_n(r+1))}\to\sum_{k\ge 1}k^{-\ell}\frac{k^{-(r+1)}}{\zeta(r+1)}, \qquad \ell=1,2,\ldots,\end{equation*}
which proves the assertion on
 $\nu_r$
.
By (63) we have
 \begin{equation*} H(r,\lambda)=\frac{1}{(r+1)!\zeta(r+1)}\sum_{k\ge 1}{}_1F_1\bigg(r;\,r+2;\,-\frac{\lambda}{k}\bigg)\frac{1}{k^{r+1}}.\end{equation*}
Expanding
 ${}_1F_1$
according to (62) and changing the order of the sums, we get
 \begin{equation} H(r,\lambda) = \frac{1}{(r+1)!\zeta(r+1)}\sum_{j\ge 0}\frac{(r)_j}{(r+2)_j}\frac{({-}\lambda)^{\,j}}{j!}\zeta(j+r+1). \end{equation}
Let us recall an integral identity for product of
 $\zeta$
and
 $\Gamma$
functions (see, e.g., [22, Eq. 25.5.1]):
 \begin{equation} \zeta(s)\Gamma(s)=\int_0^{\infty}\frac{x^{s-1}}{\textrm{e}^x-1}\,\textrm{d} x, \qquad \textrm{Re}(s)>1. \end{equation}
Inserting (70) into the right-hand side of (69) we get
 \begin{align*} H(r,\lambda) & = \frac{1}{(r+1)!\zeta(r+1)}\sum_{j\ge 0}\frac{(r)_j}{(r+2)_j}\frac{1}{\Gamma(r+j+1)}\int_0^{\infty}\frac{x^{r+j}}{\textrm{e}^x- 1}\,\textrm{d} x\,\frac{({-}\lambda)^{\,j}}{j!} \\ & = \frac{1}{r!(r+1)!\zeta(r+1)}\int_0^{\infty}\Bigg(\!\sum_{j\ge 0}\frac{(r)_j}{(r+1)_j(r+2)_j}\frac{({-}\lambda x)^{\,j}}{j!}\Bigg)\frac{x^r}{\textrm{e}^x-1}\,\textrm{d} x , \end{align*}
Remark 2. Central limit theorems for various parameters (including the number of occupied urns) for infinite urn models with assumptions on the probabilities
 $(p_j)$
,
 $j\ge1$
, similar to those on
 $(p_{n,j})_{j\ge 1}$
,
 $n\ge 1$
, in Example 7 have been investigated in, e.g., [Reference Karlin13].
Acknowledgements
We wish to thank the Editor for his consideration and careful handling of the manuscript.
Funding information
The first author acknowledges financial support from grants PIA AFB-170001 and Fondecyt 1161319. The second author wishes to state that this material is based upon work supported by and while serving at the National Science Foundation. Any opinion, findings, and conclusions or recommendations expressed in this material are those of the authors and do not necessarily reflect the views of the National Science Foundation. The third author acknowledges partial support through project 2016/21/B/ST1/00005 of the National Science Center (NCN), Poland.
Competing interests
There were no competing interests to declare which arose during the preparation or publication process of this article.