I. INTRODUCTION
The greenhouse effect is the most serious environmental problem that people have encountered in recent times, and is expected to lead to climate change, including global warming, sea level rise, and El Nino phenomenon. CO2 derived from the burning of fossil fuels is the main reason for this, meaning that in addition to finding alternative renewable sources of energy, capture of CO2 is needed. The most widely used CO2 capture method is neutralization with strong alkali Reference Rao and Rubin1 ; however, the high cost, nonrenewable, and toxic nature of the chemicals involved have limited the practical use of this approach. Porous solid adsorbents are an effective way to mitigate CO2 emissions; the strongly enhanced interaction energy between CO2 molecules and the adsorbents in the developed pores can enhance the filling of gas molecules, Reference Zhuang, Chen, Lin and Xu2,Reference Sevilla, Valle-Vigon and Fuertes3 and allow high-performance adsorbents to exhibit high adsorption capacity and selectivity toward CO2.
Zeolites have open crystal lattices containing pores with molecular dimensions, into which molecules can penetrate. The nature of the adsorption can depend on the geometry of the site, physisorption of CO2 occurs with CO2 in a linear orientation by an ion–dipole interaction, and chemisorption occurs when sites are bent to allow coordination. Reference Jacobs, Van Cauwelaert, Vansant and Uytterhoeven4,Reference Montanari and Busca5 However, the adsorption capacities of zeolites are highly sensitive to temperature and their selectivity to CO2 is still low. Metal organic frameworks (MOFs) are a new family of porous materials; the CO2 adsorption and desorption in MOFs are ascribed to changes in the framework structures. Although MOFs show high capacities at high pressure, their interactions with adsorbed CO2 and adsorbents are usually weak, and desorption can commence at temperatures above 30 °C. Reference Bae, Mulfort, Frost, Ryan, Punnathanam, Broadbelt, Hupp and Snurr6,Reference Zhao, Li and Lin7 Thermodynamic analysis of dry and re-generable adsorbents has shown that alkali metal carbonate-based adsorbents are potentially applicable to the capture of CO2 from existing fossil-fuel fired power plants; use of these adsorbents involves reactions that are reversible and highly exothermic; the durability, carbonation reaction rate, and energy management are other factors which need to be considered prior to widespread application. Reference Zhao, Chen, Zhao and Liu8,Reference Yi, Jo, Seo, Lee and Ryu9
Carbon nanotubes and nanofibers were first found to have sustainable capacity to store hydrogen and energy. Reference Ansón, Callejas, Benito, Maser, Izquierdo and Rubio10,Reference Yang, Du, Guo, Yu, Chen, Zhang, Chen and Liu11 Since then, because of their low cost and relative ease of generation, porous carbon materials with high specific surface areas have been prepared through different methods and evaluated for CO2 capture. Reference Sevilla and Fuertes12–Reference Wang, Li and Liu15 In contrast to traditional solid carbons such as graphite, carbon black, and charcoal, adsorbents prepared by hydrothermal carbonization of biomass have the advantages of being environmentally friendly, readily available, and abundant. The products always have many oxygen-containing groups such as hydroxyls, carboxyls, and carbonyls on their surfaces. Reference Xiao, Shi, Xu and Sun16,Reference Li, Li and Liu17 The chemical properties of the adsorbents such as surface areas and pore structures (which are the main factors affecting the adsorption capacity) can be tailored by changing preparation conditions. Reference Lv, Zhang, Dou, Zhai, Wang and Liu18–Reference Wang, Guo, Zou and Wang20 Sevilla and Fuertes prepared high CO2 capture capacity adsorbents with developed microporous structure from sawdust, and found that the amount of microporosity (pore size below 1 nm) was the dominant factor which affected the capacity. Reference Sevilla and Fuertes12 Song prepared N-containing samples from polar anthers, and found that their CO2 adsorption capacity was highly dependent on adsorption conditions. At a higher pressure of 5 bar, adsorption capacity mainly depended upon specific surface area and pore volume, while at 0.1 bar, the N content was the governing factor. Reference Song, Shen, Wang and Fan21
In this present contribution, adsorbents with high CO2 capture capacity were prepared using carboxymethylcellulose (CMC) as the raw material and citric acid as the catalyst via hydrothermal carbonization followed by KOH activation to induce porous structure. The influences of specific surface area, pore volume, and pore structure on the CO2 adsorption capacity were investigated in detail.
II. EXPERIMENTAL
A. Hydrothermal carbonization of CMC for CSc
In a typical experiment, 1 g of CMC and 1 g of citric acid were dissolved in 40 mL distilled water and ultrasonically agitated for 15 min. The solution was placed in a stainless-steel autoclave (55 mL volume). The autoclave was placed in a furnace at 190, 210, or 230 °C for 10 h after which it was allowed to cool down to room temperature. The black solid product was collected by filtration and washed with distilled water followed by pure ethanol until the solution ran clear. Finally, the products were placed under vacuum at 80 °C overnight and labeled as CSc-190, CSc, and CSc-230, respectively.
B. KOH activation for porous carbon
Mixtures were prepared from KOH and CSc in a ratio of either 2:1 or 4:1, and then placed in an alumina combustion boat in a calcination furnace. The products were heated up to 600, 700, or 800 °C at a rate of 5 °C/min and held for 1 h. When the furnace cooled down to room temperature, the activation products were washed with deionized water until neutral.
The products after activation are referred to as CSc-n-T, where n denotes the ratio of KOH and carbon, and T denotes the activation temperature.
C. Characterization
The morphologies and sizes of the products were observed using environmental scanning electron microscopy (SEM; Quanta 200, FEI, Hillsboro, OR). Transmission electron microscopy (TEM) images were obtained on a JEOL 2011 (FEI, Holland) operated at 200 kV. The FTIR spectra were recorded on a Fourier transform infrared (FTIR) instrument (Perkin Elmer TV 1900, Waltham, MA) in the range of 400–4000 cm−1 with a resolution of 4 cm−1. Characterization of porous carbons was carried out by nitrogen adsorption–desorption isotherms measured at 77 K using an ASAP 2020 instrument (Micromeritics, GA). Prior to gas adsorption measurements, the carbon was degassed at 200 °C under vacuum for 4 h. The BET surface area was calculated from N2 adsorption isotherms by using the Brunauer–Emmett–Teller (BET) equation. The pore size distribution (PSD) was obtained by the nonlocal density function theory (NLDFT) method by assuming a slit pore model. The micropore surface area and total micropore volume of the narrow micropores were determined by applying the Dubinin–Radushkevich (D–R) equation to the CO2 adsorption isotherm at 0 °C. The total pore volumes were estimated at a relative pressure of 0.995.
D. CO2 adsorption measurements
Volumetric CO2 sorption studies were performed at 298 K, 1 bar using the ASAP 2020. Before measurements, the samples were degassed at 90 °C for 1 h, and heated to 200 °C for 4 h.
III. RESULTS AND DISCUSSION
A. SEM analysis
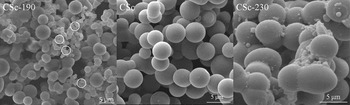
The results show that at low temperatures (<190 °C), no black solid products were obtained. SEM images of CSc samples prepared at various temperatures are presented in Fig. 1. CSc particles with a wide diameter range of 100–2000 nm were formed at 190 °C. This sample consisted of regular spheres, typically with diameters of a few hundred nanometers, along with some irregular smaller spheres with diameters of dozens of nanometers, indicating incomplete reaction at this temperature. The data in Fig. 1 reveal that increasing the preparation temperature increased the diameter of the smaller spheres and narrowed the size distribution; the samples prepared at 210 °C were uniform and well-dispersed with a narrower diameter distribution of 1–3 µm. As temperature increased to 230 °C, diameter distribution increased to 2–5 µm with rougher surfaces and severe agglomeration and adhesion occurred, indicating that this preparation temperature was too high.
SEM images of CSc-190, CSc, and CSc-230.

B. FTIR analysis
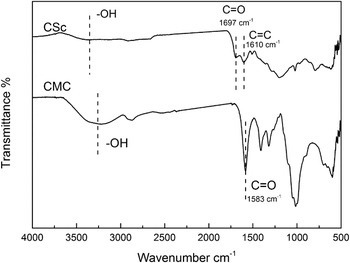
FTIR analysis (Fig. 2) revealed the functional groups on the surfaces of CSc and CMC raw materials. For CSc, the band observed at 3400 cm−1 was assigned to O–H stretching vibration, that at 1000–1460 cm−1 to the C–O (hydroxyl, ester, and ether) stretching vibration, those at 1640 and 875–750 cm−1 to the stretching vibration of C=C and the out-of-plane bending vibration of aromatic C–H, respectively, and the adsorption band at 1697 cm−1 to carboxylate groups. These results indicate that carbon materials were obtained with aromatic structure, and with a high concentration of oxygen-containing functional groups (hydroxyl, esters, ether, carbonyl, and carboxylic groups) on their surfaces. Thus, the chemical properties, such as porous structure, surface area, and surface chemistry, can be easily tailored. The shift from 1583 cm−1 (CMC) to 1697 cm−1 (CSc) for the bands corresponding to the C=O stretching vibrations is consistent with the formation of an aromatic ring conjugated system with carboxylate structures, and is further evidence for generation of aromatic structure during hydrothermal carbonization.
FTIR spectra of CSc and CMC.

C. Morphology of prepared adsorbents
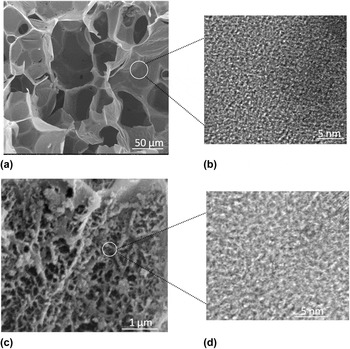
Figure 3 shows SEM images of CSc-2-700 and CSc-4-700. The activation process disrupts the spheres completely; this is presumably because of the melting of the carbon precursor and formation of liquid-phase intermediate during activation. Reference Sevilla, Falco, Titirici and Fuertes22,Reference Falco, Sieben, Brun, Sevilla, van der Mauelen, Morallon, Cazorla-Amoros and Titirici23 When the activation ratio of KOH and precursor is changed, the macroscopic morphology also clearly changes. When activation is performed under milder conditions [CSc-2, see Fig. 3(a)], the carbon foam structure is honeycomb-like with many obvious pores within the ligament and hole walls; there are many disordered micro- and mesopores, as shown in the corresponding TEM images. When the activation ratio reached 4:1, the adsorbents show undefined structures with large channels and also abundant disordered porous structure. These results show that the activation conditions can influence the morphology and structure of the final adsorbents. According to previous reports on KOH activation mechanism, Reference Alcaniz-Monge and Illan-Gomez24,Reference Raymundo-pinero, Azais, Cacciaguerra, Cazorla-Amoros, Linares-Solano and Beguin25 it can conclude that KOH can transform to K2CO3 and K2O during the activation process, which then can continue to react with carbon to generate K, structure of carbon materials were etched and carbon escape in the form of CO. When the activation ratio is lower (2:1), the erosion was mild and leaving honeycomb-like macroscopic morphology, increasing the ratio making serious erosion with undefined structures carbon.
SEM and corresponding TEM images of (a and b) CSc-2-700 and (c and d) CSc-4-700.

D. Porous structure analysis of adsorbents
1. Effect of activation temperature
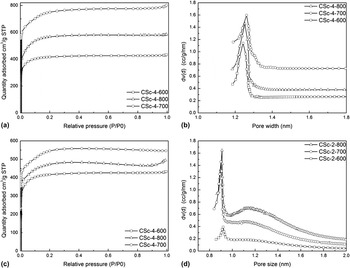
Nitrogen adsorption–desorption isotherms of CSc-4 samples activated at different temperatures are presented in Fig. 4(a), and the textural characteristics are summarized in Table I. All the isotherms show typical type-I adsorption curves, with a gradual increase at relative pressures of P/P 0 < 0.01, indicating that all samples are microporous. Reference de Souza, Wickramaratne, Ello, Costa, da Costa and Jaroniec26 The CSc-4 adsorbents exhibit high specific surface areas (1750–2334 m2/g) with high pore volumes of around 1 cm3/g.
N2 adsorption isotherms and micropore size distributions of (a and b) CSc-4-700 and (c and d) CSc-2-700 samples.

Textural characteristics of different adsorbents.

a Evaluated by the t-plot method.
b Total pore volume at P/P 0 ≈ 0.99.
c Pore volume of narrow micropores (0.4–0.9 nm) obtained from the CO2 adsorption data at 0 °C.
d Average pore width of narrow micropores (0.4–0.9 nm) obtained from the CO2 adsorption data at 0 °C.
The porous structure is made up of both micro- and mesopores, as summarized in Table I. CSc-4-600 and CSc-4-700 contain mainly micropores (63 and 56% of the total surface areas, respectively). There are also mesopores present, particularly in CSc-4-800 which had a micropore content of only 36%. This shows that the high temperature created mesopores, owing to the etching of the hydrothermal carbonized CMC by KOH; it has reported that Gibbs free energy (ΔG) of the reaction between KOH and carbon was negative at about 570 °C, indicating higher temperature can benefit for the KOH activation for more development of pores, Reference Lozano-Castello, Calo, Cazorla-Amoros and Linares-Solano27 increasing activation temperature increased the etching degree, and the more severe etching caused more micropores to collapse and form larger pores. This is consistent with the shift in the center of the micropore size distribution from 1.24 to 1.26 nm as the temperature increased from 600 to 800 °C. This process also caused an increase in the pore volume from 0.90 to 1.22 cm3/g and then a decrease to 1.12 cm3/g as the temperature increased further. For CSc-2, which contains less KOH and is therefore etched to a lesser extent, CSc-2-700 shows the most developed microporous structure, with specific surface area of 1705 m2/g and pore volume of 0.84 cm3/g.
2. Effect of activation ratio
Comparing CSc-4 with CSc-2 in Table I shows that the activation ratio also significantly influences the porous structure of the adsorbents. Although all the adsorbents show type-I adsorption isotherms, the center of the micropore distribution increased from 0.9 to 1.2 nm and this distribution also broadened with higher activation ratio. However, for CSc-2 at higher temperatures, a second broad peak in the distribution centered around 1.2 nm appears; this is similar to the peak in the distribution of CSc-4. A higher ratio can also give rise to adsorbents with higher specific surface area, and greater total pore volume and micropore volume. CSc-2-700 had a specific surface area, total pore volume, and micropore volume of 1705 m2/g, 0.84, and 0.61 cm3/g. As the activation ratio increased to 4, these figures reached 2334 m2/g, 1.12, and 0.71 cm3/g, respectively; this can be attributed to the formation of mesopores. Ding et al. Reference Ding, Zou, Liu, Li, Wang, Su, Guo and Wang28 confirmed that such activation can be a competitive process involving physical pyrolysis and chemical etching, when the ratio is high, and KOH is sufficient, they can inhibit surface physical pyrolysis, excessive KOH went into interior surface of carbon, promoting chemical etching, more mesopores can be created. As a result, though CSc-2-700 showed lower specific surface area, micropores had developed, and 81% of the total surface area was found within the micropores.
CO2 adsorption was used to assess the pore volume and the PSD of the narrow microporosity region (<1 nm across), because N2 adsorption is not as effective in probing this pore range. The median pore width ranges from 0.67 to 0.74 nm, although CSc-4 show much higher V t and V mi than CSc-2, the V 0 calculated by CO2 adsorption showed that CSc-2 exhibit a higher volume of narrower pores (ultramicropores, sizes 0.4–0.9 nm), confirming that the activation ratio of 2:1 tended to generate smaller pores.
In conclusion, the structure of the adsorbents, in particular the specific surface area and pore structure, can be tailored by controlling the activation mass ratio and temperature.
E. CO2 adsorption properties of adsorbents
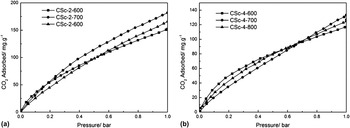
Figure 5 shows the CO2 adsorption isotherms on different adsorbents at 25 °C and 1 bar. Both CSc-4 and CSc-2 have quite substantial CO2 capture capacities, and the trends are similar, indicating that the nature and pore structure of these materials are analogous. Table II summarizes the CO2 capture capacities of the different adsorbents. The samples with the same activation ratio show CO2 capture capacities that depend strongly on the surface area and the pore volume. As the surface areas of CSc-4 increased from 1750 to 2334 m2/g, the CO2 capture capacity ranged from 120 to 132 mg/g. Of the CSc-4 samples, CSc-4-700 showed the highest capacity of 132 mg/g, with total volume of 1.22 m3/g; this is consistent with the nitrogen adsorption results discussed above. The capture capacities of CSc-2 samples also show similar trends.
CO2 adsorption isotherms of (a) CSc-4 and (b) CSc-2 at 298 K.

CO2 capture capacities of the adsorbents at 298 K and 1 bar.

It should be noted that, although CSc-2 showed lower surface area than that of CSc-4, its CO2 adsorption capacity was much higher than that of CSc-4. As suggested by the pore size analysis discussed above, CSc-2 show developed micropore surface areas and volume (d < 1 nm). The superior CO2 adsorption capacity of sample CSc-2 demonstrates that CO2 adsorption capacity is mainly dependent on the micropores and their pore volume, rather than specific surface area. This is because of the strongly enhanced interaction energy between CO2 molecules and the adsorbent in the narrow pores, which can enhance the packing of gas molecules. Reference Zhuang, Chen, Lin and Xu2,Reference Sevilla, Valle-Vigon and Fuertes3
It is also notable that, for both CSc-2 and CSc-4, although activation at 600 °C produced the lowest surface area and pore structure, the samples activated at lower temperature show the largest adsorption capacity and the flattest adsorption isotherms at lower pressures; this means that CSc-600 samples can absorb large amount of CO2 at lower pressures before the adsorption becomes flat. The average median pore widths of CSc-2-600 and CSc-4-600 were 0.69 and 0.67 nm, respectively (Table I), slightly narrower than those of the other samples; this suggests that smaller pore sizes are better for adsorption at low pressure, and the adsorption potential within these pores is enough to favor capillary condensation. Reference Casco, Martinez-Escandell, Silvestre-Albero and Rodriguez-Reinoso29
Table II also compares the CO2 capture capacity of prepared samples with microporous organic polymers, LTA-zeolites and N-modified MCM-41 in literature, the carbon adsorbents exhibit relatively high capture capacity but simple synthesis method.
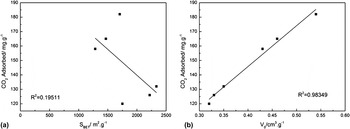
To better understand the relationships between materials parameters such as surface area and narrow micropore volume and CO2 adsorption, linear fits to the adsorption data at 298 K and 1 bar are shown in Fig. 6. There is far stronger correlation between V 0 and CO2 adsorption (R 2 = 0.98349), confirming that the volume of narrow micropores governs the CO2 adsorption capacity, with higher V 0 leading to higher adsorption capacity. Although within each individual series (CSc-4 or CSc-2), higher surface area is correlated with higher adsorption, when all the data are assembled there is little correlation, with R 2 = 0.19511. Thus, S BET is not the main factor determining the gas adsorption capacity.
CO2 uptake at 298 K, 1 bar as a function of (a) BET surface area and (b) narrow micropore volume (V 0).

IV. CONCLUSIONS
Carbon adsorbents with high specific surface areas and controlled developed pore structures were prepared by citric acid-catalyzed hydrothermal carbonization of CMC, followed by KOH activation in N2 atmosphere. The porous structure and CO2 capture capacity were directly governed by activation conditions (activation ratio and activation temperature). Harsh conditions (CSc-4) generated high surface areas (1750–2334 m2/g) with developed micro-mesoporous structures while milder conditions (CSc-2) led to development of more micropores, especially pores narrower than 1 nm. The adsorption capacities of these adsorbents depend strongly on their pore structures and surface areas, as well as the adsorption conditions. For samples prepared using the same activation ratio, higher specific surface areas led to higher CO2 capture capacities at 298 K and 1 bar. However, when samples prepared with different activation ratios are compared, the CO2 capture capacity is dominated by the microporosity, in particular the micropore volume (d = 0.4–0.9 nm). When the adsorption pressure decreased to 0.1 bar, the CO2 capture ability became closely correlated with the amount of ultramicropores (<0.7 nm). Linear fits confirm that adsorption capacity has a direct relationship (R 2 = 0.98349) with the narrow micropore volume (d = 0.4–0.9 nm), while the surface area was not correlated with the capacity under these conditions.
ACKNOWLEDGMENTS
This work was financially supported by the Fundamental Research Funds for the Central Universities (2572014EB01 and 2572014AB17) and the National Natural Science Foundation of China (No. 31170545).