Introduction
The consequences of early life adversity (ELA) on human development and mental health are well-established (Evans et al., Reference Evans, Li and Whipple2013; Wade et al., Reference Wade, Wright and Finegold2022). Distilling active ingredients of adversities by using dimensional models has helped identify distinct components of early environmental experiences that may have different associations with developmental processes (Ellis et al., Reference Ellis, Sheridan, Belsky and McLaughlin2022; McLaughlin et al., Reference McLaughlin, Sheridan and Lambert2014, 2021). Key dimensions explored in prior work include threat, which are experiences conferring harm or possible harm to one’s physical integrity, and deprivation, which refers to reductions in social and cognitive stimulation (Ellis et al., Reference Ellis, Sheridan, Belsky and McLaughlin2022; McLaughlin et al., Reference McLaughlin, Sheridan and Lambert2014, 2021). Dimensional models in the field have primarily focused on proximal experiences such as child abuse and neglect or exposure to violence. However, adversity measured at a more distal (e.g., neighborhood) level may also be associated with psychopathology. Neighborhoods provide critical information on a child’s developmental context and are associated with psychopathology symptoms (Evans et al., Reference Evans, Li and Whipple2013; Gaias et al., Reference Gaias, Lindstrom Johnson, White, Pettigrew and Dumka2018; Sripada et al., Reference Sripada, Swain, Evans, Welsh and Liberzon2014; Whipple et al., Reference Whipple, Evans, Barry and Maxwell2010). Exploring links of neighborhoods on child development could therefore help us understand the development of psychopathology across the lifespan (Elovainio et al., Reference Elovainio, Vahtera, Pentti, Hakulinen, Pulkki-Råback, Lipsanen, Virtanen, Keltikangas-Järvinen, Kivimäki and Kähönen2020; Hastings et al., Reference Hastings, Serbin, Bukowski, Helm, Stack, Dickson, Ledingham and Schwartzman2020; Stokes, Reference Stokes2019; Young et al., Reference Young, Frankenhuis and Ellis2020). Rather than conceptualizing neighborhoods as a monolith, assessing components of neighborhood exposures through a dimensional lens could clarify mechanisms of influence as has been useful for individual-level ELA (McLaughlin et al., Reference McLaughlin, Sheridan and Lambert2014, 2021). Work specifically assessing these neural, neurocognitive, and emotion regulation processes is growing but remains limited, despite potential for informing prevention and intervention efforts (Choi et al., Reference Choi, Teshome and Smith2021; Galan et al., Reference Galan, Shaw, Dishion and Wilson2017; Ip et al., Reference Ip, Sisk, Horien, Conley, Rapuano, Rosenberg, Greene, Scheinost, Constable, Casey, Baskin-Sommers and Gee2022; Maxwell et al., Reference Maxwell, Taylor and Barch2023; Mullins et al., Reference Mullins, Campbell and Hogeveen2020; Suarez et al., Reference Suarez, Burt, Gard, Burton, Clark, Klump and Hyde2022). The current study aims to address these gaps by assessing dimensions of neighborhood exposures and relations to multiple forms of psychopathology, exploring emotional, cognitive, and neural, processes that could underlie these links.
Influences of neighborhood environments on psychopathology can be both indirect and direct. For example, neighborhood features capture the probability of something occurring rather than being a direct measurement of what an individual experiences (e.g., the exposure of high neighborhood crime increases the likelihood that a child will experience a direct threat to their safety) (McLaughlin et al., Reference McLaughlin, Sheridan, Humphreys, Belsky and Ellis2021). Though distal exposures increase the likelihood of an individual experiencing adversity, distal exposures also serve as environmental cues that children perceive, detect, and respond to directly (Ellis et al., Reference Ellis, Sheridan, Belsky and McLaughlin2022). Neighborhood environments are associated with mental health outcomes over and above more proximal influences including the household (Beyer et al., Reference Beyer, Keen, Ertel, Okuzono, Pintro, Delaney and Slopen2024a). Experimental virtual reality studies have shown simulated exposure to neighborhood disadvantage can elicit immediate negative emotions and stress responses (Hackman et al., Reference Hackman, Robert, Grübel, Weibel, Anagnostou, Hölscher and Schinazi2019). The direct and indirect links of distal features could be of particular influence during childhood and early adolescence, when cognitive, affective, and neural processes undergo sensitive periods and are particularly likely to be influenced by the environment (Nelson & Gabard-Durnam, Reference Nelson and Gabard-Durnam2020). Exposure to adverse neighborhood environments during these ages could lead to developmental adjustments fueled by experience driven plasticity, possibly aggregating over time or operating as an initial conduit through which young children then filter or perceive information about environmental risks across the life course (Ellis et al., Reference Ellis, Sheridan, Belsky and McLaughlin2022).
Dimensional models assess aspects of environmental experience that might differentially inform developmental processes contributing to psychopathology and other outcomes (McLaughlin et al., Reference McLaughlin, Sheridan and Lambert2014, 2021). Expanding these models to the contextual, or neighborhood level, could help explain established links of neighborhood and psychopathology symptoms (Echeverria et al., Reference Echeverria, Diez-Roux, Shea, Borrell and Jackson2008; Hill & Maimon, Reference Hill, Maimon, Aneshensel, Phelan and Bierman2013; Huang et al., Reference Huang, Edwards and Laurel-Wilson2020; Lee, Reference Lee2009; McElroy et al., Reference McElroy, McIntyre, Bentall, Wilson, Holt, Kullu, Nathan, Kerr, Panagaki and McKeown2019; Segrin et al., Reference Segrin, Jiao and Cooper2022). A majority of neighborhood studies have focused on one dimension of the neighborhood (e.g., neighborhood disadvantage or socioeconomic status) (Choi et al., Reference Choi, Teshome and Smith2021; Galan et al., Reference Galan, Shaw, Dishion and Wilson2017; Ip et al., Reference Ip, Sisk, Horien, Conley, Rapuano, Rosenberg, Greene, Scheinost, Constable, Casey, Baskin-Sommers and Gee2022; Maxwell et al., Reference Maxwell, Taylor and Barch2023; Mullins et al., Reference Mullins, Campbell and Hogeveen2020; Suarez et al., Reference Suarez, Burt, Gard, Burton, Clark, Klump and Hyde2022). Because neighborhoods involve numerous co-occurring features, it is critical to evaluate multiple dimensions simultaneously to identify whether these associations and underlying mechanisms are general, or specific to particular neighborhood characteristics.
Further, research exploring neural and behavioral mechanisms informing links of neighborhoods and mental health outcomes has to this point been relatively limited (Rakesh et al., 2021, Reference Rakesh, Zalesky and Whittle2022; Vargas et al., Reference Vargas, Damme and Mittal2022a). Research on individual-level exposure to deprivation and threat offers some possibilities for tailored hypotheses. For example, research has found individual-level experiences of deprivation in children—including low cognitive stimulation and neglect—is associated with lower levels of executive function (EF) (Johnson et al., Reference Johnson, Policelli, Li, Dharamsi, Hu, Sheridan, McLaughlin and Wade2021; Machlin et al., Reference Machlin, Miller, Snyder, McLaughlin and Sheridan2019; Miller et al., 2018, 2021). Systematic review has also found individual-level deprivation experiences also relate to altered function in frontoparietal brain regions (McLaughlin et al., Reference McLaughlin, Weissman and Bitrán2019). At the individual level, deprivation has been assessed as experiences of low cognitive stimulation and neglect. At the neighborhood level, deprivation comprises a lack of resources, enrichment, and stimulation necessary for adaptive development (Vargas, et al., 2020). Work on neighborhood-level deprivation has found links with prefrontal structure (Taylor et al., Reference Taylor, Cooper, Jackson and Barch2020; Vargas, et al., Reference Vargas and Mittal2020) and both higher order executive function and sensorimotor neural functional systems (Rakesh et al., Reference Rakesh and Zalesky2021).
In contrast, the threat dimension describes an umbrella of experiences involving harm or threat of harm to a child’s physical integrity. These experiences can occur at the individual or neighborhood level. For example, at the individual level, threat experiences could involve physical abuse or violence in the home. Indeed, individual-level experiences of threat have been linked to alterations in emotion processing, including emotional reactivity, emotional learning, and emotion regulation (Heleniak et al., Reference Heleniak, Jenness, Stoep, McCauley and McLaughlin2016; Kim & Cicchetti, Reference Kim and Cicchetti2010; McLaughlin & Lambert, Reference McLaughlin and Lambert2017; Milojevich et al., Reference Milojevich, Norwalk and Sheridan2019; Weissman et al., Reference Weissman, Bitran, Miller, Schaefer, Sheridan and McLaughlin2019). Further, systematic reviews of neuroimaging studies demonstrate that individual-level threat is associated with heightened amygdala activation to threat in youth (McLaughlin et al., Reference McLaughlin, Weissman and Bitrán2019). At the neighborhood level, threat could include experiences of lack of safety and heightened vigilance due to crime levels in a neighborhood (Vargas, et al., 2022). Contextual work has found associations of neighborhood threat with brain structure in areas involved in integration of environmental cues, processing of threat related stimuli, and differentiation of safety cues, including precuneus and dorsolateral prefrontal areas (Vargas et al., Reference Vargas, Damme and Mittal2022). Work on neighborhood crime has established associations with mental health (Baranyi et al., Reference Baranyi, Di Marco, Russ, Dibben and Pearce2021) and early research suggests links with brain structure and function (Cai et al., Reference Cai, Yang, Zhou, Ip, Adam, Haase and Qu2024); however, factors that help explain underlying associations of neighborhood and psychopathology are not well understood.
Emerging work using ABCD has yielded valuable insights, finding associations of neighborhoods, brain structure, resting state connectivity across global and specific networks, and psychopathology symptoms (Galan et al., Reference Galan, Shaw, Dishion and Wilson2017; Ip et al., Reference Ip, Sisk, Horien, Conley, Rapuano, Rosenberg, Greene, Scheinost, Constable, Casey, Baskin-Sommers and Gee2022; Mullins et al., Reference Mullins, Campbell and Hogeveen2020; Rakesh et al., 2022, 2023, 2024). Crucially, this work has not often assessed multiple neighborhood dimensions in tandem, which is necessary for teasing contributions of specific neighborhood components. Further, this is a burgeoning area, and work using an indirect effects framework to identify specific processes that could inform links of aspects of neighborhoods and psychopathology remains limited (Choi et al., Reference Choi, Teshome and Smith2021; Maxwell et al., Reference Maxwell, Taylor and Barch2023; Rakesh et al., 2021; Suarez et al., Reference Suarez, Burt, Gard, Burton, Clark, Klump and Hyde2022). To address these gaps, the study pursues the following hypotheses:
-
1. Higher neighborhood threat and deprivation will predict greater psychopathology symptoms.
-
2. (a) Neighborhood threat will have an indirect effect on psychopathology through emotion regulation (including regions engaged for emotion reactivity in the emotional n-back task, and automatic emotion regulation from the emotional Stroop task), such that neighborhood threat associations will be partially accounted for by emotion regulation processes (Cai et al., Reference Cai, Yang, Zhou, Ip, Adam, Haase and Qu2024); (b) Neighborhood deprivation will have an indirect effect on symptoms through executive function (including regions engaged during inhibition in the stop signal task, and neurocognitive performance).
In addition to these hypotheses, the study pursues pre-registered exploratory analyses on resting state amygdala to network and within-network connectivity.
Method
Analysis plans were preregistered on the Open Science Framework (https://osf.io/78wxa). Deviations from the preregistration are fully described.
Sample
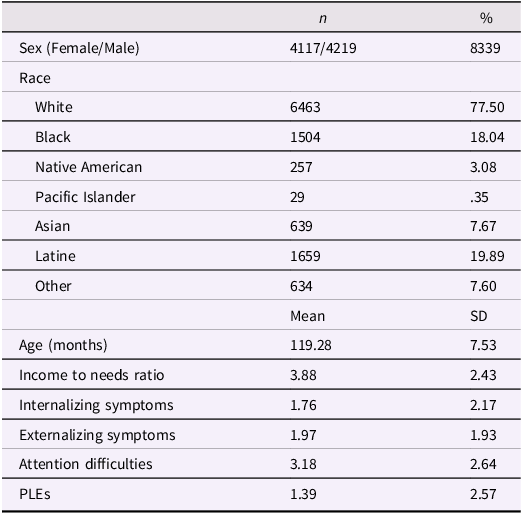
The ABCD study ® is a population-based study of children in the United States, with a sample of 11,868 children enrolled at 9–10 years of age (Cardenas-Iniguez et al., Reference Cardenas-Iniguez, Schachner, Ip, Abad and Herting2023; Casey et al., Reference Casey, Cannonier, Conley, Cohen, Barch, Heitzeg, Soules, Teslovich, Dellarco, Garavan, Orr, Wager, Banich, Speer, Sutherland, Riedel, Dick, Bjork, Thomas and Dale2018b; Luciana et al., Reference Luciana, Bjork, Nagel, Barch, Gonzalez, Nixon and Banich2018). The study aims to understand brain, cognitive, and behavioral development across childhood to early adulthood (Casey et al., Reference Casey, Cannonier, Conley, Cohen, Barch, Heitzeg, Soules, Teslovich, Dellarco, Garavan, Orr, Wager, Banich, Speer, Sutherland, Riedel, Dick, Bjork, Thomas and Dale2018b). Protocols were IRB approved by respective sites. Parents or guardians of participants provided informed consent, and youth provided assent for participation. After applying the recommended exclusion criteria for imaging data (Hagler et al., Reference Hagler, Hatton, Cornejo, Makowski, Fair, Dick, Sutherland, Casey, Barch, Harms, Watts, Bjork, Garavan, Hilmer, Pung, Sicat, Kuperman, Bartsch, Xue and Dale2019), the final sample was 8,339 (Table 1).
Demographic characteristics

aParticipant endorsed “other,” “don’t know,” or “would rather not say.”
Measures
Deprivation dimension
The area deprivation index (ADI) was calculated using Census data and baseline subject addresses, based on the American Community Survey 2015 5-year summary (Kind et al., Reference Kind, Jencks, Brock, Yu, Bartels, Ehlenbach, Greenberg and Smith2014). The ADI is made up of 17 indices, with greater values representing increased disadvantage. Procedures are described elsewhere (Kind et al., Reference Kind, Jencks, Brock, Yu, Bartels, Ehlenbach, Greenberg and Smith2014). The ADI assesses a set of exposures that relate to financial, educational, and material resource availability (Supplement 1; e.g., median home value, proportion of individuals without a high school education, proportion of the population living at federal poverty levels) — all of which can contribute to reduced access to cognitive and social stimulation in the local environment (e.g., under-resourced schools, fewer play areas, lower levels of linguistic and semantic complexity in the neighborhood, lower institutional support). As such, higher ADI values directly correlate with higher levels of deprivation at the neighborhood level (Rakesh et al., Reference Rakesh, McLaughlin, Sheridan, Humphreys and Rosen2024).
Threat dimension
The threat dimension characterizes an umbrella of experiences involving harm or threat of harm to a child’s physical integrity. At the neighborhood level, elevated crime levels may constitute threat exposure as these create an environment where a child is at risk of, or perceives the risk of, physical harm. Neighborhood crime was assessed at baseline through youth self-report on a 5-item Likert scale ranging from 1 (strongly disagree) to 5 (strongly agree) for “My neighborhood is safe from crime.”
Neurocognitive measures of EF
Consistent with prior investigations in ABCD that isolated an EF composite, an average score was created by standardizing and averaging scores on the NIH Toolbox administered at baseline, including the Flanker task, Dimensional Change Card Sort task, and Pattern Comparison Processing Speed task (Thompson et al., Reference Thompson, Barch, Bjork, Gonzalez, Nagel, Nixon and Luciana2019).
Flanker Inhibitory Control and Attention: For 20 trials, the participant is asked to focus on a given stimulus while inhibiting attention to stimuli (arrows) flanking the stimulus. The stimulus will either point in the same direction as the flankers (i.e., congruent stimuli), or in the opposite direction (i.e., incongruent stimulus) (Thompson et al., Reference Thompson, Barch, Bjork, Gonzalez, Nagel, Nixon and Luciana2019).
Dimensional Change Card Sort: The task assesses cognitive flexibility. Participants are presented with two target pictures varying across shape and color. Participants are then asked to match a series of paired test pictures to the target pictures, first according to one dimension (e.g., shape), and after several trials, according to another dimension (e.g., color). Some “switch” trials are employed in which participants are asked to quickly switch from matching based on one dimension to matching based on another, then back to the original dimension.
Pattern Comparison Processing Speed Task: The participant is asked to respond to a maximum of 130 items within 90 s. Participants are asked to discern whether two side-by-side pictures are the same or not, with the items presented one pair at a time on the computer screen.
Neural processes underlying EF
The stop signal task, assessed at baseline and designed to measure cognitive control and inhibition, was used to index neural processes underlying EF abilities (Verbruggen et al., Reference Verbruggen, Aron, Band, Beste, Bissett, Brockett, Brown, Chamberlain, Chambers, Colonius, Colzato, Corneil, Coxon, Dupuis, Eagle, Garavan, Greenhouse, Healthcote, Huster and Boehler2019). For each trial, participants observe a horizontal arrow pointing right or left and indicate the direction of the arrow within 1000 milliseconds. Thirty (16.6%) trials per run are stop trials, during which the horizontal arrow is followed by an upward arrow, or stop signal, for 300 milliseconds. Upon seeing the stop signal, participants inhibit their response. Data was processed and quality control exclusions were made according to ABCD recommendations; Supplement 2 (Epstein et al., Reference Epstein, Karalunas, Tamm, Dudley, Lynch, Altaye, Simon, Maloney and Atluri2023). The correct Stop versus Go contrast and incorrect stop versus correct go contrasts were used, with regions of interest that were task active during inhibition (inferior and middle frontal gyrus, and caudate regions) (Epstein et al., Reference Epstein, Karalunas, Tamm, Dudley, Lynch, Altaye, Simon, Maloney and Atluri2023; Verbruggen et al., Reference Verbruggen, Aron, Band, Beste, Bissett, Brockett, Brown, Chamberlain, Chambers, Colonius, Colzato, Corneil, Coxon, Dupuis, Eagle, Garavan, Greenhouse, Healthcote, Huster and Boehler2019).
Behavioral measures of emotion regulation
The emotional Stroop task, assessed at 1-year, will be used to assess response inhibition to emotional stimuli, as a measure of automatic emotion regulation (Etkin et al., Reference Etkin, Prater, Hoeft, Menon and Schatzberg2010; Stroop, Reference Stroop1935). Participants are presented with emotional words categorized as “good” feelings (i.e., happy, joyful), or “bad” feelings (i.e., angry, upset) along with images of a single teenager’s face per trial, with either a happy or angry expression. For congruent trials, a word and facial emotion of the same valence are presented (i.e., a happy face paired with the word “happy”). For incongruent trials, the word and facial expression are of different valence (e.g., an angry face paired with the word “joyful”). Incongruent trials preceded by congruent trials generate high levels of emotional conflict between nonmatching facial expressions and written words. On the other hand, incongruent trials preceded by incongruent trials involve relatively lower levels of emotional conflict, resulting in shorter reaction times (Etkin et al., Reference Etkin, Prater, Hoeft, Menon and Schatzberg2010). This adaptation effect is interpreted as automatic emotion regulation. An adaptation to emotional conflict score was calculated by subtracting the average reaction time on incongruent trials preceded by a congruent trial from the average reaction time on incongruent trials preceded by an incongruent trial. Higher scores indicate worse adaptation to emotional conflict (Kim et al., Reference Kim, Weissman, Sheridan and McLaughlin2023; Lambert et al., Reference Lambert, King, Monahan and McLaughlin2017).
Neural processes underlying emotion regulation
To index engagement of affective regulation neural processes, assessed at baseline, an affective working memory functional imaging task was used Prior meta-analytic investigations have shown affective working memory stimuli elicit activation in neural regions involved in emotional processing, including the amygdala and ventromedial prefrontal cortex (Schweizer et al., Reference Schweizer, Satpute, Atzil, Field, Hitchcock, Black, Barrett and Dalgleish2019). The negative compared to neutral faces contrast was used (combining across 0-back and 2-back conditions) with a region of interest set in the amygdala, which has elicited engagement for this contrast (Chaarani et al., Reference Chaarani, Hahn, Allgaier, Adise, Owens, Juliano, Yuan, Loso, Ivanciu, Albaugh, Dumas, Mackey, Laurent, Ivanova, Hagler, Cornejo, Hatton, Agrawal, Aguinaldo and Garavan2021). The positive compared to neutral faces contrast was used (combining across 0-back and 2-back conditions) with a region of interest set in the putamen, which has shown deactivation for this contrast (Chaarani et al., Reference Chaarani, Hahn, Allgaier, Adise, Owens, Juliano, Yuan, Loso, Ivanciu, Albaugh, Dumas, Mackey, Laurent, Ivanova, Hagler, Cornejo, Hatton, Agrawal, Aguinaldo and Garavan2021).
Functional imaging for task-based and resting state
ABCD imaging protocols for functional and resting state measures are described extensively elsewhere (Casey et al., Reference Casey, Cannonier, Conley, Cohen, Barch, Heitzeg, Soules, Teslovich, Dellarco, Garavan, Orr, Wager, Banich, Speer, Sutherland, Riedel, Dick, Bjork, Thomas and Dale2018b; Hagler et al., Reference Hagler, Hatton, Cornejo, Makowski, Fair, Dick, Sutherland, Casey, Barch, Harms, Watts, Bjork, Garavan, Hilmer, Pung, Sicat, Kuperman, Bartsch, Xue and Dale2019). For task-based data, exclusions were applied per ABCD recommendations (Chaarani et al., Reference Chaarani, Hahn, Allgaier, Adise, Owens, Juliano, Yuan, Loso, Ivanciu, Albaugh, Dumas, Mackey, Laurent, Ivanova, Hagler, Cornejo, Hatton, Agrawal, Aguinaldo and Garavan2021). Task-based fMRI scans were acquired with fast integrated distortion correction, and high spatial and temporal resolution simultaneous multislice/multiband echo-planar imaging (EPI). The fMRI acquisitions (2.4 mm isotropic, TR = 800 ms) used multiband EPI with slice acceleration factor 6. Siemens and GE 3T scanners used the following scanning parameters: matrix of 90 × 90, 60 slices, field of view = 216 × 216, echo time (TE)/repetition time (TR) (ms) = 800/30, flip angle = 52° and resolution (mm) = 2.4 × 2.4 × 2.4. Tasks used are described in more detail below. Participants practiced the tasks before scanning to ensure instructions were understood. Task-based fMRI tasks occurred last, and the order in which the fMRI tasks occurred was randomized across participants.
For resting state data, participants completed 4–5 resting state scans lasting 5 minutes each with eyes open. Data pre-processing was carried out using a standardized ABCD pipeline (Hagler et al., Reference Hagler, Hatton, Cornejo, Makowski, Fair, Dick, Sutherland, Casey, Barch, Harms, Watts, Bjork, Garavan, Hilmer, Pung, Sicat, Kuperman, Bartsch, Xue and Dale2019). After projecting time courses onto FreeSurfer’s cortical surface, within network and ROI to network connectivity was calculated based on the Gordon parcellation scheme for 12 pre-defined networks, including auditory, cingulo opercular, cingulo parietal, default, dorsal attention, sensorimotor (hand and mouth), fronto parietal, retrospenial temporal, salience, ventral attention, and visual networks (Gordon et al., Reference Gordon, Laumann, Adeyemo, Huckins, Kelley and Petersen2016).
Psychopathology symptoms
Outcome variables include youth-reported mean symptoms for the internalizing, externalizing, and attention subscales of the 52-item Brief Problem Monitor (BPM) (Achenbach & Verhulst, Reference Achenbach and Verhulst2010). Scores from each scale were calculated for participants that answered each item within the scale. In addition, youth-reported symptoms for psychotic-like experiences from the ABCD 21-item Prodromal Questionnaire—Brief Child Version (PQ-B) was included (Karcher et al., Reference Karcher, Paul, Johnson, Hatoum, Baranger, Agrawal, Thompson, Barch and Bogdan2022). Symptoms data was used at 1-year timepoint (for deprivation analyses) and 2-year timepoint (for threat analyses; see “Timing of measures used in analyses” section below).
Analyses
Dependent variables include sum scores on the BPM internalizing, externalizing and attention subscales and total psychotic-like experiences (PLEs) from the PQ-B, and were estimated in separate models. Predictor variables for each of the models include scores for (a) neighborhood deprivation, and (b) threat. For the first aim, linear mixed models were run with family and site set as random intercepts using R (version 4.3.2). Variables were standardized prior to analysis. Variance Inflation Factor was calculated to ensure values were <5 to rule out problematic collinearity in analyses (Finch & Bolin, Reference H. and J.2017).
For the second aim, hypothesized indirect effects of neighborhood threat included adaptation to emotional conflict from Emotional Stroop, and task-active ROIs for the negative versus neutral faces contrast for the emotional n-back. Hypothesized indirect effects for neighborhood deprivation included executive function performance, and task-active ROIs for the stop signal task correct stop versus go contrast and incorrect stop versus correct go contrast. In addition, significant links of neighborhood and resting state-connectivity were followed up with pre-registered exploratory indirect effect analyses. A multilevel 1-1-1 indirect effects analysis was run with the lavaan package in R, using bootstrapping (5,000 draws) and bias-corrected standard errors; Supplement 3. Missing data in SEM models were handled using Full Information Maximum Likelihood (FIML), allowing for retention of partially missing data under the assumption of missing at random (Enders & Bandalos, Reference Enders and Bandalos2001). This allowed covariates such as income to needs to be included in the likelihood function. This approach avoids listwise deletion and retains all available data, which increases statistical power and reduces potential bias associated with case wise deletion. To ensure the robustness of our results, we conducted sensitivity analyses excluding all cases with missing data on covariates; model estimates and conclusions remained substantively unchanged, supporting the appropriateness of the FIML approach in this context. In the presented linear mixed model Aim 1 analyses, we retained listwise deletion given their analytic equivalence to the total effect paths modeled in Aim 2 and the consistency in findings across approaches. The analysis was run clustering within families with site as a fixed effect for aim 1, and for aim 2 analyses were run residualizing out family and site. All analyses include both threat and deprivation indicators in the same model in order to isolate associations that are specific to each dimension while accounting for co-occurrence, as has been recommended for analysis focused on dimensional models of adversity (Berman et al., Reference Berman, McLaughlin, Tottenham, Godfrey, Seeman, Loucks, Suomi, Danese and Sheridan2022; McLaughlin, Reference McLaughlin, Harkness and Hayden2020). Models co-varied for age, sex, and income to needs ratio; Supplement 4. For each of the symptom profile models (internalizing, externalizing, attention, psychotic-like experiences), False Discovery Rate (FDR) correction was used to establish significance, pFDR <0.05 (Benjamini & Hochberg, Reference Benjamini and Hochberg1995).
Timing of measures used in analyses
In the ABCD dataset, not all measures are available at the same timepoints. For aim 1, analyses were conducted with baseline symptoms (though associations for year 1 and 2 symptoms are also reported in Table 2). For indirect effect analyses, timepoints were chosen based on the earliest time point at which measures were available. For neighborhood threat, because the emotional Stroop task was only conducted at the 1-year follow-up, symptoms at year 2 were used as outcome variables. For neighborhood deprivation, because all measures were available at baseline, symptoms at year 1 were used as outcome variables. To maintain consistency, we adopted the same approach for our exploratory analyses. Finally, for neighborhood deprivation, both neighborhood characteristics and putative mediators were assessed at baseline. Since neighborhoods are unlikely to change meaningfully within one year, they can be considered as temporally preceding the behavioral and neural mediators.
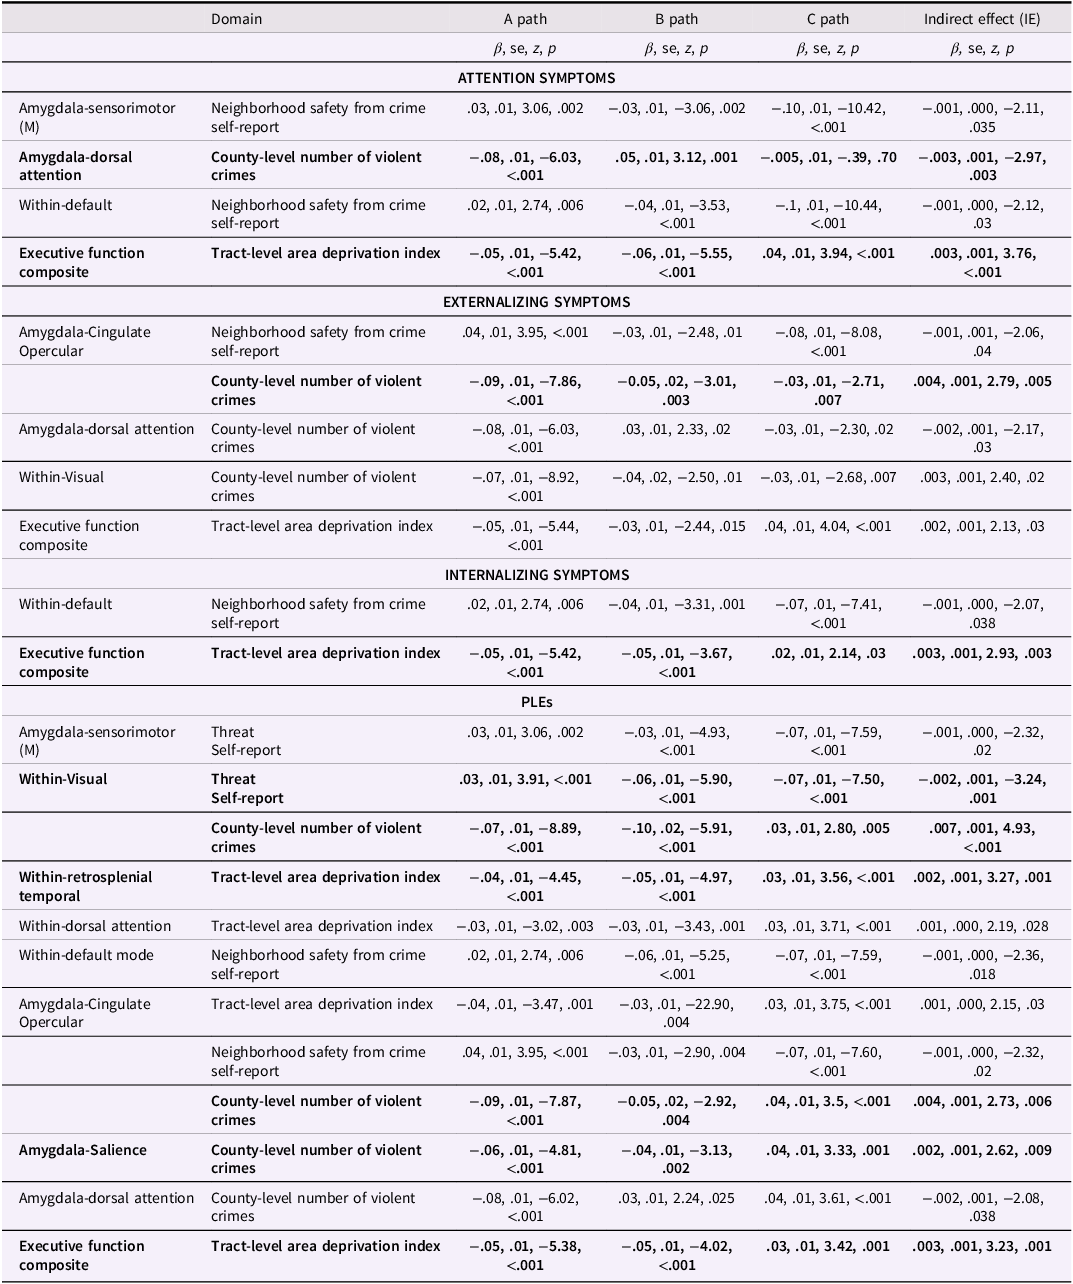
Indirect effects analyses with significant FDR corrected results (bolded)

Hypothesized indirect effects of neighborhood deprivation and threat
For hypothesis-driven behavioral tasks and task-based neuroimaging ROIs described below for neighborhood deprivation and threat, models inputted behavioral tasks and respective ROIs as multiple mediators, as the study was interested with teasing apart relative contributions for neighborhood threat and deprivation.
Neighborhood deprivation
For analyses with neighborhood deprivation as a predictor, the EF composite, and ROIs that were task active during inhibition (inferior and middle frontal gyrus, and caudate regions in the correct stop versus go and incorrect stop versus correct go contrasts) in the stop signal task were imputed as mediators. Similarly, internalizing, externalizing, attention, and psychotic-like experiences assessed at year 1 served as outcome variables. The model covaried for neighborhood crime, age, sex, and income to needs ratio.
Neighborhood threat
For analyses of neighborhood crime as a predictor, the adaptation to emotional conflict score, and task-active ROIs for emotion reactivity (amygdala engagement during negative versus neutral faces, and putamen engagement during positive versus neutral faces contrasts) in the emotional n-back task were added as multiple mediators. Internalizing, externalizing, attention, and psychotic-like experiences assessed at year-2 will serve as outcome variables. The model covaried for neighborhood deprivation, age, sex, and income to needs ratio.
Exploratory analyses: resting state functional connectivity
Threat and deprivation dimensions were specified as predictors. Connectivity between amygdala and 12 major resting state networks was tested in multilevel models, including auditory, cingulo opercular, cingulo parietal, default, dorsal attention, sensorimotor (hand and mouth), fronto parietal, retrospenial temporal, salience, ventral attention, and visual networks (Casey et al., Reference Casey, Cannonier, Conley, Cohen, Barch, Heitzeg, Soules, Teslovich, Dellarco, Garavan, Orr, Wager, Banich, Speer, Sutherland, Riedel, Dick, Bjork, Thomas and Dale2018b; Hagler Jr et al., Reference Hagler, Hatton, Cornejo, Makowski, Fair, Dick, Sutherland, Casey, Barch, Harms, Watts, Bjork, Garavan, Hilmer, Pung, Sicat, Kuperman, Bartsch, Xue and Dale2019). In addition, within network connectivity among 12 major resting state networks were explored for auditory, cingulo opercular, cingulo parietal, default, dorsal attention, sensorimotor (hand and mouth), fronto parietal, retrospenial temporal, salience, ventral attention, and visual networks. Within-network connectivity represents an average of the correlation between all pairs of regions within a network. Significant associations of neighborhood and rs-connectivity were followed up by testing as mediators in exploratory analyses. Significant associations were assessed in separate models given the exploratory nature of these analyses. Although not preregistered, we corrected for multiple comparisons (4 corrections for each symptom domain) using the False Discovery Rate (pFDR < 0.05).
Deviations from pre-registration
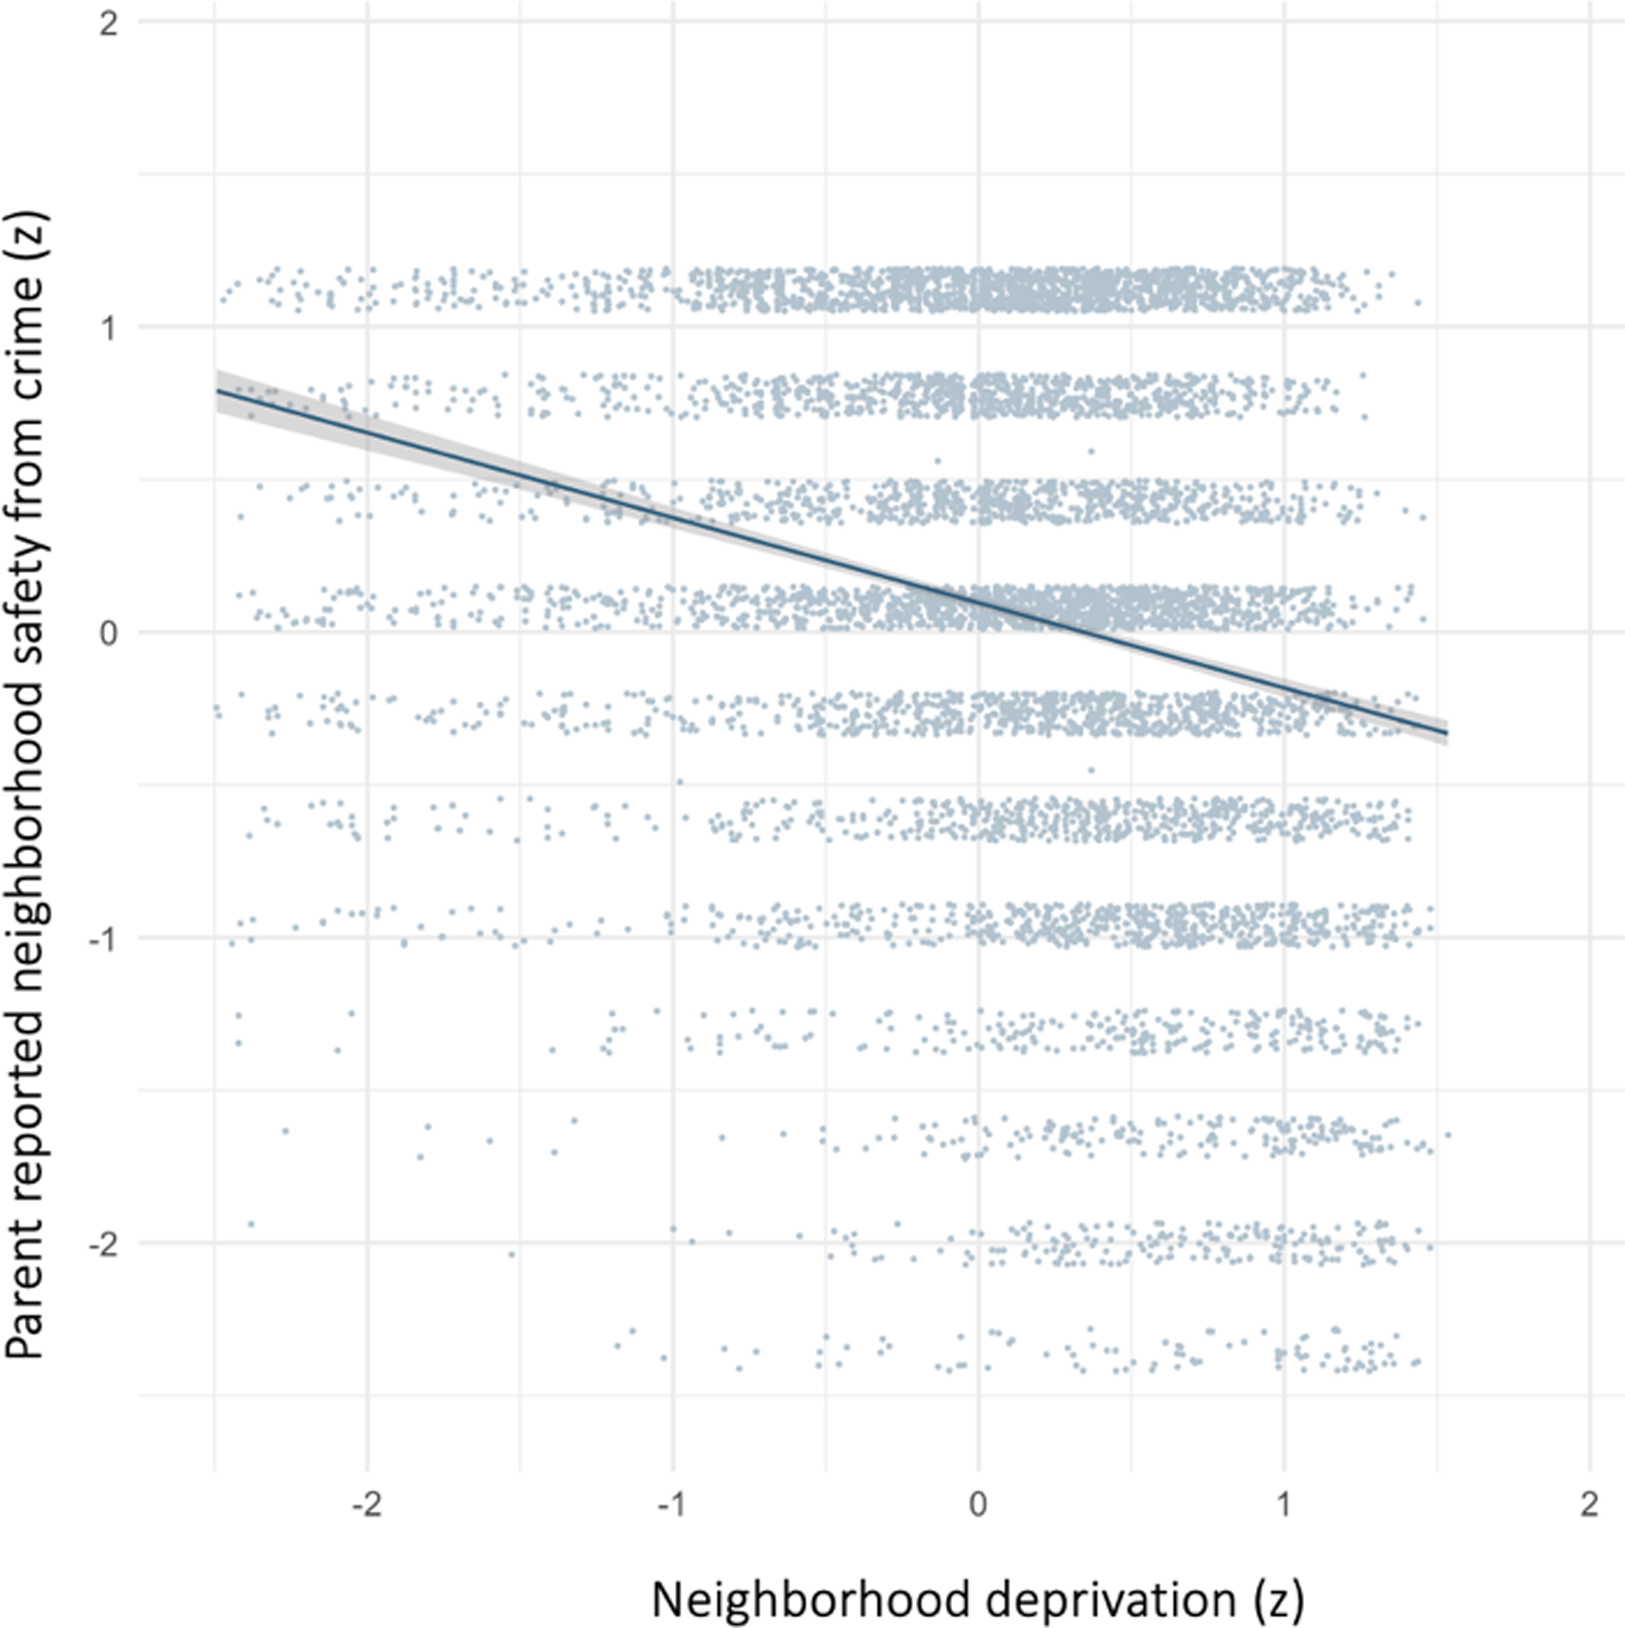
Supplemental measures of neighborhood crime. Parent-reported items for neighborhood crime included “I feel safe walking in my neighborhood, day or night,” “Violence is not a problem in my neighborhood,” and “My neighborhood is safe from crime,” rated on a 5-item Likert scale ranging from 1 (strongly disagree) to 5 (strongly agree). Parent-reported items were used to test associations of neighborhood crime and neighborhood deprivation (Figure 1; Supplement 5).
Parent-reported neighborhood safety from crime and neighborhood deprivation (Spearman r = −0.29). Parents rating neighborhoods as less safe from crime is moderately related to higher neighborhood deprivation scores; correlation of youth self-report and neighborhood deprivation is comparable in magnitude and direction (Spearman r = −0.30).

The pre-registration originally proposed analyses with youth-reported crime, as discussed above. Experiences of lack of safety and threat are core hypothesized mechanisms for this exposure, making perception crucial to the assessment of neighborhood threat (Vargas, Conley, et al., Reference Vargas, Conley and Mittal2020a). However, objective measures of crime are a valuable complement to subjective measures of safety (Beyer et al., Reference Beyer, Enthoven, Groeniger, van Lenthe, Delaney, Slopen and Tiemeier2024b; Zhang et al., Reference Zhang, Fan, Kang, Hu and Ratti2021), particularly as studies have shown that psychopathology symptoms predict increased endorsement of adversity regardless of objective indicators of exposure (Baldwin et al., Reference Baldwin, Reuben, Newbury and Danese2019; Danese & Widom, Reference Danese and Widom2020; Reuben et al., Reference Reuben, Moffitt, Caspi, Belsky, Harrington, Schroeder, Hogan, Ramrakha, Poulton and Danese2016). The ABCD study provided an objective measure of violent crimes extracted and averaged from 2010 to 2012 at the county level including number of arrests and offenses for murder, rape, robbery and aggravated assault (Investigation, 2014). Though not initially pre-registered, analyses are also presented using this objective neighborhood threat measure.
On the other hand, theorized mechanisms for neighborhood deprivation exposures include a lack of enrichment and stimulation necessary for healthy development. Awareness is not needed for a lack of enrichment to effect development (McLaughlin et al., Reference McLaughlin, Sheridan, Humphreys, Belsky and Ellis2021). Thus, neighborhood deprivation was operationalized objectively using geocoded markers, and analyses are presented as originally pre-registered.
Individual-level exposures
Though not originally pre-registered, sensitivity analyses were run to account for individual life events and trauma exposure to isolate neighborhood-specific effects. Results remained largely consistent in magnitude and direction (Supplement 6).
Results
Associations between neighborhood and concurrent psychopathology symptoms
Higher neighborhood deprivation was associated with greater endorsement of attention difficulties (β[SE] = .08[.01], t = 6.77, p < .001), externalizing symptoms (β[SE] = .05[.01], t = 3.78, p < .001), and psychotic-like experiences (β[SE] = .04[.01], t = 3.13, p = .002). Neighborhood deprivation was not related to internalizing symptoms (β[SE] = .02[.01], t = 1.62, p = .11). On the other hand, higher neighborhood threat related to higher levels of internalizing (β[SE] = −.09[.01], t = −6.94, p < .001), attention (β[SE] = −.1[.01], t = –11.66, p < .001), and externalizing symptoms (β[SE] = −.10[.01], t = −7.96, <.001), as well as psychotic-like experiences (β[SE] = −.10[.01], t = −8.37, p < .001).
Associations of neighborhood experiences with putative neural and behavioral processes
Contrary to predictions, neighborhood deprivation was not associated with caudate or inferior and middle frontal gyrus engagement for the incorrect stop versus go and correct stop versus go contrasts. However, higher exposure to neighborhood deprivation was associated with lower EF scores (β[SE] = −.07[.01], z = –5.07, p < .001).
Contrary to hypotheses, neighborhood threat did not significantly relate to amygdala engagement for the N-back negative versus neutral faces contrast, putamen engagement for the N-back positive versus neutral faces contrast, or the adaptation to emotional conflict score (Table 2).
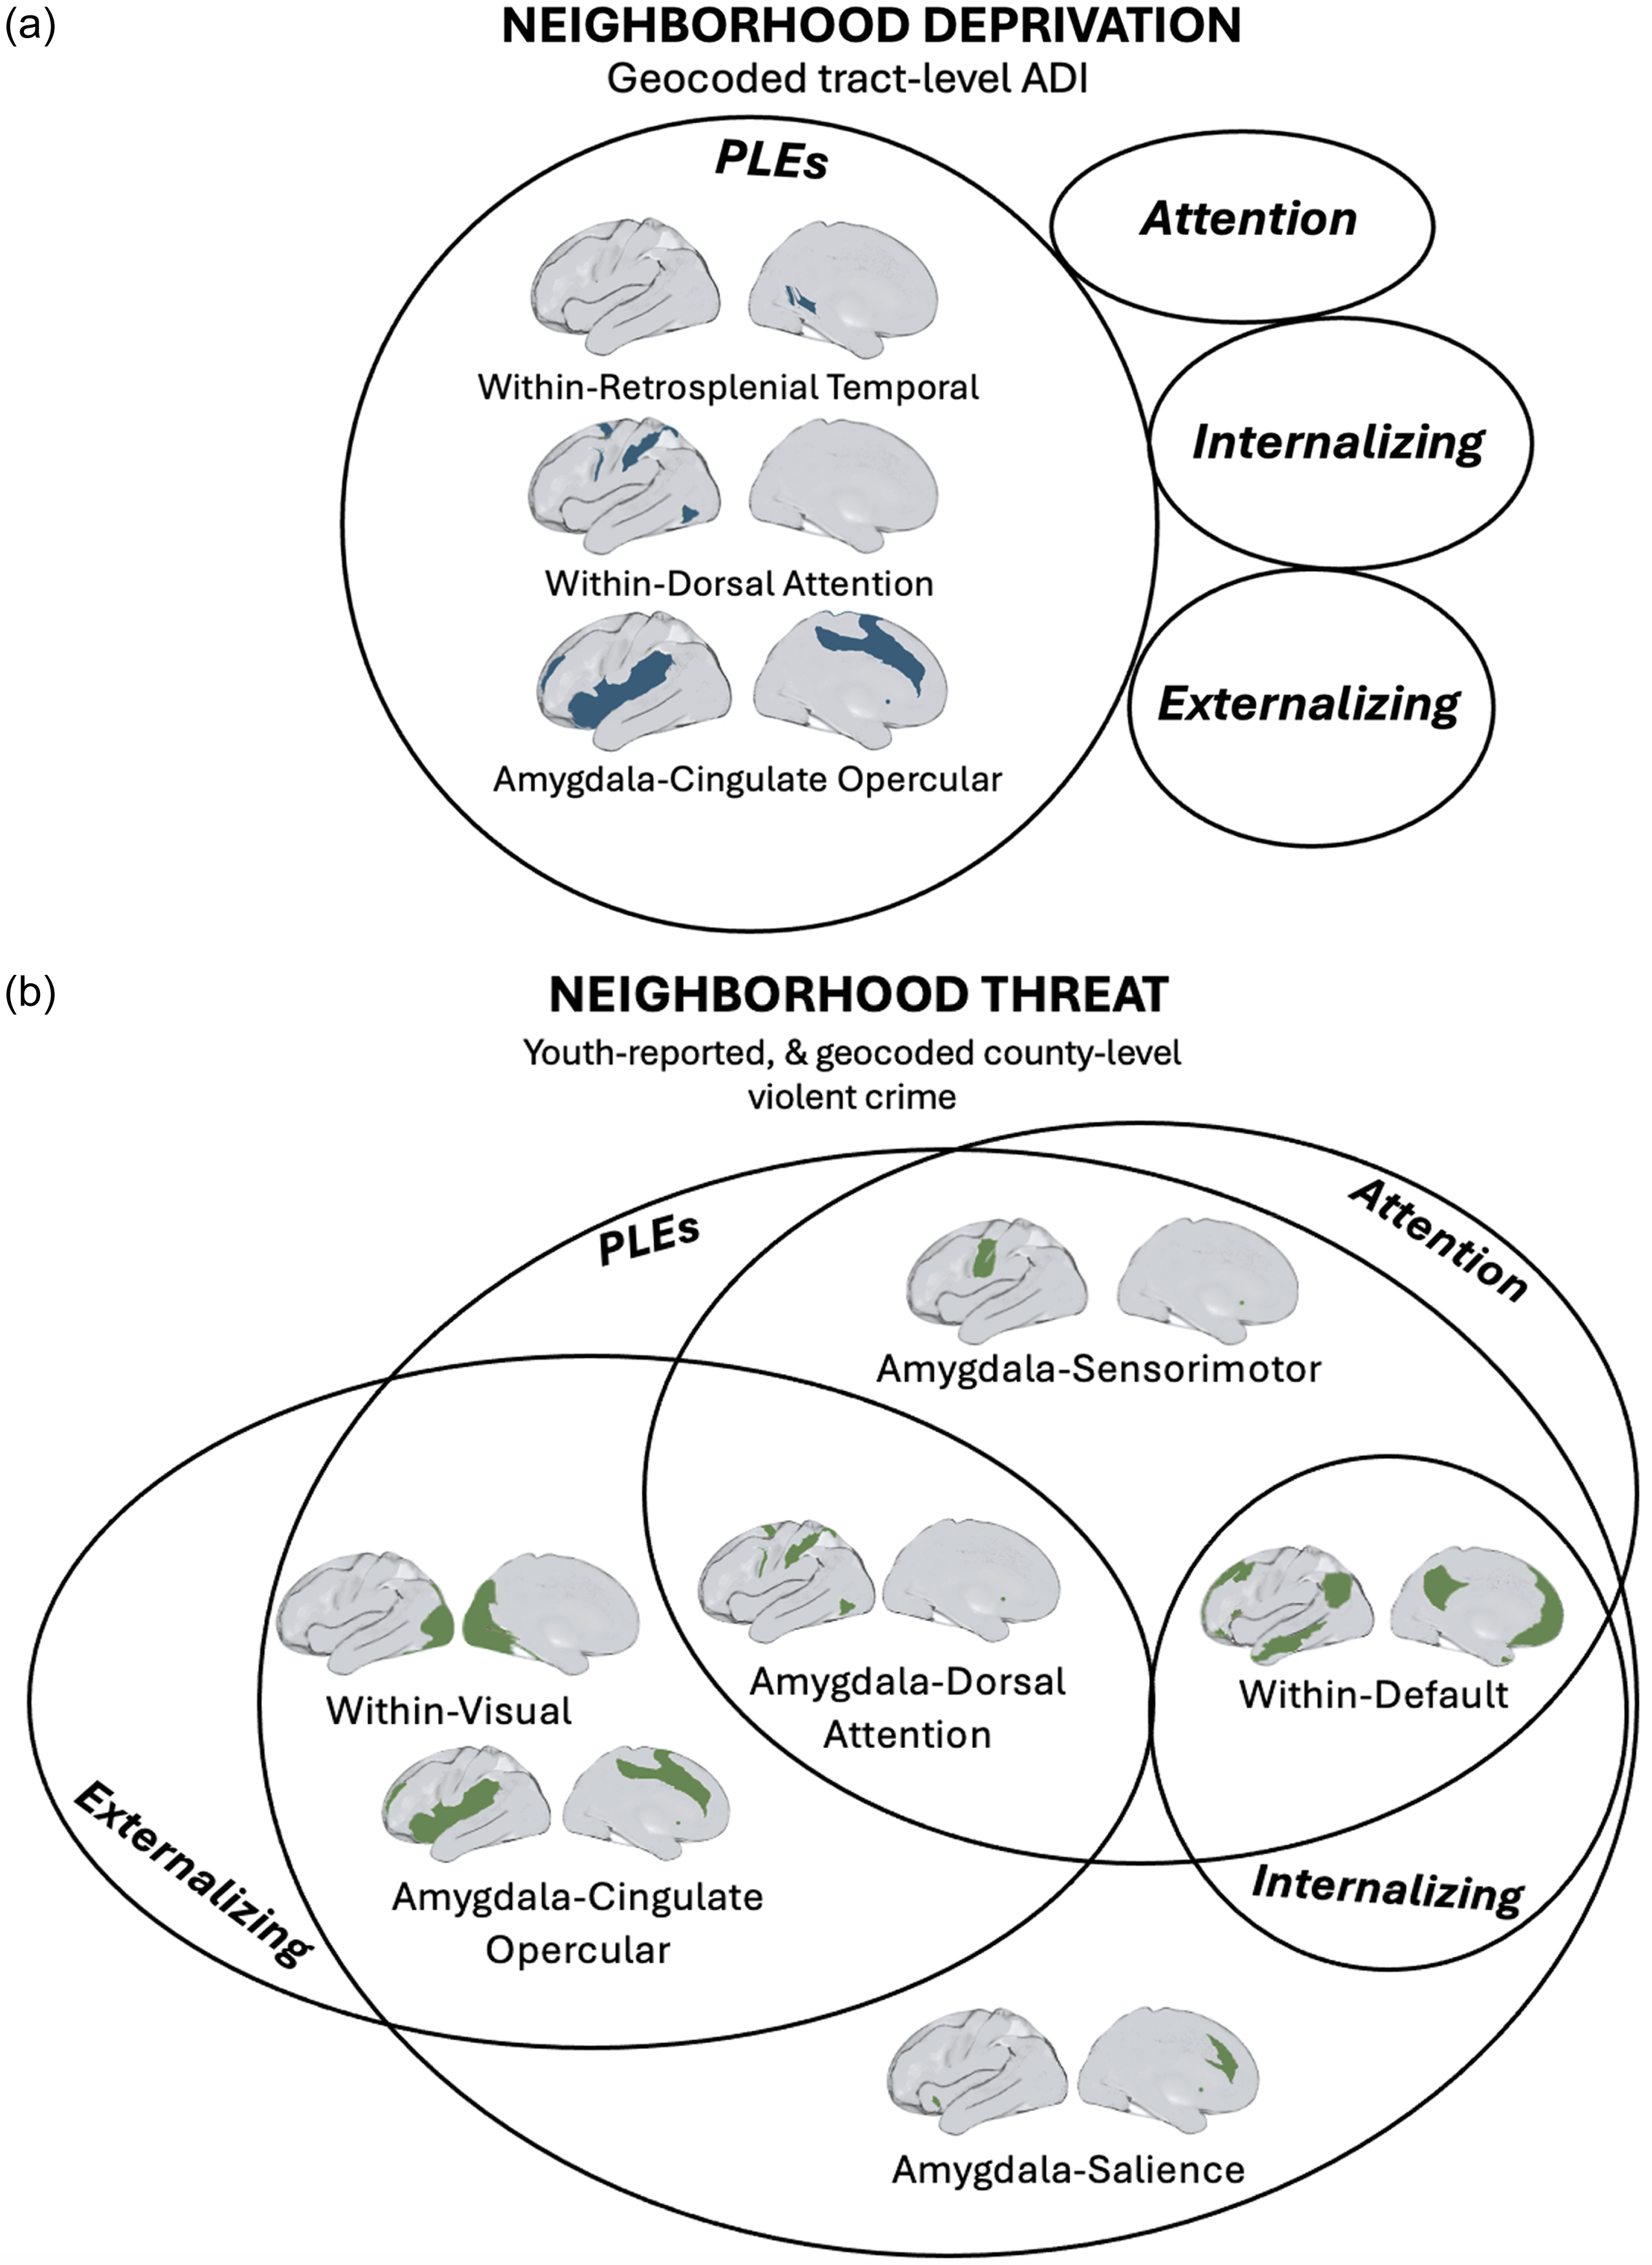
In exploratory analyses, higher neighborhood deprivation, but not threat, was associated with lower amygdala to default mode and amygdala to frontoparietal network connectivity (Table 2). In addition, higher neighborhood deprivation, but not threat, related to lower within-network retrosplenial temporal, ventral attention, cingulo-parietal, and dorsal attention network connectivity. Meanwhile, higher neighborhood threat, but not deprivation, was associated with lower within-network visual and default network connectivity. Finally, higher levels of both neighborhood deprivation and threat related to lower amygdala to cingulo-opercular, and amygdala to sensorimotor motor network connectivity.
Indirect effects
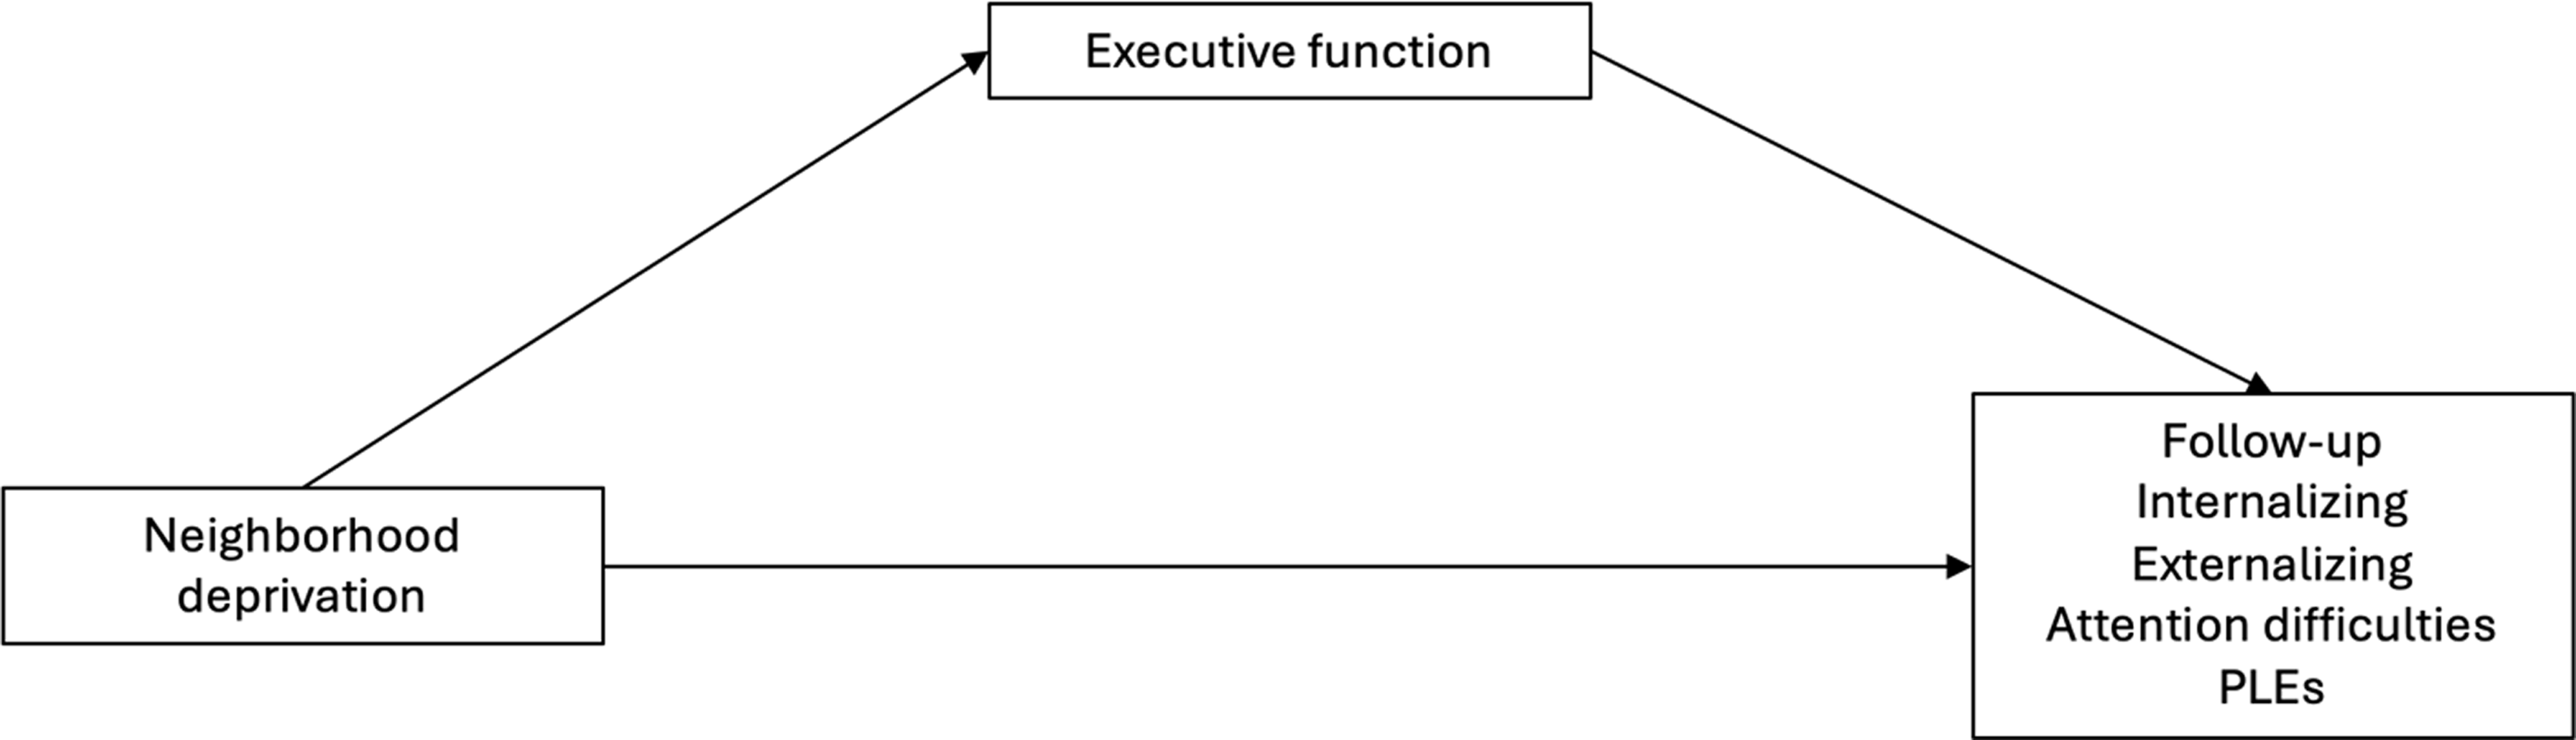
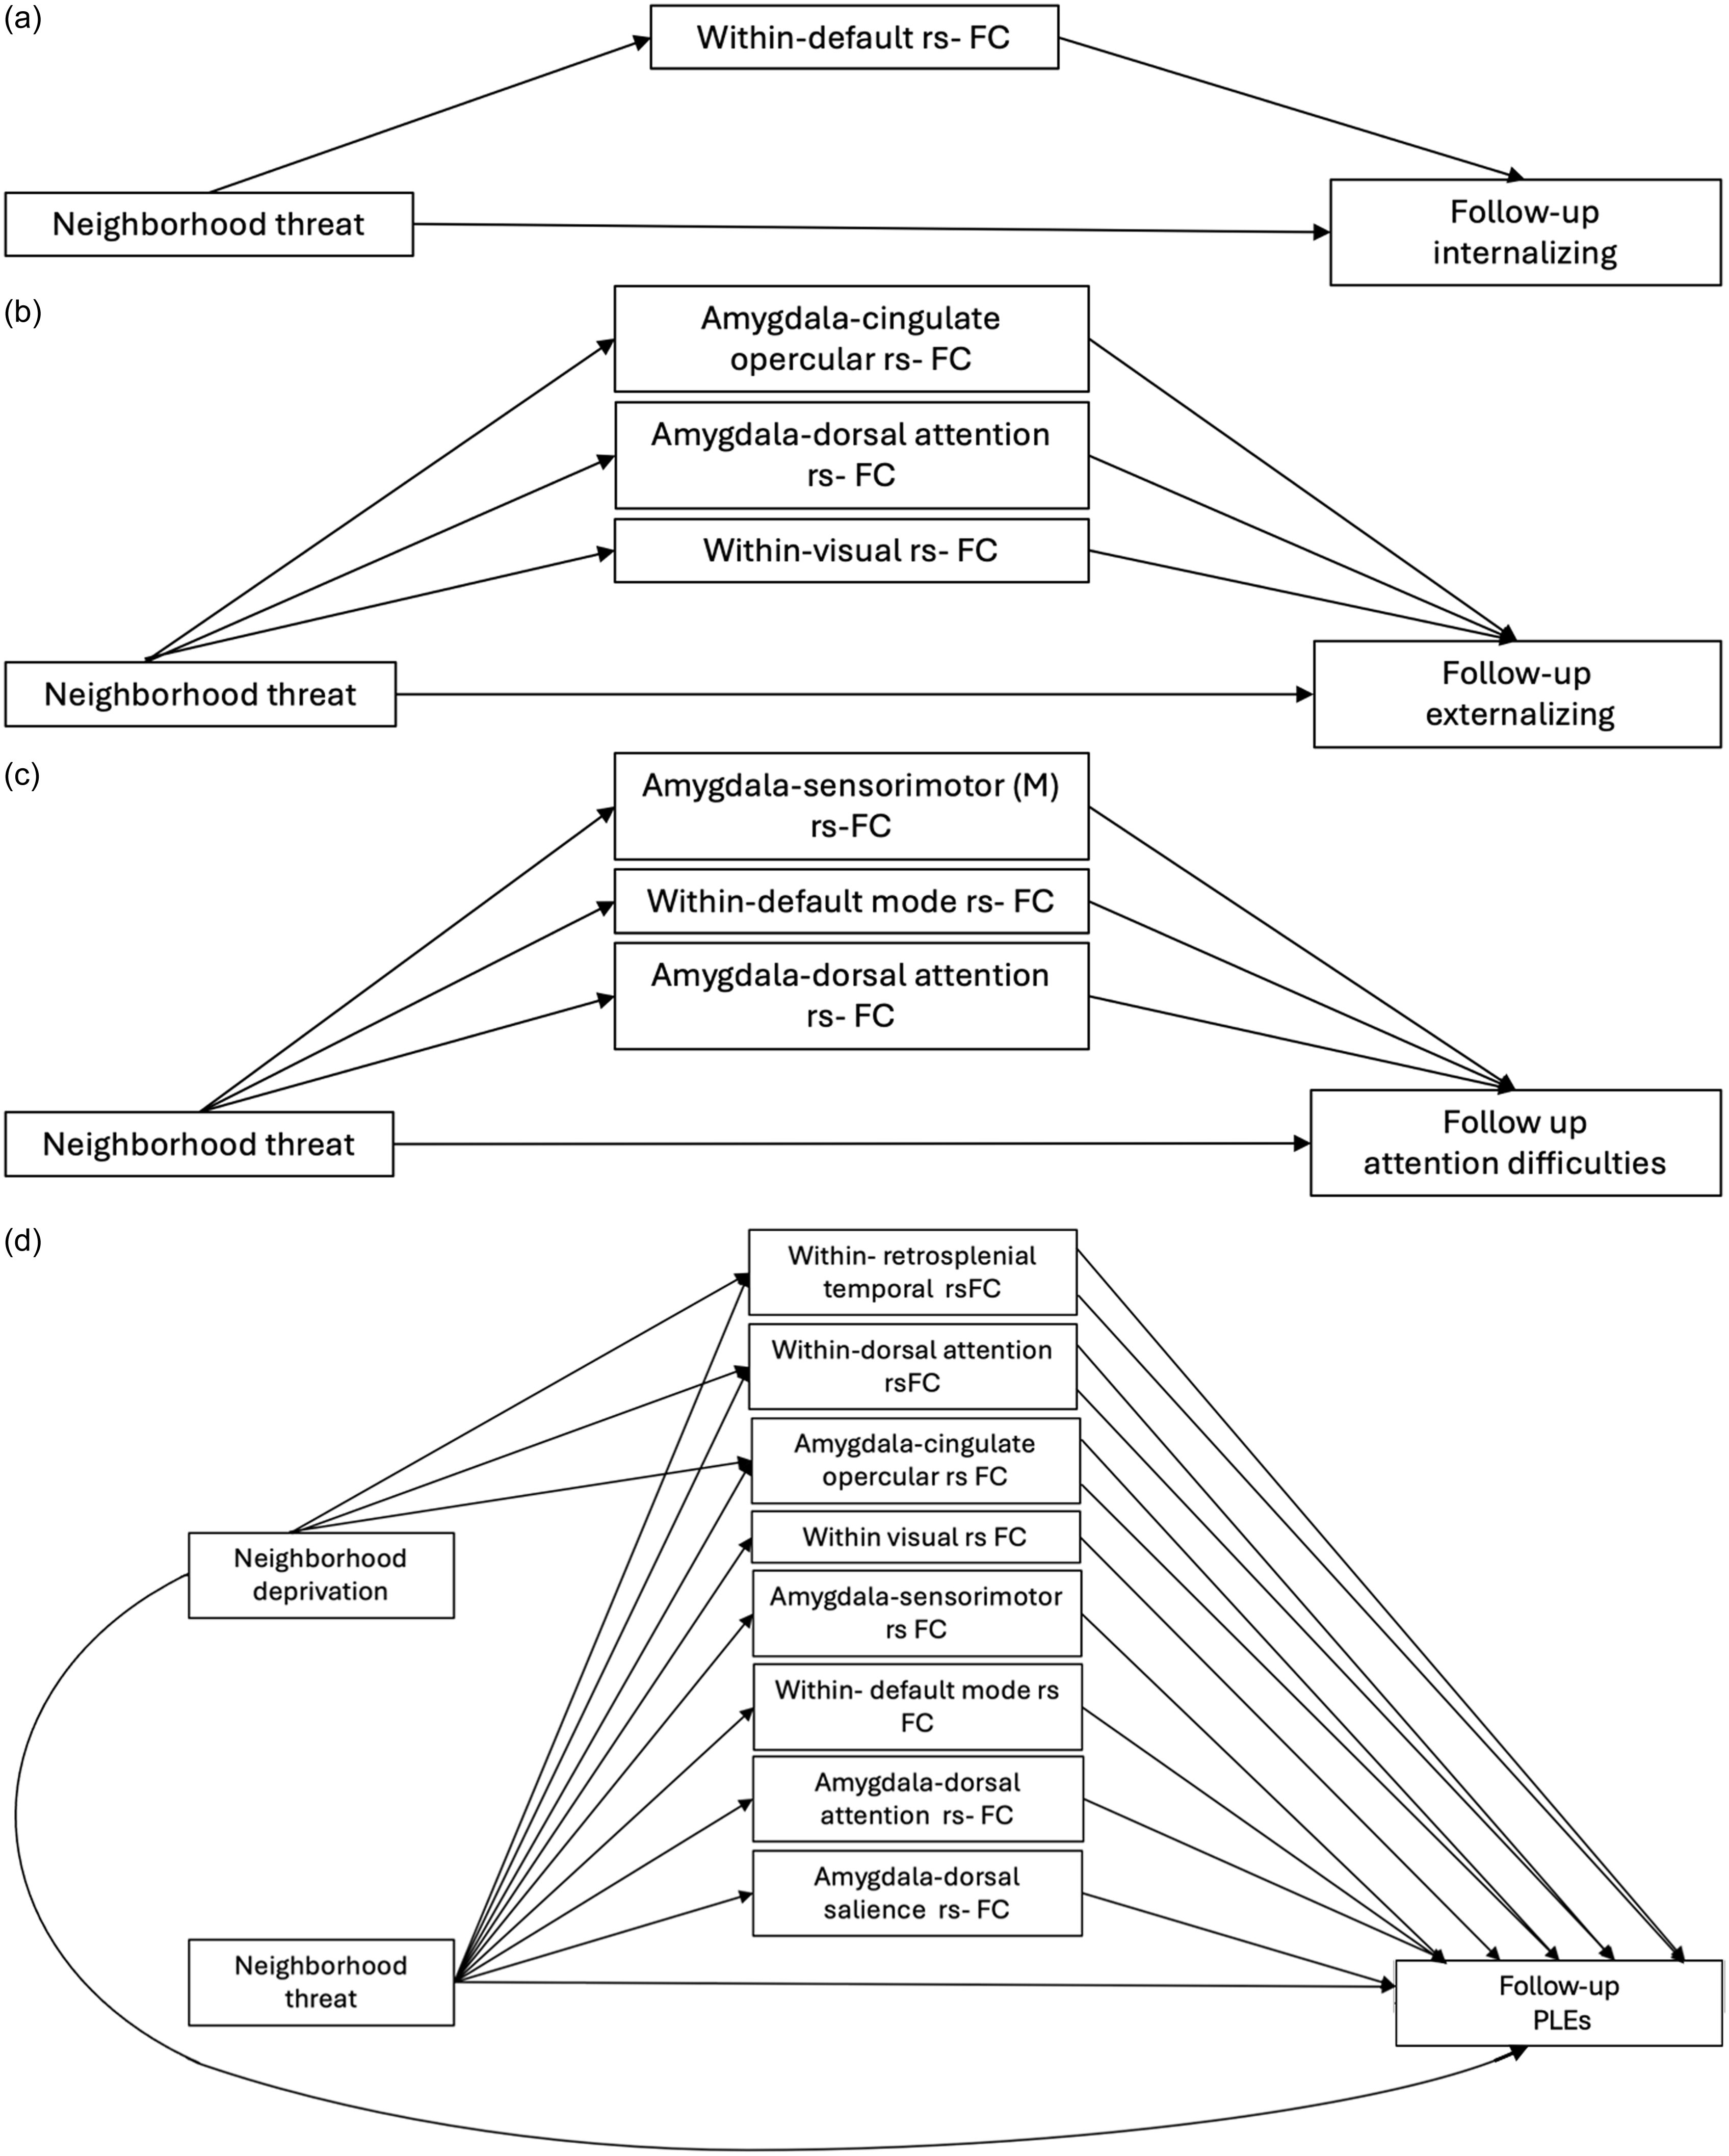
Neighborhood deprivation: EF mediated the association between neighborhood deprivation and psychopathology (i.e., attention difficulties, internalizing and externalizing symptoms, and psychotic-like experiences; see Table 2, Figure 2). Analyses with task-based functional neural activity did not show significant indirect effects (Supplements 7–8). Further, amygdala to sensorimotor motor network connectivity at rest mediated the association of neighborhood deprivation with attention difficulties.
Indirect effect of the association of neighborhood deprivation and psychopathology symptoms through EF performance.

A larger number of variables mediated associations between neighborhood features and PLEs. The association between neighborhood deprivation and PLEs was mediated by amygdala to sensorimotor mouth network connectivity, amygdala to cingulate opercular connectivity, within- visual network, and within-default mode network connectivity (Figure 3).
Indirect effect of the association of neighborhood threat and deprivation and psychopathology symptoms through resting state within-network and amygdala to resting state network connectivity.

Neighborhood threat: Behavioral variables (i.e., EF and emotion Stroop performance) and task-based functional neural activity did not mediate any associations. In exploratory analyses, within-network default mode network connectivity mediated the association between neighborhood threat and both internalizing and attention symptoms (Figure 3). Further, the association between neighborhood threat and externalizing symptoms was mediated by amygdala to cingulo-opercular network connectivity. Finally, associations of neighborhood threat were mediated by changes in connectivity across several distributed brain networks. These include retrosplenial temporal and within-dorsal attention network connectivity, and amygdala to cingulo-opercular network connectivity (Figure 4).
Summary of significant indirect effects of associations of neighborhood deprivation (a) and threat (b) with psychopathology symptoms.

Non-preregistered analyses with objective neighborhood threat indicators: County-level violent crime showed indirect effects consistent with self-reported neighborhood crime through amygdala to cingulate opercular connectivity for PLEs and externalizing symptoms, and through within-visual connectivity and PLEs. Unlike self-reported neighborhood crime, indirect effects through default mode network connectivity were not observed. In addition, county-level violent crimes showed indirect effects for within-visual connectivity and externalizing symptoms. Indirect effects were observed through amygdala to salience network connectivity for PLEs, and for amygdala to dorsal attention network connectivity and PLEs, externalizing, and attention difficulties (Table 2).
Discussion
This study examined the cognitive and neural mechanisms underlying associations of neighborhood deprivation and threat with psychopathology symptoms. As hypothesized, EF mediated associations between neighborhood deprivation and psychopathology across domains. Indirect effects of neighborhood deprivation through resting state were only observed for PLEs, for retrosplenial temporal and dorsal attention networks, previously associated with EF and socioeconomic status (Kaboodvand et al., Reference Kaboodvand, Backman, Nyberg and Salami2018; Menezes et al., Reference Menezes, Souto das Neves, Goncalves, Benetti and Mello-Carpes2020). For neighborhood threat, associations were not detected for adaptation to emotional conflict, as theorized. However, compared to neighborhood deprivation, indirect effects of neighborhood threat on psychopathology were more widely observed, including through default mode, visual, and sensorimotor networks, aligned with prior work suggesting widely distributed links of threat exposure across the brain, including sensory and motor regions (McLaughlin et al., Reference McLaughlin, Weissman and Bitrán2019; Miskovic & Keil, Reference Miskovic and Keil2013; Vargas et al., 2022). In contrast, task-based functional ROIs were unrelated to neighborhood deprivation and threat. Finally, indirect effects of neighborhood features and psychopathology were more widely observed for PLEs compared to other symptom domains, in line with conceptualizations of psychosis spectrum disorders as involving widespread alterations in connectivity (O’Neill et al., Reference O’Neill, Mechelli and Bhattacharyya2019). Results provide insights into processes underlying links between neighborhood disadvantage and vulnerability for psychopathology, pointing toward possible prevention and intervention targets.
For links of neighborhood and symptoms, threat was associated with all symptom domains, while deprivation showed links with all except internalizing symptoms. For neighborhood deprivation, cognitive and neural measures of EF were theorized mechanisms. For behavioral measures for neighborhood deprivation, higher exposure to neighborhood deprivation had an indirect effect on psychopathology symptoms across all four symptom domains through EF, as predicted. Our results extend prior work showing stronger associations of individual-level deprivation with EF relative to threat (Galan et al., Reference Galan, Shaw, Dishion and Wilson2017; Johnson et al., Reference Johnson, Policelli, Li, Dharamsi, Hu, Sheridan, McLaughlin and Wade2021; Kalubi et al., Reference Kalubi, Riglea, O’Loughlin, Potvin and O’Loughlin2023; McElroy et al., Reference McElroy, McIntyre, Bentall, Wilson, Holt, Kullu, Nathan, Kerr, Panagaki and McKeown2019; Mullins et al., Reference Mullins, Campbell and Hogeveen2020; Schafer et al., Reference Schafer, McLaughlin, Manfro, Pan, Rohde, Miguel, Simioni, Hoffmann and Salum2023). Given that EF has been established as a transdiagnostic risk factor for multiple forms of psychopathology, future work could explore EF as a modifiable target to protect against possible adverse effects of neighborhood deprivation (Abramovitch et al., Reference Abramovitch, Short and Schweiger2021; Lynch et al., Reference Lynch, Sunderland, Newton and Chapman2021; Wade et al., Reference Wade, Zeanah, Fox and Nelson2020; Zelazo, Reference Zelazo2020).
In pre-registered exploratory analyses, we tested associations of neighborhood deprivation with resting state network connectivity. Neighborhood deprivation, but not threat, had an indirect effect on PLEs through within-retrosplenial temporal and within-dorsal attention network connectivity. These results align with work linking maternal deprivation exposure to lower EF and episodic memory (Menezes et al., Reference Menezes, Souto das Neves, Goncalves, Benetti and Mello-Carpes2020), which has been previously associated with retrosplenial temporal network engagement (Kaboodvand et al., Reference Kaboodvand, Backman, Nyberg and Salami2018). Further, the dorsal attention network has been linked to EF and socioeconomic status, which captures aspects of individual-level deprivation (Chaarani et al., Reference Chaarani, Hahn, Allgaier, Adise, Owens, Juliano, Yuan, Loso, Ivanciu, Albaugh, Dumas, Mackey, Laurent, Ivanova, Hagler, Cornejo, Hatton, Agrawal, Aguinaldo and Garavan2021). Though future work is needed, results suggest these networks could help explain associations of neighborhood deprivation, but not threat, with PLEs.
Contrary to hypotheses, neighborhood deprivation was not significantly associated with task-based activation during inhibition. One possibility is that the stop-signal task, which primarily assesses inhibition, does not effectively capture the domains of EF most relevant to neighborhood deprivation. Future work that distinguishes other facets of EF could provide greater insight. Alternatively, this null finding might reflect limitations in the stability and reliability of the stop-signal task, which have been well documented, particularly in task-based fMRI analyses within the ABCD study (Kennedy et al., Reference Kennedy, Harms, Korucuoglu, Astafiev, Barch, Thompson, Bjork and Anokhin2022; Yuan et al., Reference Yuan, Hahn, Allgaier, Owens, Chaarani, Potter and Garavan2023). It could also be the case that influences of neighborhood deprivation on neural engagement during response inhibition may not be detectable at this developmental stage, in these task active brain regions, or that these associations are not present overall.
For neighborhood threat, theorized mechanisms included behavioral and neural measures of automatic emotion regulation. We did not find associations with adaptation to emotional conflict, inconsistent with prior work on individual-level threat exposure (Kim et al., Reference Kim, Weissman, Sheridan and McLaughlin2023; Lambert et al., Reference Lambert, King, Monahan and McLaughlin2017). It could be that associations with adaptation to emotional conflict capture components more specific to individual-level threat exposure (i.e., direct experiences of violence) than perceptions of neighborhood threat examined here. Future work disentangling multidimensional emotion regulation processes in tandem could help clarify whether neighborhood-level threat exposure might relate to other forms of emotion regulation. Neighborhood threat was also not associated with engagement in task active brain regions for emotion reactivity, which is inconsistent with prior work on individual-level threat exposure (McLaughlin et al., Reference McLaughlin, Weissman and Bitrán2019; Saarinen et al., Reference Saarinen, Keltikangas-Jarvinen, Jaaskelainen, Huhtaniska, Pudas, Tovar-Perdomo, Penttila, Miettunen and Lieslehto2021; Stevens et al., Reference Stevens, van Rooij, Stenson, Ely, Powers, Clifford, Kim, Hinrichs, Tottenham and Jovanovic2023; White et al., Reference White, Voss, Chiang, Wang, McLaughlin and Miller2019). Task-based ROIs were from a working memory task, rather than directly representing attention orienting or reactivity to negative stimuli; in addition to issues discussed earlier with reliability and stability of ABCD task-based fMRI data, it’s possible these measures do not capture components of automatic emotion reactivity that would be more closely related to neighborhood threat (Kennedy et al., Reference Kennedy, Harms, Korucuoglu, Astafiev, Barch, Thompson, Bjork and Anokhin2022; Yuan et al., Reference Yuan, Hahn, Allgaier, Owens, Chaarani, Potter and Garavan2023). As before, it could also be that associations with processing negative facial stimuli are not yet detectable at this developmental stage, that observing them is context-dependent (i.e., less likely to be observed in the scanner), that task-active regions for emotion reactivity used do not capture this association, or that these associations are not present.
On the other hand, indirect effects of neighborhood threat were observed across symptom dimensions, mediated by within-visual, within-default mode network, and amygdala to sensorimotor and salience/cingulo-opercular network connectivity. Our findings align with recent work linking safety with networks relevant for affect and sensitivity (Cai et al., Reference Cai, Yang, Zhou, Ip, Adam, Haase and Qu2024; Timmers et al., Reference Timmers, Lopez-Sola, Heathcote, Heirich, Rush, Shear, Borsook and Simons2022; White et al., Reference White, Voss, Chiang, Wang, McLaughlin and Miller2019). Visual network connectivity has previously been linked to individual-level early threat experiences (Yu et al., Reference Yu, Linn, Shinohara, Oathes, Cook, Duprat, Moore, Oquendo, Phillips, McInnis, Fava, Trivedi, McGrath, Parsey, Weissman and Sheline2019; Zhang et al., Reference Zhang, Zhao, Zhang, Zhang, Li, Cheng, Pang, Wu and Wang2022), and is postulated to play a role in perception and processing of fear and threat-based cues (Miskovic & Keil, Reference Miskovic and Keil2013; Peverill et al., Reference Peverill, Rosen, Lurie, Sambrook, Sheridan and McLaughlin2023). Similarly, indirect effects through within-default mode network connectivity are consistent with theories suggesting that this network deactivates during cognitively targeted tasks, potentially leading to heightened threat awareness (Whitfield-Gabrieli & Ford, Reference Whitfield-Gabrieli and Ford2012). Altered default mode network connectivity has been implicated in vulnerability for many forms of psychopathology (Lee et al., Reference Lee, Chahal and Gotlib2024; Miller et al., Reference Miller, Logue, Wolf, Maniates, Robinson, Hayes, Stone, Schichman, McGlinchey, Milberg and Miller2017), which aligns with the observed associations across multiple symptom dimensions in the present study.
Notably, non-preregistered analyses with county-level violent crime showed converging indirect effects on symptoms through amygdala to cingulate opercular and visual network connectivity. While indirect effects on psychopathology symptoms through default mode network connectivity were not observed, indirect effects through amygdala to dorsal attention connectivity were observed across PLEs, externalizing and attention difficulties. It is possible that indirect effects through amygdala to dorsal attention connectivity could relate to more frequent engagement of control regions in response to emotionally salient cues in higher crime neighborhoods. While preliminary and non-preregistered, these results highlight the importance of incorporating subjective and objective measures of neighborhood exposures (Beyer et al., Reference Beyer, Enthoven, Groeniger, van Lenthe, Delaney, Slopen and Tiemeier2024b).
The indirect effect of neighborhood threat on attention difficulties through amygdala to sensorimotor network connectivity is consistent with work linking sensorimotor function to attention difficulties (Cortese et al., Reference Cortese, Aoki, Itahashi, Castellanos and Eickhoff2021; Soros et al., Reference Soros, Hoxhaj, Borel, Sadohara, Feige, Matthies, Muller, Bachmann, Schulze and Philipsen2019; Zhang et al., Reference Zhang, Zhao, Cao, Cui, Jiao, Lu, Li and Qiu2020). These observations support research suggesting neighborhood threat might influence widespread neural circuits, including sensory and motor regions (McLaughlin et al., Reference McLaughlin, Weissman and Bitrán2019; Peverill et al., Reference Peverill, Rosen, Lurie, Sambrook, Sheridan and McLaughlin2023; Vargas et al., 2022). Indirect effects of neighborhood threat on externalizing symptoms and PLEs through salience network connectivity extend substantial prior work linking salience network abnormalities to individual-level threat experiences (Colich et al., Reference Colich, Hanford, Weissman, Allen, Shirtcliff, Lengua, Sheridan and McLaughlin2023; Pinto et al., Reference Pinto, Geenen, Wager, Lumley, Hauser, Kosek, Ablin, Amris, Branco, Buskila, Castelhano, Castelo-Branco, Crofford, Fitzcharles, Lopez-Sola, Luis, Marques, Mease and Palavra2023; Szeszko & Yehuda, Reference Szeszko and Yehuda2019; Webb et al., Reference Webb, Weis, Huggins, Parisi, Bennett, Miskovich, Krukowski, deRoon-Cassini and Larson2021).
Notably, while indirect effects through resting state were observed for neighborhood threat across symptom domains, indirect effects of neighborhood deprivation were only observed for links with PLEs. These results are partially inconsistent with burgeoning work on neighborhood deprivation and other symptom dimensions, though this work assessed a single dimension of neighborhoods (i.e., deprivation) and was driven by different hypotheses (Choi et al., Reference Choi, Teshome and Smith2021; Galan et al., Reference Galan, Shaw, Dishion and Wilson2017; Ip et al., Reference Ip, Sisk, Horien, Conley, Rapuano, Rosenberg, Greene, Scheinost, Constable, Casey, Baskin-Sommers and Gee2022; Mullins et al., Reference Mullins, Campbell and Hogeveen2020). This observation is in line with prior work finding stronger associations of neighborhood deprivation with PLEs compared to associations with other neighborhood exposures including threat (Vargas, Damme, Osborne, et al., Reference Vargas, Damme, Osborne and Mittal2022). It is possible that during childhood, deprivation exposures—which are linked to EF and alterations in later-developing brain regions—have stronger associations with putatively neurodevelopmental outcomes (e.g., PLEs) than other neighborhood exposures. Indeed, the domains of neurocognitive function associated with neighborhood deprivation are strongly related to psychosis risk, severity, and prognosis (Catalan et al., Reference Catalan, Salazar de Pablo, Vaquerizo Serrano, Mosillo, Baldwin, Fernández-Rivas, Moreno, Arango, Correll and Bonoldi2021; Molstrom et al., Reference Molstrom, Nordgaard, Urfer-Parnas, Handest, Berge and Henriksen2022; Watson et al., Reference Watson, Harrison, Preti, Wykes and Cella2022). Future work is needed to disentangle whether these effects are stronger compared to other neighborhood exposures in childhood as the brain develops and sensitivity is heightened in later-developing association cortices (Rosen et al., Reference Rosen, Sheridan, Sambrook, Meltzoff and McLaughlin2018). Further, research is needed to determine whether these effects perhaps accumulate over time, such that the influence of neighborhood deprivation on symptom domains not observable in childhood becomes apparent at later developmental stages. Associations of PLEs with rsFC were more widespread compared to other symptom dimensions. These results are aligned with conceptualizations of significant neurodevelopmental influences on psychosis vulnerability (Murray et al., Reference Murray, Bora, Modinos and Vernon2022; Vargas & Mittal, Reference Vargas and Mittal2022). Widespread associations between PLEs and rsFC are also congruent with conceptualizations of psychosis spectrum symptoms as reflecting widespread disruptions in brain connectivity (Sapienza et al., Reference Sapienza, Bosia, Spangaro, Martini, Agostoni, Cuoco, Cocchi and Cavallaro2023).
Although this study has strengths, interpretations should be made considering some limitations. Though we refer to predictors as “neighborhood threat and deprivation” for brevity, the way “neighborhood” was assessed varies considerably across measures. For neighborhood threat, we used a measure of self-reported neighborhood safety from crime as well as county-level crime statistics. Neighborhood deprivation, on the other hand, was estimated at the Census tract level. Counties are significantly larger than Census tracts, and these units are not directly comparable. Data availability constraints prevented us from assessing neighborhood threat and deprivation with equivalent units, and this is a limitation that will need to be addressed in future work. Further, our study relies on a single item youth-reported measure for threat, probing whether “[youths’] neighborhood is safe from crime.” Admittedly this is suboptimal, and work shows self-reported perceptions can be indicators of pre-existing psychopathology symptoms (Baldwin et al., Reference Baldwin, Reuben, Newbury and Danese2019; Danese & Widom, Reference Danese and Widom2020; Reuben et al., Reference Reuben, Moffitt, Caspi, Belsky, Harrington, Schroeder, Hogan, Ramrakha, Poulton and Danese2016). Nonetheless, the authors felt the opportunity to directly probe for feelings of safety at the neighborhood level is nonetheless an informative indicator of whether lack of safety, or the perception of threat, is experienced by youth in their neighborhood environment (Fan et al., Reference Fan, Marshall, Smolker, Gonzalez, Tapert, Barch, Sowell, Dowling, Cardenas-Iniguez, Ross, Thompson and Herting2021). The limited depth of measurement of self-reported threat is a common feature of large population-based studies that often emphasize breadth of constructs assessed as more important than depth of measurement. Further, the neighborhood deprivation measure aggregates across 17 variables, and future work is needed to disentangle relative contributions of different aspects of this measure (Ku et al., Reference Ku, Aberizk, Feurer, Yuan, Druss, Jeste and Walker2024); future work examining whether differences of cost of living moderate associations will be informative. Richer and more granular (e.g., from GPS tracking data) measures of neighborhood environments are needed, including for exposures at different points in development. As race and ethnicity predict mental health, future work is necessary to determine the extent to which neighborhood adversity can explain race-mental health links, and to assess whether race can modify neighborhood adversity-mental health links (Supplement 4). Our work did not explore trajectories, or disentangle age-specific effects, which will be crucial for future work. Lastly, more empirical and theoretical work is needed to disentangle possible impacts of other dimensions of neighborhood experience, including exposures relating to social capital, belonging and exclusion (Vargas, Conley, et al., Reference Vargas, Conley and Mittal2020b). While this is a multi-site study, analyses accounted for clustering within site to correct for site specific effects. Future work assessing measurement invariance of measures both across sites within and outside the United States is needed, and generalizability remains a concern that requires addressing in the field.
One common note on ABCD work across the many constructs it assesses (both distal and proximal) surrounds the size of effects, which are often modest, with median effect sizes estimated at 0.05, with values in first and third quartiles at 0.03 and 0.09, respectively (Owens et al., Reference Owens, Potter, Hyatt, Albaugh, Thompson, Jernigan, Yuan, Hahn, Allgaier, Garavan and Harezlak2021). Some take these effect magnitudes to mean that there are concerns surrounding the existence of clinical significance. However, it is essential to consider that classical thresholds for meaningfulness of effect sizes (i.e., <0.2 is small, >0.50 is medium, >0.80 is large) could be inadequate for characterizing effects in large datasets assessing psychological questions (Funder & Ozer, Reference Funder and Ozer2019; Gignac & Szodorai, Reference Gignac and Szodorai2016; Owens et al., Reference Owens, Potter, Hyatt, Albaugh, Thompson, Jernigan, Yuan, Hahn, Allgaier, Garavan and Harezlak2021; Schafer & Schwarz, Reference Schafer and Schwarz2019). Further, small effects can compound across time and within individuals and have meaningful consequences at the individual and population level (Funder & Ozer, Reference Funder and Ozer2019). Ultimately, given what remains unexplored on neighborhood effects, both in terms of granularity of assessment and accumulation of effects across lifetime, across sensitive developmental periods, and considering different vulnerability factors, this is an empirical question. Future work is certainly necessary to tease out clinical significance of this line of research. Taken together, this work suggests the dimensional conceptualizations of ELA could be informative for neighborhood-level exposures (McLaughlin et al., Reference McLaughlin, Sheridan and Lambert2014, 2021), with putative relevance for finding modifiable intervention and prevention at the individual and societal level.
Supplementary material
For supplementary material/s referred to in this article, please visit https://doi.org/10.1017/S095457942510031X
Data availability statement
ABCD data are available on nda.nih.gov.
Acknowledgements
We are grateful to the participants that donated their time, and to the communities that inspired our work.
Funding statement
Data used in the preparation of this article were obtained from the Adolescent Brain Cognitive Development (ABCD) Study (https://abcdstudy.org), held in the NIMH Data Archive (NDA). This is a multisite, longitudinal study designed to recruit more than 10,000 children age 9–10 and follow them over 10 years into early adulthood. The ABCD Study is supported by the National Institutes of Health and additional federal partners under award numbers U01DA041022, U01DA041028, U01DA041048, U01DA041089, U01DA041106, U01DA041117, U01DA041120, U01DA041134, U01DA041148, U01DA041156, U01DA041174, U24DA041123, U24DA041147, U01DA041093, and U01DA041025. A full list of supporters is available at https://abcdstudy.org/federal-partners.html. A listing of participating sites and a complete listing of the study investigators can be found at https://abcdstudy.org/Consortium_Members.pdf. ABCD consortium investigators designed and implemented the study and/or provided data but did not necessarily participate in analysis or writing of this report. This manuscript reflects the views of the authors and may not reflect the opinions or views of the NIH or ABCD consortium investigators. The ABCD data repository grows and changes over time. This work was also supported by R01-MH106482 (KAM) and R37-MH119194l (KAM), and by a supplement to KAM supporting TV (R37MH119194-04S1).
Competing interests
The authors declare none.