Different strategies have been highlighted for controlling antimicrobial resistance in clinical settings. Reference Davey, Marwick and Scott1,2 Prominent among these is antimicrobial preauthorization, which requires clinicians to request permission from an antimicrobial stewardship team before prescribing specific antimicrobials. The impact of antimicrobial preauthorization and the resultant effects in bacteria that are resistant to those antibiotics have been well established. Reference Baur, Gladstone and Burkert3–Reference Lee, Scully and Camins6 However, preauthorization may facilitate an increase in the use of one or more unrestricted antibiotics and possibly increase the selection pressure for pathogenic bacteria that are resistant to them (ie, ‘squeezing the balloon’ effect). Reference Burke7
It is important to investigate the clinical relevance of a prescribing shift resulting from antimicrobial preauthorization. Borde et al Reference Borde, Kaier and Steib-Bauert8 investigated the effect of cephalosporin restriction on the use of fluoroquinolones; however, to our knowledge, no study has examined the impact of fluoroquinolone preauthorization on the use of third- and fourth-generation cephalosporins and Gram-negative bacterial resistance to cephalosporins.
We previously reported on fluoroquinolone preauthorization and its impact on fluoroquinolone resistance in select bacteria at the University of Alabama at Birmingham (UAB) Hospital. Reference Lee, Scully and Camins6 Also, our preliminary review of antibiotic use at the hospital showed an increase in the use of third- and fourth-generation cephalosporins as a group after fluoroquinolone preauthorization was implemented. In this study, we investigated the changes (1) in the prescribing pattern of ceftriaxone, ceftazidime, and cefepime and (2) in the nonsusceptibility pattern of Gram-negative bacteria to ceftriaxone, ceftazidime, and cefepime, following the implementation of fluoroquinolone preauthorization in the largest academic hospital in Alabama. In each case, we compared the results from these antibiotics with piperacillin-tazobactam and tobramycin. We hypothesized that fluoroquinolone preauthorization in the hospital would result in an increase in the use of ceftriaxone, ceftazidime, and cefepime and that this increased use would subsequently increase Gram-negative bacterial resistance to ceftriaxone, ceftazidime, and cefepime in an inpatient hospital setting.
Methods
Setting, intervention, and design
The UAB Hospital is a tertiary-care hospital with 1,157 beds. Beginning in October 2005, the hospital implemented an antimicrobial stewardship program (ASP) and a fluoroquinolone preauthorization process. Fluoroquinolones in the inpatient formulary (initially comprising levofloxacin, gatifloxacin, moxifloxacin, and ciprofloxacin) were limited to moxifloxacin and ciprofloxacin, and pre-authorization was required before inpatient clinicians could empirically prescribe available fluoroquinolones with the exception of moxifloxacin for community-acquired pneumonia. In addition, treatment with a fluoroquinolone was permitted when there was confirmed susceptibility in cases of Gram-negative bacterial infections. Reference Lee, Scully and Camins6
We used a quasi-experimental interrupted time series (ITS) design to assess the real-world impact of fluoroquinolone preauthorization in a healthcare setting. From 1998 to 2016, data on select, clinically important, Gram-negative bacteria (ie, Pseudomonas aeruginosa, Enterobacter cloacae, Acinetobacter baumannii, Escherichia coli, Klebsiella pneumoniae, Proteus mirabilis, and Serratia marcescens) and inpatient antibiotic use were retrospectively collected for the periods before and after the implementation of fluoroquinolone preauthorization. The UAB Institutional Review Board approved this study.
Outcomes
Two outcomes were evaluated in this study. The first outcome was the use of third- and fourth-generation cephalosporins (ceftriaxone, ceftazidime, and cefepime) in the hospital. The use of piperacillin-tazobactam and tobramycin were also included for comparison. Data on monthly antibiotic use, measured in days of therapy per 1,000 patient days (DOT/1,000 PD) from January 1998 through December 2016, were included for analysis. Data on monthly patient days, a combined measure of number of patients and number of days patients spend in the hospital after admission, were also obtained. 9 Antibiotic use data were obtained from the UAB Hospital pharmacy electronic medical record. The second outcome comprised annual counts of third- and fourth-generation cephalosporins nonsusceptible isolates (NSIs) of select prominent Gram-negative bacteria that are clinically important in healthcare-associated infections (HAIs): P. aeruginosa, E. cloacae, A. baumannii, E. coli, K. pneumoniae, P. mirabilis, and S. marcescens. Reference Jones10,Reference Paterson11 NSIs were defined as isolates that were resistant or showed intermediate resistance to an antibiotic. Reference Lee, Scully and Camins6,Reference Humphries, Ambler and Mitchell12 Ceftriaxone NSIs of E. coli, K. pneumoniae, P. mirabilis, and S. marcescens were evaluated. Ceftazidime NSIs, cefepime NSIs, piperacillin-tazobactam NSIs, and tobramycin NSIs of P. aeruginosa, A. baumannii, E. cloacae, E. coli, K. pneumoniae, P. mirabilis, and S. marcescens were also evaluated. Piperacillin-tazobactam NSIs and tobramycin NSIs were evaluated for comparison. Ceftriaxone NSIs of P. aeruginosa, A. baumannii, and E. cloacae, as well as piperacillin-tazobactam NSIs of A. baumannii, were not evaluated in the present study because of their multidrug resistance and guideline recommendations. Reference Bassetti, Vena, Croxatto, Righi and Guery13 Nonsusceptibility data on hospital isolates from 1998 through 2016 were obtained from the hospital clinical microbiology laboratory. Clinical isolates from inpatient and emergency department locations from all body sites, including blood, skin and soft tissue, respiratory tract, urinary tract, and sterile cultures from the clinical microbiology laboratory were included. Any organism with the same susceptibility pattern from the same patient was only included once per calendar year. Minimum inhibitory concentration (MIC) for each isolate was determined by Microscan (Beckman Coulter, Indianapolis, IN). Susceptibility breakpoints were determined in accordance with US Clinical and Laboratory Standards Institute (CLSI) guidelines at the time of testing. Reference Lee, Scully and Camins6
Exposure
The periods before and after implementation of fluoroquinolone preauthorization were the exposures of interest for both outcomes (ie, antibiotic use and NSIs of Gram-negative bacteria). We reviewed an 18-year period from 1998 through 2016. Fluoroquinolone preauthorization began in October 2005, so we excluded outcome data for this year to capture the period of fluoroquinolone preauthorization distinctly from the period without formal fluoroquinolone preauthorization. For analysis, the period without fluoroquinolone preauthorization was January 1998 to December 2004, and the period after fluoroquinolone preauthorization was implemented was January 2006 to November 2016. For the NSIs of different bacteria as outcomes, we considered 1998–2004 as the period without fluoroquinolone preauthorization and 2006–2016 as the period after fluoroquinolone preauthorization were implemented. This approach was taken because aggregate data on NSIs of bacteria were only available on an annual basis.
Statistical analysis
Trends in monthly antibiotic use before and after the implementation of fluoroquinolone preauthorization was assessed by modeling days of antibiotic therapy using Poisson regression models and adjusting for seasons (winter, December–February; spring, March–May; summer, June–August; fall, September–November) to account for seasonal changes in antibiotic use; monthly patient days was used as an offset for the regression models. Also, Poisson regression models were used to assess yearly trends in NSIs (for each antibiotic) of select Gram-negative bacteria before and after the implementation of fluoroquinolone preauthorization; yearly total number of isolates (NSIs + susceptible isolates) was used as an offset for the regression models. All Poisson regression models accounted for dispersion, and the dispersion parameter was evaluated by dividing model deviance by degrees of freedom. The appropriateness of Poisson regression in segmented time series (like the present study) has been previously described. Reference Kuhn, Davidson and Durkin14 Model equations are provided in the Supplementary Material (online). Rate ratios (RRs), 95% confidence intervals, and P values at an α level of .05 have been reported. SAS version 9.4 software (SAS Institute, Cary, NC) was used for statistical analyses.
Results
Antibiotics use
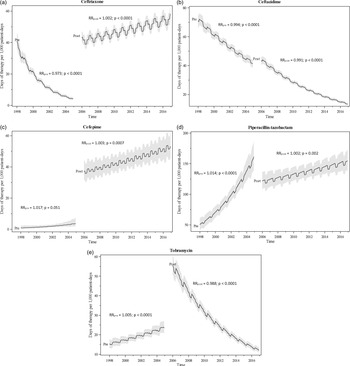
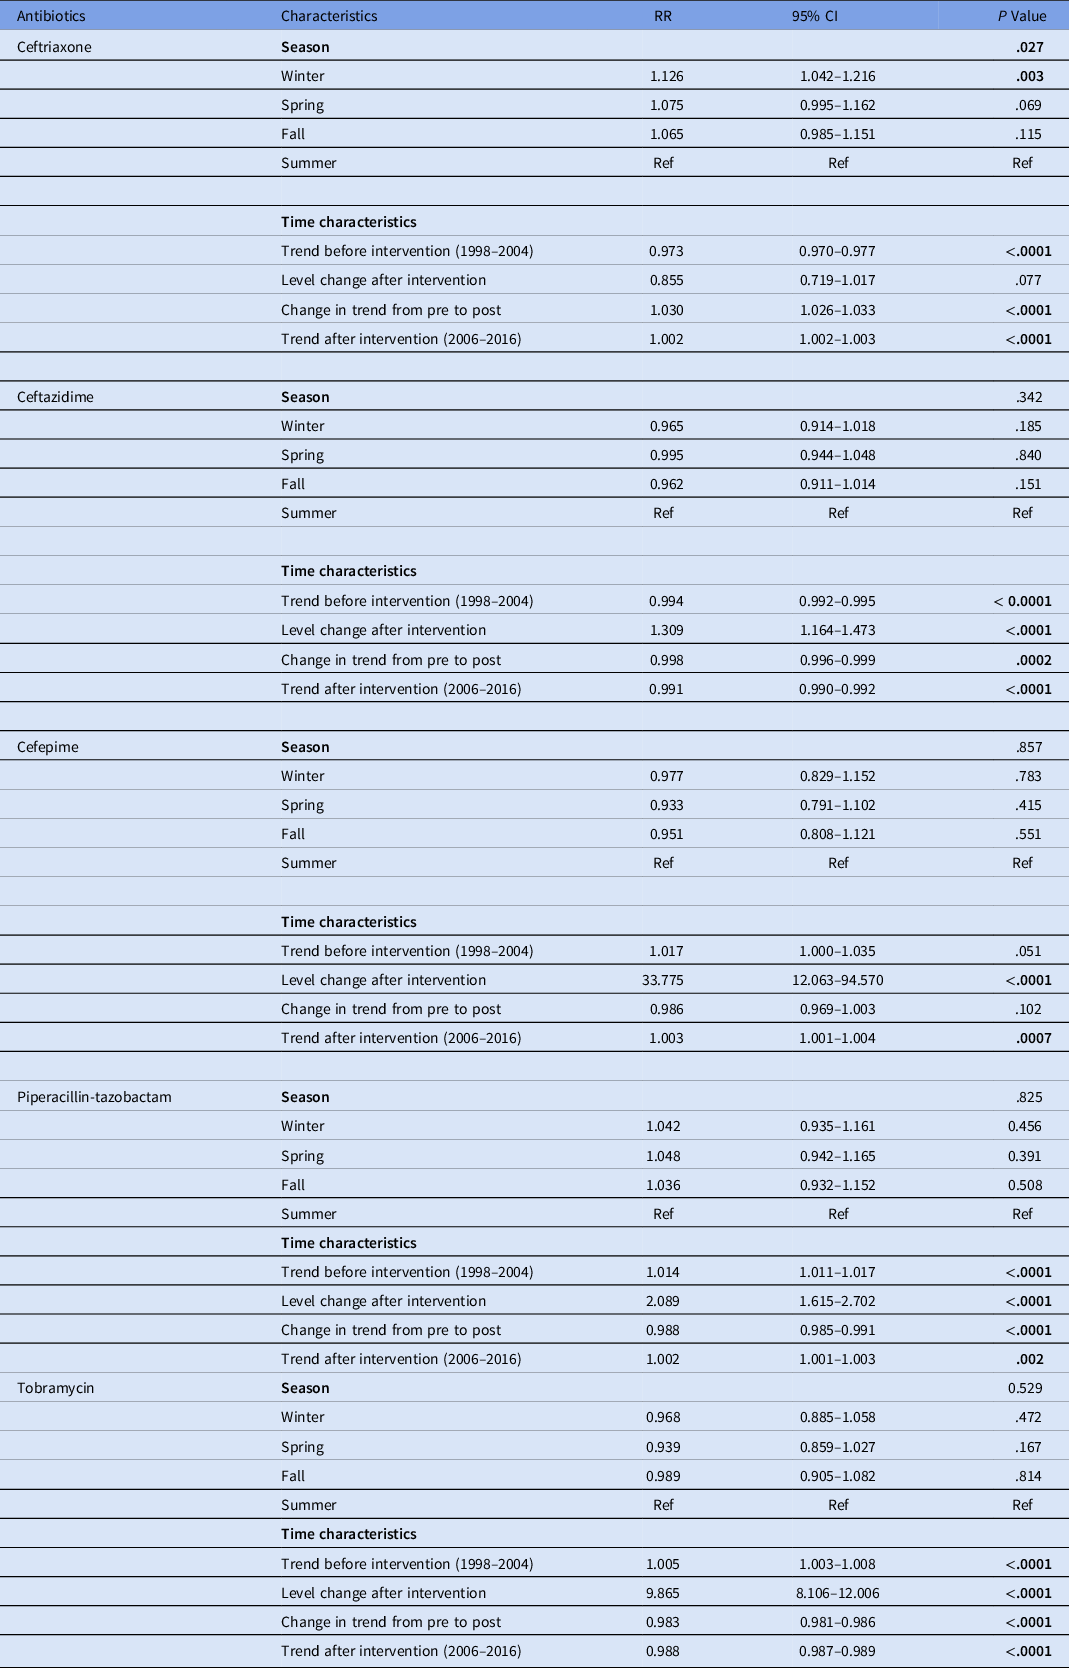
Figure 1 and Table 1 show the rates of use of specific antibiotics before and after the implementation of fluoroquinolone preauthorization. There was an overall decline in the rate of use of ceftriaxone before fluoroquinolone preauthorization was implemented (RR, 0.973; 95% CI, 0.970–0.977; P < .0001). However, after fluoroquinolone preauthorization was implemented, there was an overall increase in the rate of ceftriaxone use over time (RR, 1.002; 95% CI, 1.002–1.003; P < .0001). Ceftazidime use was declining before fluoroquinolone preauthorization was implemented (RR, 0.994; 95% CI, 0.992–0.995; P < .0001), and it continued to decline afterward (RR, 0.991; 95% CI, 0.990–0.992; P < .0001). There was a sharp increase in the use of cefepime immediately after fluoroquinolone preauthorization began (pre-post level change RR, 33.775; 95% CI, 12.063–94.570; P < .0001), and its rate of use continued to trend upward in subsequent years (RR, 1.003; 95% CI, 1.001–1.004; P = .0007). In comparison, the piperacillin-tazobactam rate of use was increasing before fluoroquinolone preauthorization was implemented (RR, 1.014; 95% CI, 1.011–1.017; P < .0001) and continued to increase afterward (RR, 1.002; 95% CI, 1.001–1.003; P = .002). Lastly, the tobramycin rate of use was increasing before fluoroquinolone preauthorization was implemented (RR, 1.005; 95% CI, 1.003–1.008; P < .0001) but declined afterward (RR, 0.988; 95% CI, 0.987–0.989; P < .0001). Supplementary Table 1 (online) lists antibiotic use in DOT/1,000 PD.
Monthly use of (a) ceftriaxone, (b) ceftazidime, (c) cefepime, (d) piperacillin-tazobactam, and (e) tobramycin, in days of therapy per 1,000 patient days, over time (January 1998–December 2016). Fluoroquinolone preauthorization began in October 2005; antibiotic use data for 2005 were excluded to better capture the impacts during the pre- (1998–2004) versus post- (2006–2016) implementation periods. Zig-zag lines represent estimated monthly antibiotic use, adjusting for seasonality (fall, winter, spring, and summer). The shaded region represents the 95% confidence interval of estimates. Note. RRpre, rate ratio before fluoroquinolone preauthorization was implemented; RRpost, rate ratio after fluoroquinolone preauthorization was implemented.

Trends in Monthly Antibiotic Use Before and After Fluoroquinolone Preauthorization (Intervention) from 1998 to 2016

Note. RR, rate ratio for change in monthly antibiotic use; CI, confidence interval. Antibiotic use is measured in days of therapy per 1,000 patient days. RR was estimated using Poisson regression, adjusting for seasonality (fall, winter, spring, and summer). Intervention: fluoroquinolone preauthorization. Bold indicates statistical significance.
Nonsusceptible bacterial isolates
Pseudomonas aeruginosa
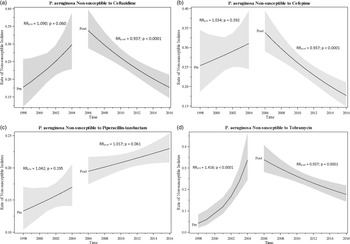
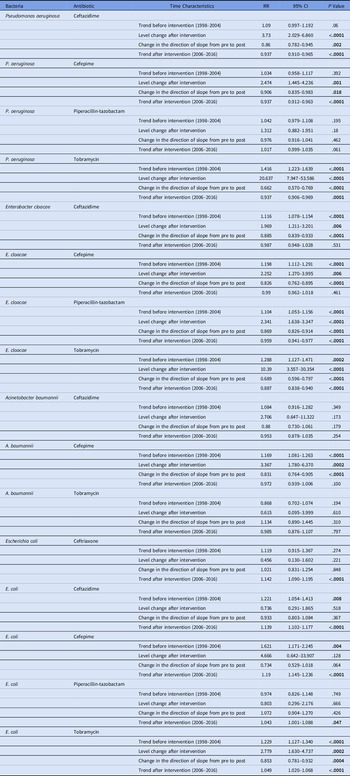
In Figure 2 and Table 2, the rates of NSIs drastically declined, immediately after fluoroquinolone preauthorization was implemented for ceftazidime (pre–post level change RR, 3.730; 95% CI, 2.029–6.860; P < .0001), cefepime (pre–post level change RR, 2.474; 95% CI, 1.445–4.236; P = .001), and tobramycin (pre–post level change RR, 20.637; 95% CI, 7.947–53.586; P < .0001). These antibiotics continued to exhibit downward trends in the rates of NSIs in years after fluoroquinolone preauthorization: ceftazidime (RR, 0.937; 95% CI, 0.910–0.965; P < .0001); cefepime (RR, 0.937; 95% CI, 0.912–0.963; P < .0001); and tobramycin (RR, 0.937; 95% CI, 0.906–0.969; P = .0001). Piperacillin-tazobactam NSIs appeared to be trending upward after fluoroquinolone preauthorization was implemented, with marginal statistical significance (RR, 1.017; 95% CI, 0.999, 1.035; P = .061), and there was no difference between the NSI rate trends before and after fluoroquinolone preauthorization was implemented (RR, 0.976; 95% CI, 0.916–1.041; P = .462).
Trends in annual rates of Pseudomonas aeruginosa isolates nonsusceptible to specific antibiotics (1998–2016): (a) ceftazidime, (b) cefepime, (c) piperacillin-tazobactam, and (d) tobramycin. Plots represent estimated annual rates of nonsusceptible isolates before (1998–2004) and after (2006–2016) fluoroquinolone preauthorization was implemented, respectively. Fluoroquinolone preauthorization began in October 2005; antibiotic use data for 2005 were excluded to better capture the impacts during the pre- (1998–2004) versus post- (2006–2016) implementation periods. The shaded region represents the 95% confidence interval of rate. Rate: estimate of nonsusceptible isolates from Poisson regression divided by the total number of isolates (susceptible + nonsusceptible isolates) for a specific year. Note. RRpre, rate ratio after fluoroquinolone preauthorization was implemented; RRpost, rate ratio after fluoroquinolone preauthorization was implemented.

Trends in Yearly Antibiotic Nonsusceptibility Before and After Fluoroquinolone Preauthorization (Intervention) from 1998 to 2016

Note. RR, rate ratio for change in yearly bacterial nonsusceptibility; CI, confidence interval. RR was estimated using Poisson regression, using yearly counts of nonsusceptible isolates of select Gram-negative bacteria and accounting for yearly total no. of isolates tested. Intervention: fluoroquinolone preauthorization. Bold indicates statistical significance.
Enterobacter cloacae
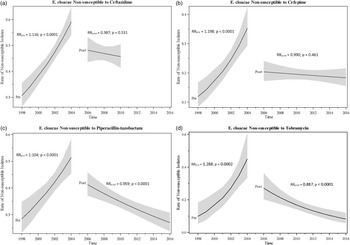
According to Figure 3 and Table 2, the rates of ceftazidime NSIs (RR, 1.116; 95% CI, 1.078–.154; P < .0001) and cefepime NSIs (RR, 1.198; 95% CI, 1.112–1.291; P < .0001) were increasing before fluoroquinolone preauthorization was implemented. However, the rates of NSIs for each of these antibiotics became stable over time afterward (ceftazidime RR, 0.987; 95% CI, 0.948–1.028; P = .531; cefepime RR, 0.990; 95% CI, 0.962–1.018; P = .461). Similarly, the rates of piperacillin-tazobactam NSIs (RR, 1.104; 95% CI, 1.053–1.156; P < .0001) and tobramycin NSIs (RR, 1.288; 95% CI, 1.127–1.471; P = .0002) were increasing before fluoroquinolone preauthorization was implemented; however, these rates declined for each antibiotic afterward (piperacillin-tazobactam RR, 0.959; 95% CI, 0.941–0.977; P < .0001; tobramycin RR, 0.887; 95% CI, 0.838–0.940; P < .0001).
Trends in annual rates of Enterobacter cloacae isolates nonsusceptible to specific antibiotics (1998–2016): (a) ceftazidime, (b) cefepime, (c) piperacillin-tazobactam, and (d) tobramycin. Plots represent estimated annual rates of nonsusceptible isolate before (1998–2004) and after (2006–2016) fluoroquinolone preauthorization was implemented, respectively. Fluoroquinolone preauthorization began in October 2005; antibiotic use data for 2005 were excluded to better capture the impacts during the pre- (1998–2004) versus post- (2006–2016) implementation periods. The shaded region represents the 95% confidence interval of rate. Rate: estimate of nonsusceptible isolates from Poisson regression divided by the total number of isolates (susceptible + nonsusceptible isolates) for a specific year. Note. RRpre, rate ratio before fluoroquinolone preauthorization was implemented; RRpost, rate ratio after fluoroquinolone preauthorization was implemented.

Acinetobacter baumannii
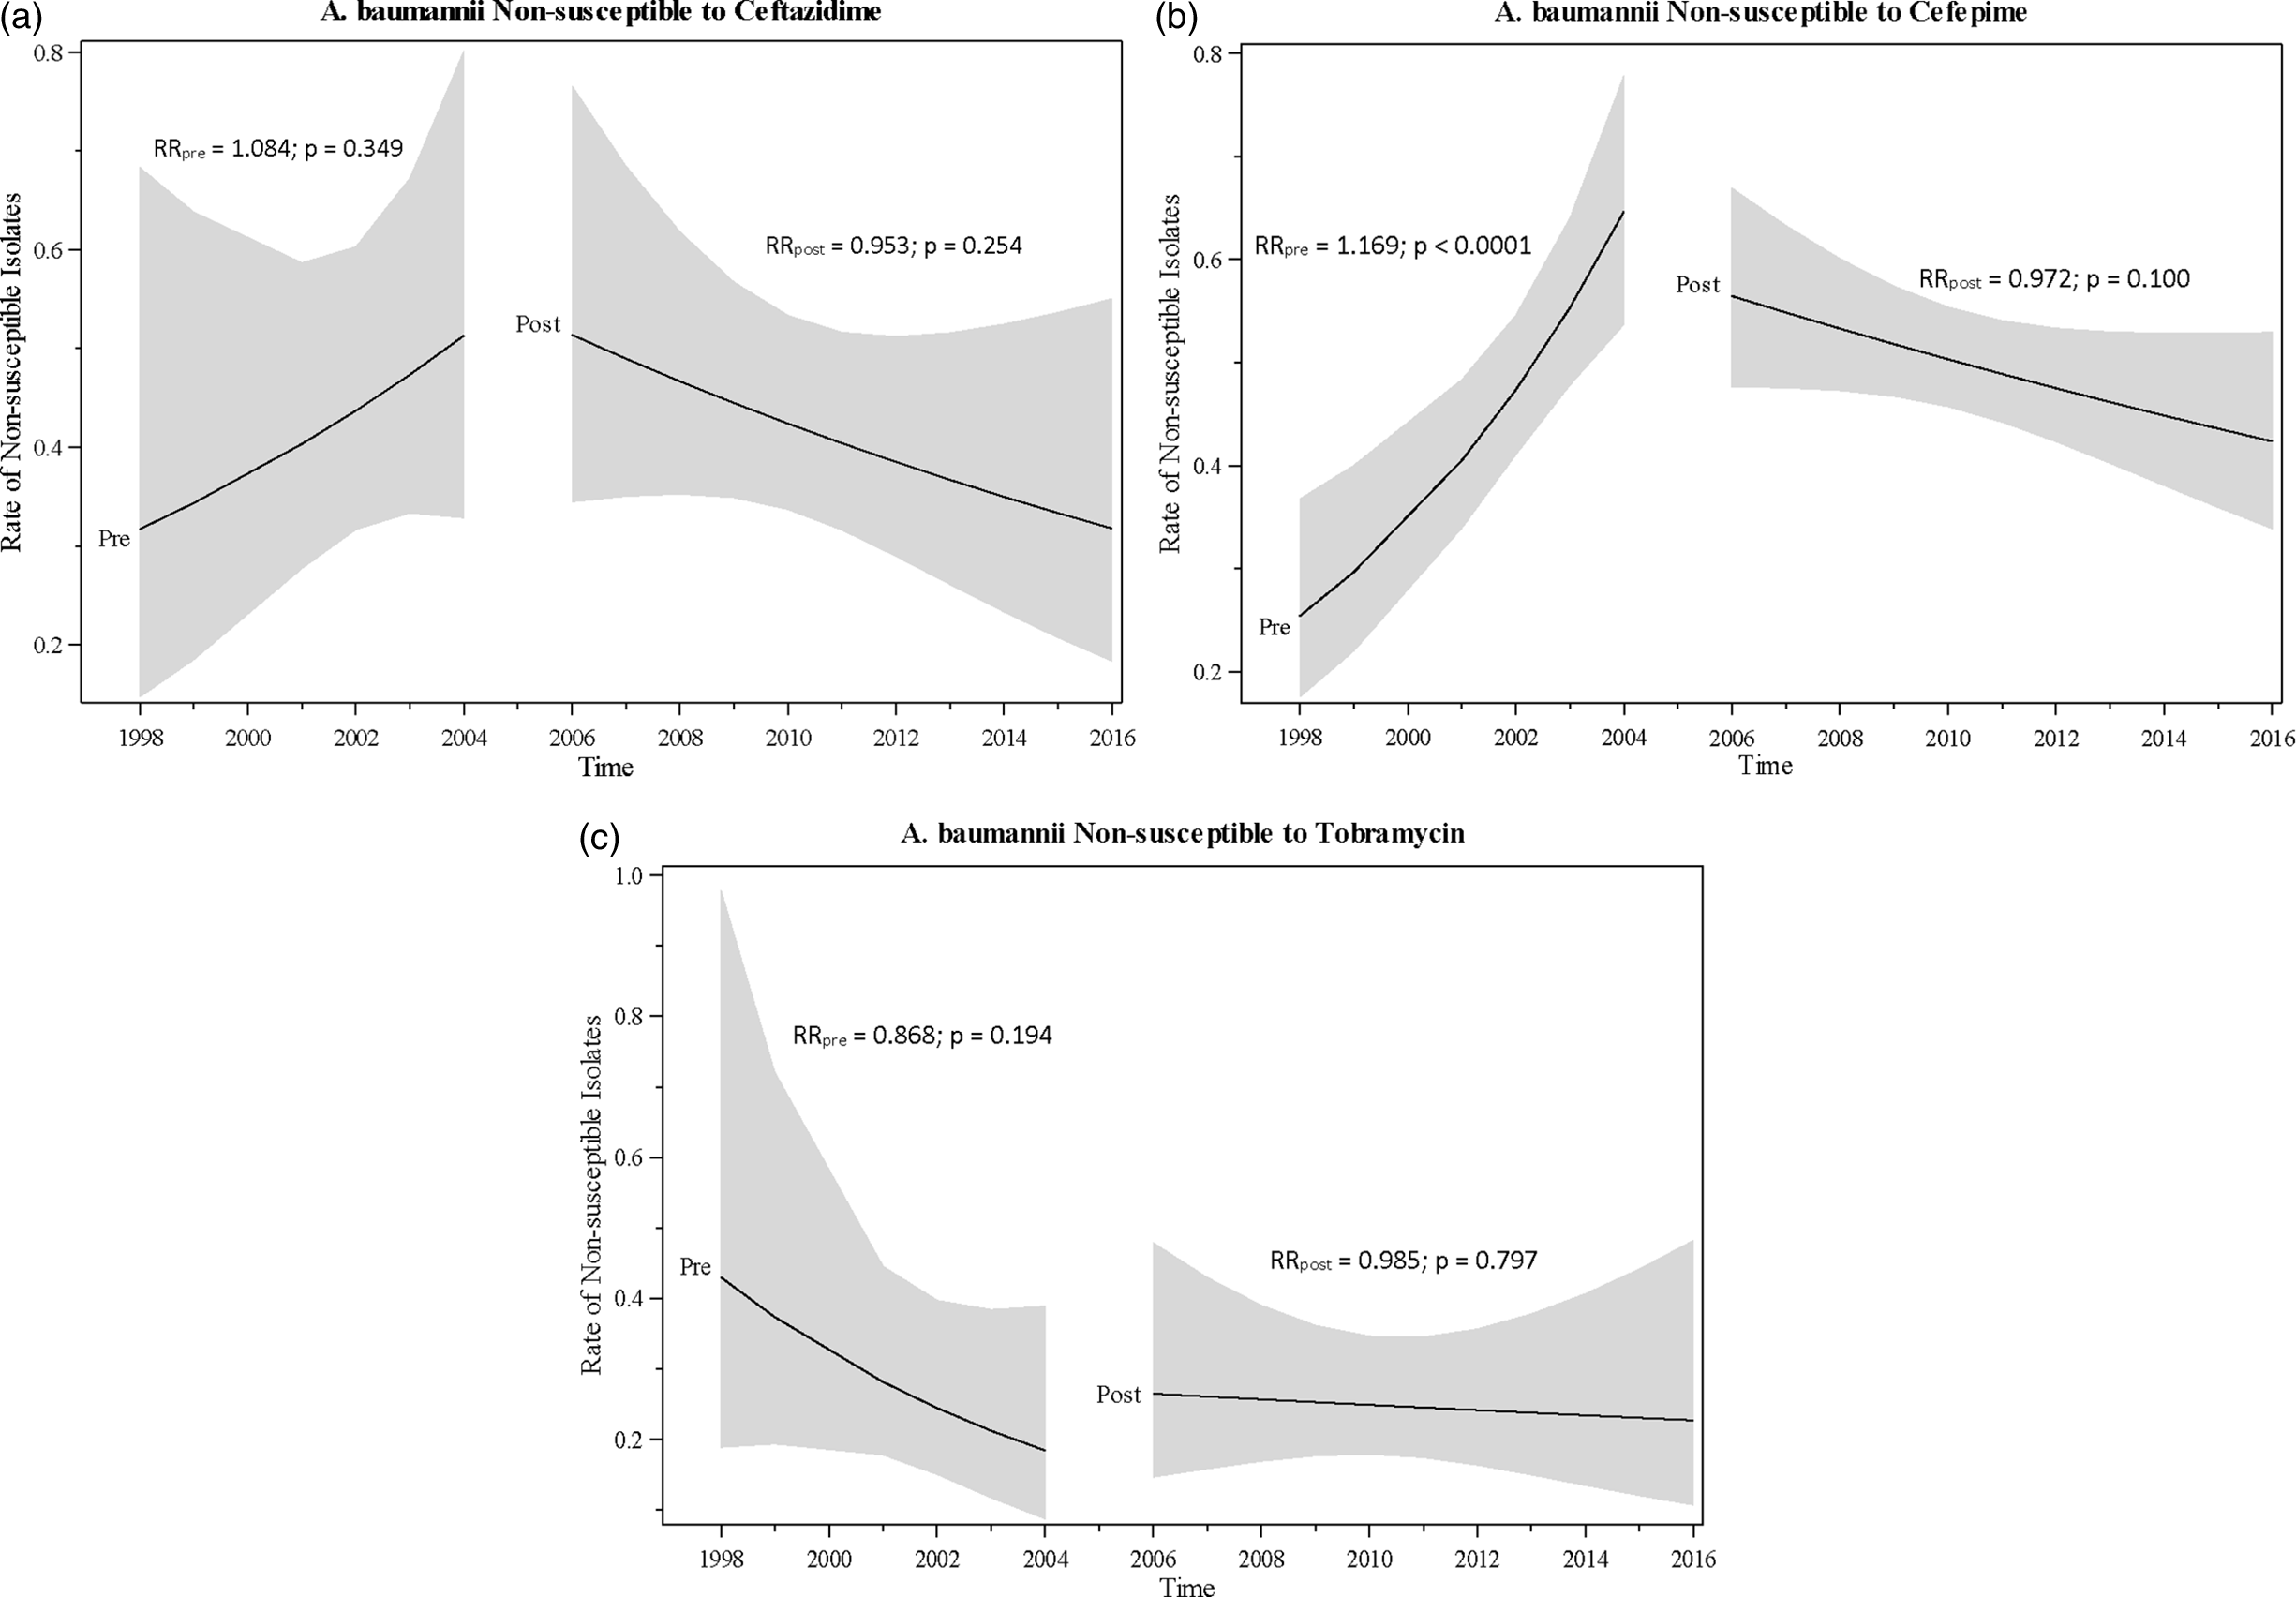
Cefepime NSI rates were increasing before fluoroquinolone preauthorization was implemented (RR, 1.169; 95% CI, 1.081–1.263; P < .0001) (Figure 4 and Table 2). There was a pre–post level change in the rates of NSI immediately after fluoroquinolone preauthorization began (RR, 3.367; 95% CI, 1.780–6.370; P = .0002). Also, there was a pre–post change in the direction of trends of NSIs (RR, 0.831; 95% CI, 0.764–0.905; P < .0001), with the rates stabilizing or appearing to decline after fluoroquinolone preauthorization was implemented (RR, 0.972; 95% CI, 0.939–1.006; P = .100). There were no statistically significant trends before or after fluoroquinolone preauthorization was implemented for ceftazidime and tobramycin.
Trends in annual rates of Acinetobacter baumannii isolates nonsusceptible to specific antibiotics (1998–2016): (a) ceftazidime, (b) cefepime, (c) piperacillin-tazobactam, and (d) tobramycin. Plots represent estimated annual rates of nonsusceptible isolate before (1998–2004) and after (2006–2016) fluoroquinolone preauthorization was implemented, respectively. Fluoroquinolone preauthorization began in October 2005; antibiotic use data for 2005 were excluded to better capture the impacts during the pre- (1998–2004) versus post- (2006–2016) implementation periods. The shaded region represents the 95% confidence interval of rate. Rate: estimate of nonsusceptible isolates from Poisson regression divided by the total number of isolates (susceptible + nonsusceptible isolates) for a specific year. Note. RRpre, rate ratio before fluoroquinolone preauthorization was implemented; RRpost, rate ratio after fluoroquinolone preauthorization was implemented.

Escherichia coli
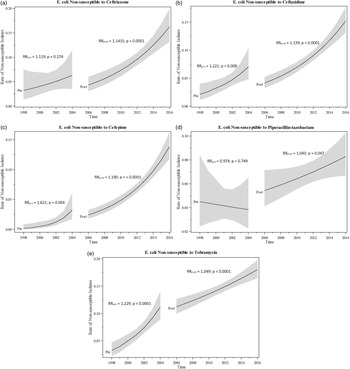
The rates of ceftazidime NSIs, cefepime NSIs, and tobramycin NSIs were all increasing before fluoroquinolone preauthorization was implemented (ceftazidime RR, 1.221; 95% CI, 1.054–1.413; P = .008; cefepime RR, 1.621; 95% CI, 1.171–2.245; P = .004; tobramycin RR, 1.229; 95% CI, 1.127–1.340; P < .0001) (Figure 5 and Table 2). After fluoroquinolone preauthorization was implemented, however, the rates were still increasing, but the strengths of increase were lower compared to the period before fluoroquinolone preauthorization was implemented (ceftazidime RR, 1.139; 95% CI, 1.102–1.177; P < .0001; cefepime RR, 1.190; 95% CI, 1.145–1.236; P < .0001; tobramycin RR, 1.049; 95% CI, 1.020–1.068; P < .0001). The rates of ceftriaxone NSIs and piperacillin-tazobactam NSIs also increased after fluoroquinolone preauthorization was implemented (ceftriaxone RR, 1.142; 95% CI, 1.090–1.195; P < .0001 and piperacillin-tazobactam RR, 1.043; 95% CI, 1.001–1.088; P = .047).
Trends in annual rates of Escherichia coli isolates nonsusceptible to specific antibiotics (1998–2016): (a) ceftriaxone, (b) ceftazidime, (c) cefepime, (d) piperacillin-tazobactam, and (e) tobramycin. Plots represent estimated annual rates of nonsusceptible isolates before (1998–2004) and after (2006–2016) fluoroquinolone preauthorization was implemented, respectively. Fluoroquinolone preauthorization began in October 2005; antibiotic use data for 2005 was excluded to better capture the impacts during the pre- (1998–2004) versus post- (2006–2016) implementation periods. The shaded region represents the 95% confidence interval of rate. Rate: estimate of nonsusceptible isolates from Poisson regression divided by the total number of isolates (susceptible + nonsusceptible isolates) for a specific year. Note. RRpre, rate ratio before fluoroquinolone preauthorization was implemented; RRpost, rate ratio after fluoroquinolone preauthorization was implemented.

Klebsiella pneumoniae, P. mirabilis, and S. marcescens, data for isolates
Results for these bacteria and the table of raw data for all bacteria are provided in the Supplementary Material (online).
Discussion
We examined how fluoroquinolone preauthorization affected the use of third- and fourth-generation cephalosporins and the emergence of ceftriaxone, ceftazidime, and cefepime NSIs of clinically important Gram-negative bacteria in an inpatient setting. Our findings illustrate an overall increase in the estimated use of ceftriaxone and cefepime and a continued decrease in ceftazidime use after the implementation of fluoroquinolone preauthorization. After fluoroquinolone preauthorization began, rates of ceftazidime NSIs and cefepime NSIs of P. aeruginosa declined; rates of ceftazidime NSIs and cefepime NSIs of E. cloacae and cefepime NSIs of A. baumannii changed from trending upward before fluoroquinolone preauthorization to remaining stable afterward. These findings suggest a possible beneficial impact of fluoroquinolone preauthorization in controlling bacterial resistance to nonfluoroquinolone antibiotics in select Gram-negative bacteria.
Kreitmeyr et al Reference Kreitmeyr, von Both, Pecar, Borde, Mikolajczyk and Huebner15 found a 15% increase in the use of penicillins following an antimicrobial stewardship intervention to lower the use of fluoroquinolones and second- and third-generation cephalosporins. Also, Falagas et al Reference Falagas, Bliziotis and Michalopoulos16 showed that policy restrictions in the use of multiple classes of antibiotics including fluoroquinolones, third- and fourth-generation cephalosporins, carbapenems, etc, led to a considerable increase in the use of unrestricted antibiotics. Reference Falagas, Bliziotis and Michalopoulos16,Reference Schuts, Boyd, Muller, Mouton and Prins17
Overall, third- and fourth-generation cephalosporin use was low or decreasing before fluoroquinolone preauthorization was implemented. The use of ceftriaxone was decreasing; ceftazidime use was decreasing; and cefepime use was very low. Therefore, we expected that P. aeruginosa, E. cloacae, and A. baumannii isolates, which are largely hospital-acquired bacteria, would have low rates of resistance to ceftazidime and cefepime. Conversely, resistance rates among these bacteria to ceftazidime and cefepime increased before fluoroquinolone preauthorization was implemented, especially in E. cloacae, despite relatively low use of these agents during this period. This increase in resistance may be the result of fluoroquinolone overuse before fluoroquinolone preauthorization was implemented. After fluoroquinolone preauthorization was implemented, the use of ceftriaxone and cefepime increased and there was a momentous and sustained decrease in resistance to ceftazidime and cefepime. For piperacillin-tazobactam and tobramycin, we probably observed increasing resistance with P. aeruginosa and E. cloacae before fluoroquinolone preauthorization was implemented, as expected, because of increasing use of both antibiotics. Again, and as expected, there was a decline in P. aeruginosa and E. cloacae resistance to tobramycin after fluoroquinolone preauthorization was implemented, which may be attributed to its decreased use at that time, but were not ruling out the potential additive effect of reduced fluoroquinolone use. Comparing results of ceftazidime and cefepime with tobramycin with respect to antibiotics use and P. aeruginosa and E. cloacae resistance, there was little or no similarity in expected patterns of resistance. Also, with the increasing use of piperacillin-tazobactam after fluoroquinolone preauthorization was implemented, P. aeruginosa resistance to this agent trended upward (though with marginal significance), but E. cloacae resistance to piperacillin-tazobactam steadily declined. The decline in E. cloacae resistance could be due to reduced fluoroquinolone use after fluoroquinolone preauthorization was implemented.
Ceftazidime, cefepime, and tobramycin all showed similar patterns of increasing E. coli resistance before fluoroquinolone preauthorization was implemented and increasing resistance with reduced strength afterward. The impact of fluoroquinolone preauthorization on the resistance of E. coli and K. pneumonia in our study may be distorted by the potential presence E. coli isolates from the community in our samples. Extended-spectrum β-lactamase (ESBL)–producing Enterobacterales, like E. coli and K. pneumoniae, have been shown to carry transmission potentials for community and healthcare settings. Reference Hilty, Betsch and Bögli-Stuber18,Reference Doi, Park and Rivera19 Although a previous study by Sarma et al Reference Sarma, Marshall, Cleeve, Tate, Oswald and Woolfrey20 demonstrated improved susceptibility in both community and hospital isolates of ciprofloxacin-resistant ESBL-producing urinary E. coli after instituting fluoroquinolone restriction, we urge caution in interpreting the results of our isolates in this case. Reference Sarma, Marshall, Cleeve, Tate, Oswald and Woolfrey20 Also, bias from community isolates may explain why there were no significant trends in K. pneumoniae resistance before or after fluoroquinolone preauthorization was implemented. It is hard to assess the impact of fluoroquinolone preauthorization on P. mirabilis resistance to ceftriaxone, ceftazidime, and cefepime because of limited statistical information on resistance pattern before and after fluoroquinolone preauthorization was implemented. Increasing resistance of S. marcescens resistance against ceftazidime after fluoroquinolone preauthorization was implemented may suggest a potential nonbeneficial impact of fluoroquinolone preauthorization in this bacteria–antibiotic combination.
Possibly, bacterial exposure to a specific antibiotic or antibiotic group could result in the selection of bacteria strains with resistance to multiple antibiotics, even from other groups. Apart from resistance by protective chromosomal mutations on fluoroquinolone targets (eg, DNA gyrase and topoisomerase) in resistant bacteria, resistance to fluoroquinolones through energy-dependent efflux pumps have been documented. Reference Poole21–Reference Santajit and Indrawattana23 These efflux pumps can have broad specificity covering different antibiotics and offering horizontal and vertical transfer of genetic material (including in the gut microbiota), conferring antibiotic resistance. Reference Poole21,Reference Santajit and Indrawattana23–Reference van Schaik30 These findings may explain why a reduction in the use of fluoroquinolones implemented in the hospital resulted in reduced select Gram-negative bacteria resistance to third- and fourth-generation cephalosporins. When the use of the main antibiotic constituting the exposure is reduced, there could be less pressure for the selection of multidrug-resistant variants, which could improve the resistance of pathogenic bacteria to not only the antibiotic that was restricted but also those that the bacteria are still exposed to. Because the antimicrobial stewardship strategy in the current study removed levofloxacin and gatifloxacin from the formulary and required preauthorization for ciprofloxacin and moxifloxacin, one or more of these agents may have been more likely to drive multidrug resistance. The improvement in bacterial resistance we observed in our study is similar to the findings of White et al, Reference White, Atmar, Wilson, Cate, Stager and Greenberg31 who examined the impact of a preauthorization intervention restricting different antibiotics in different classes.
In our study, antibiotic use and bacterial resistance data were not designed for research purpose; therefore, they did not include patient-level information. However, the pragmatic nature of this study reflects a real-world scenario when compared with a controlled setting in observational studies. We also did not consider the adherence to fluoroquinolone preauthorization and infection control measures. Because the data were retrospectively collected, like most other retrospective studies spanning long periods, recall bias was inevitable. However, to our knowledge, there were no restrictions in the use of cephalosporins during this period. The CLSI revision of ESBL break points in 2005 may affect the results of resistance for the Enterobacterales in our study. Reference Humphries, Abbott and Hindler32 To control for this, we included antibiotics that are less affected by ESBL (eg, piperacillin-tazobactam and tobramycin) for comparison. We observed similar patterns in E. cloacae and E. coli resistance to third- and fourth-generation cephalosporins, piperacillin-tazobactam, and tobramycin after fluoroquinolone preauthorization was implemented, making the CLSI revision of little or no impact on the results. Lastly, hospital isolates that are tested in our laboratory are from inpatient and the emergency department; thus, the hospital fluoroquinolone preauthorization restriction may not reflect all the changes noted in resistance, especially with E. coli and K. pneumoniae isolates, which are capable of community transmission. In the future, it will be important to explore patient-level epidemiology of fluoroquinolone preauthorization, unrestricted antibiotic use, and bacterial resistance in HAIs.
This study adds to the body of literature showing the beneficial impacts of antimicrobial stewardship. Fluoroquinolone preauthorization in the hospital, as an antimicrobial stewardship strategy, may contribute to increased use of unrestricted third- and fourth-generation cephalosporins; however, we did not observe increased antimicrobial resistance to these agents, especially among clinically important Gram-negative bacteria known for hospital-acquired infections.
Supplementary material
To view supplementary material for this article, please visit https://doi.org/10.1017/ice.2021.229
Acknowledgments
We thank the pharmacy department, pathology department, and infectious disease division of the UAB Hospital and School of Medicine for the generous provision of the data used for this study. We also appreciate members of Dr. Shrestha Infectious Disease Research Group who contributed to the review of this project.
Financial support
This project was supported by Dr Shrestha’s Quetelet Endowed Professorship Research Fund.
Conflicts of interest
The authors have no conflicts of interest to declare.