Introduction
Several connectivity models have led to an increasing interest in brain white matter (WM) structure in schizophrenia (Konrad & Winterer, Reference Konrad and Winterer2008). Studies of WM in subjects at ‘ultra high risk’ (UHR) for psychosis have nevertheless been scarce. UHR subjects are help-seeking patients with: (1) attenuated positive psychotic symptoms; (2) genetic risk for schizophrenia plus a recent decrease in functioning; (3) psychotic symptoms that spontaneously fade within 1 week (Miller et al. Reference Miller, McGlashan, Rosen, Cadenhead, Cannon, Ventura, McFarlane, Perkins, Pearlson and Woods2003). At present there are no proven clinical interventions for this putative pre-psychotic or prodromal group of patients (de Koning et al. Reference de Koning, Bloemen, van Amelsvoort, Becker, Nieman, van der Gaag and Linszen2009). The UHR diagnosis is associated with a 40% chance of developing psychosis within 12 months (Yung et al. Reference Yung, Phillips, Yuen, Francey, McFarlane, Hallgren and McGorry2003), although recent literature suggests lower transition rates (Olsen & Rosenbaum, Reference Olsen and Rosenbaum2006).
Diffusion tensor magnetic resonance imaging (DT-MRI) is a brain imaging technique that has been widely used to study WM in chronic and in first episode schizophrenia (Basser et al. Reference Basser, Mattiello and LeBihan1994). DT-MRI can be used to investigate orientation and integrity of WM tracts. This is achieved by measuring the amount and direction of water diffusion, which can be isotropic (the same amount in every direction) or anisotropic. Diffusion of water molecules in WM tends to be greater along the direction of WM tracts and thus predominantly anisotropic, with the degree of anisotropy in particular tissues often being quantified through its fractional anisotropy (FA) value. The degree of anisotropy depends on a number of factors, for instance, myelination, fibre diameter and density. It is thought that a lower FA is indicative of lower connectivity or integrity of WM tracts (Basser, Reference Basser1995; Pierpaoli & Basser, Reference Pierpaoli and Basser1996; Beaulieu, Reference Beaulieu2002).
Studies have reported significantly lower FA of widespread brain regions in patients with chronic schizophrenia (Konrad & Winterer, Reference Konrad and Winterer2008). Furthermore, first episode patients were also reported to have significant localized FA reductions, but to a lesser extent than chronic patients (Friedman et al. Reference Friedman, Tang, Carpenter, Buchsbaum, Schmeidler, Flanagan, Golembo, Kanellopoulou, Ng, Hof, Harvey, Tsopelas, Stewart and Davis2008). Recently, there have been reports of WM abnormalities in genetic and clinical high-risk samples although structural changes have not been consistent across studies. For instance, Walterfang and colleagues reported corpus callosal shape alterations in UHR subjects and larger frontal WM volumes in UHR subjects who later developed psychosis (Walterfang et al. Reference Walterfang, McGuire, Yung, Phillips, Velakoulis, Wood, Suckling, Bullmore, Brewer, Soulsby, Desmond, McGorry and Pantelis2008a, Reference Walterfang, Yung, Wood, Reutens, Phillips, Wood, Chen, Velakoulis, McGorry and Pantelisb) and our group reported preliminary evidence for frontal FA decreases (Peters et al. Reference Peters, Schmitz, Dingemans, van Amelsvoort, Linszen, de Haan, Majoie and den Heeten2009). In genetic high-risk subjects a decrease in FA of the anterior limb of the internal capsule was reported (Muñoz Maniega et al. Reference Muñoz Maniega, Lymer, Bastin, Marjoram, Job, Moorhead, Owens, Johnstone, McIntosh and Lawrie2008) and others reported reduced FA of WM in the left inferior frontal gyrus, left posterior cingulate and angular gyrus and increased FA of WM in the left subgenual anterior cingulate, bilateral pontine tegmentum and right middle/superior frontal lobes (Hoptman et al. Reference Hoptman, Nierenberg, Bertisch, Catalano, Ardekani, Branch and Delisi2008). Some WM abnormalities appear to progress after transition into schizophrenia (Witthaus et al. Reference Witthaus, Brune, Kaufmann, Bohner, Ozgurdal, Gudlowski, Heinz, Klingebiel and Juckel2008) and the length of the prodromal period may correlate positively with the extent of WM density differences (Lappin et al. Reference Lappin, Dazzan, Morgan, Morgan, Chitnis, Suckling, Fearon, Jones, Leff, Murray and McGuire2007).
Thus, schizophrenia patients have differences in WM structure that may already be apparent in the prodromal stage and that may increase with the progression of the disease to its chronic stage. No one has yet investigated whole brain WM integrity differences in UHR subjects who develop psychosis. Hence, we investigated a prospective cohort of UHR subjects and compared FA maps between those who later developed psychosis (UHR-P), those who did not (UHR-NP) and a non-psychiatric control group. We hypothesized that UHR-P subjects would show differences in FA compared with UHR-NP and control subjects and that FA would correlate to clinical symptom severity at baseline.
Method
UHR subjects were recruited through our clinical research programme in early psychosis. They were referred to this programme when psychotic symptoms or an increased risk for developing psychosis were suspected. Subjects were eligible to participate if they were aged between 16 and 35 years and fulfilled UHR criteria [Structured Interview for Prodromal Syndromes (SIPS; Miller et al. Reference Miller, McGlashan, Rosen, Cadenhead, Cannon, Ventura, McFarlane, Perkins, Pearlson and Woods2003)]. Exclusion criteria were a previous psychotic episode for more than 1 week, (mild) psychotic symptoms due to an organic aetiological factor and IQ <85. At 9, 18 and 24 months follow-up, subjects were assessed for potential transition to psychosis. Control subjects were recruited through local advertisement. Subjects were eligible to participate if they were aged between 16 and 35 years, had IQ >85 and no previous or current psychiatric diagnosis. This study was approved by local and national medical ethics committees and all participants of the study gave written informed consent.
Clinical measures
All subjects were assessed for UHR status by a psychiatrist and research psychologist as described previously (Peters et al. Reference Peters, de Haan, Dekker, Blaas, Becker, Dingemans, Akkerman, Majoie, van Amelsvoort, den Heeten and Linszen2008). Subjects were categorized as UHR after SIPS assessment when having: (1) attenuated psychotic symptoms (e.g. odd beliefs, paranoid ideation); (2) brief psychotic moments with spontaneous remission in less than 1 week; and/or (3) a decline in functioning in the past year (30% reduction in global assessment of functioning scale) plus a genetic risk (first degree relative with schizophrenia-like disorder or a schizo-typal personality disorder) (Miller et al. Reference Miller, McGlashan, Rosen, Cadenhead, Cannon, Ventura, McFarlane, Perkins, Pearlson and Woods2003).
Positive, negative and general symptom severity was measured with the Positive and Negative Syndrome Scale (PANSS; Kay et al. Reference Kay, Fiszbein and Opler1987). Diagnosis of psychosis or other major psychiatric disorders was established with the Structured Clinical Interview for Diagnosis (SCID), sections B and C (Spitzer et al. Reference Spitzer, Williams, Gibbon and First1992).
Drug and alcohol abuse was assessed with the Comprehensive International Diagnostic Interview, sections J and L (WHO, 1993). Overall intellectual ability (IQ) was estimated for all subjects with the Dutch version of the National Adult Reading Test (Schmand et al. Reference Schmand, Bakker, Saan and Louman1991).
Magnetic resonance acquisition
All participants were scanned with a clinical 3-T Magnetic Resonance Imaging system (Achieva; Philips Medical System, The Netherlands). For each individual, all images were acquired in the same session. Prior to the neuroimaging investigation participants were made familiar with the scanner and the scanning procedures.
Structural 3D T1-weighted high resolution, gradient echo images were acquired [repetition time (TR)/echo time (TE) of 9.8/4.6 ms; axial orientation; 120 continuous (no inter-slice gap) slices; slice thickness 1.2 mm; flip angle 8°; 224 mm field of view (FOV); acquisition matrix 256×256; acquisition voxel size 1.20×0.8×0.8 mm] to identify grey matter (GM), WM and cerebral spinal fluid (CSF).
Diffusion tensor imaging data were acquired using 3D multi-slice spin echo single shot echo-planar imaging with: TR/TE: 8872/51 diffusion sensitivities of b=0 and b=1000 s/mm2; six orthogonal diffusion gradients (YZ, XY, XZ, Y-Z, X-Y and X-Z); 48 continuous (no inter-slice gap) slices, slice thickness 3 mm, 224 mm FOV; acquisition matrix 112×112; acquisition voxel size 2×2×3 mm. The DT-MRI data were post processed using Philips Achieva software to create FA value maps.
Quantitative neuroimaging analysis
All data were processed using SPM2 (Wellcome Department of Cognitive Neurology, UK) modified for optimized voxel-based morphometry (VBM) on a Matlab platform (version 7.4; The MathWorks Inc., USA). All images were pre-processed and checked for artefacts and image corruption before entering statistical analysis.
Processing of T1 and DT-MRI data
We used optimized VBM implemented in SPM2 to identify regional FA differences of UHR-P compared with UHR-NP and control subjects and to identify regional differences in WM concentration (density) of UHR-P compared with UHR-NP subjects. Optimized VBM techniques, including customized template creation, spatial normalization, tissue segmentation and smoothing were employed (Ashburner & Friston, Reference Ashburner and Friston2000, Reference Ashburner and Friston2001). A participant-based B0-template was created using all original B0 images of the complete sample. Next to the customized B0-template, prior images of GM, WM and CSF were generated based on the existing [Montreal Neurological Institute (MNI)] T1-weighted template in SPM2 and smoothed with a Gaussian kernel of 8-mm full width at half-maximum (FWHM). Thereafter, automated optimizations in SPM2 (Department of Psychiatry, University of Jena, Germany) were used to spatially normalize all B0 images, based on the customized T1-weighted template. The prior images of WM were used for segmentation and stripping. All standard presets in SPM2 were maintained. The FA images were co-registered (write normalized) to the spatially normalized B0 image of the corresponding subject. The degree of smoothing to apply is still a subject of much discussion as different smoothing levels result in varying results (Jones et al. Reference Jones, Symms, Cercignani and Howard2005) and the only rule of thumb is that the FWHM must be two to three times the voxel dimension. In the absence of a specific hypothesis about the spatial extent of any abnormalities, we applied a 10-mm FWHM smoothing filter, as this is commonly used and yields robust results in neuroimaging literature, to render the data more normally distributed to achieve optimal outcome in parametric statistical comparisons and further to aid between-subject anatomical matching and improve the signal:noise ratio.
Statistics
SPSS (SPSS 16.02 for Windows; SPSS Inc., USA) was used for statistical analysis. Group differences in age and IQ were examined using independent-sample t tests (two tailed). Group differences in gender, handedness, antipsychotic medication and cannabis use were tested with χ2 tests. Level of statistical significance was defined as p<0.05 (two tailed).
DT-MRI
Regional FA differences between UHR-P and controls and between UHR-P and UHR-NP were assessed using t statistics implemented in the general linear model approach of SPM2, using contrast between 1 and −1: analysis of variance (ANOVA) was carried out, investigating group differences on a voxel-by-voxel basis for FA value maps. Two-way ANOVA (t tests) for group comparisons were thresholded in a successive order: (i) at p<0.001, uncorrected for multiple comparisons with height threshold (t) at Z=4.02 at voxel level, with a minimal cluster size (cluster extend threshold at p<0.001) of 50 voxels; then, (ii) individual significant clusters [p<0.05 (at cluster level, Pc)]; and (iii) false discovery rate (FDR) and family wise error (FWE) corrections of multiple voxel comparisons were applied to the data, where possible. For results (since apparent only in the WM segments) coordinates are given as an indication of the voxel location in a standardized brain. Additionally, resulting voxels and cluster maps of FA images were overlaid for visualization. To further localize significant voxel clusters, up-to-date atlases were consulted (Talairach & Tournoux, Reference Talairach and Tournoux1988; Mori et al. Reference Mori, Wakana, Nagae-Poetscher and van Zijl2005).
Structural data
ANOVA were carried out, investigating group differences on a voxel-by-voxel basis for GM, WM, CSF segments. Statistical comparisons were implemented in the general linear model approach of SPM2. We used ANOVA to calculate regional WM differences between 10 UHR-P and 27 UHR-NP subjects. To prevent type 1 and type 2 errors, we corrected our data for multiple comparisons. This procedure was done in a successive order: (i) at p<0.001, uncorrected for multiple comparisons with height threshold (t) at Z=3.10 at voxel level, with a minimal cluster size (cluster extend threshold at p<0.001) of 50 voxels; then, (ii) individual significant clusters were corrected for multiple comparisons [p<0.05 (at cluster level, Pc)]; and, where possible, (iii) FDR and FWE corrections of multiple voxel comparisons were applied to the data. Data not surviving correction for multiple comparisons (at a cluster level) are to be considered as preliminary findings. Voxels and clusters were localized using the MNI space and transformed into Talairach and Tournoux coordinates (TT) (Talairach & Tournoux, Reference Talairach and Tournoux1988; Mori et al. Reference Mori, Wakana, Nagae-Poetscher and van Zijl2005). For results in WM segments, coordinates are given as an indication of the voxel location in a standardized brain. To further localize significant voxel clusters and tracts, up-to-date atlases were consulted (Talairach & Tournoux, Reference Talairach and Tournoux1988; Mori et al. Reference Mori, Wakana, Nagae-Poetscher and van Zijl2005).
We then carried out a preliminary (post-hoc) analysis, in which we correlated FA values of the UHR-P group and the total UHR group to clinical symptom severity at baseline as measured by the sum of the positive PANSS items. Correlation was done with SPM, using ‘simple regression’ algorithm with the PANSS scores as a regressor.
Results
Demographics
We recruited 10 control subjects and 37 UHR subjects. After follow-up, 10 UHR subjects developed psychosis and 27 did not. The UHR-P and UHR-NP groups did not differ significantly in age, IQ, gender, handedness, medication use or cannabis use. Two UHR-NP subjects had used amphetamines within 1 month prior to the study. No other illicit drugs were used within 1 month prior to the study.
UHR-P and controls did not differ significantly in age, gender, IQ, handedness or cannabis use (Table 1).
Subject characteristics

UHR-P, Ultra-high-risk subjects who developed psychosis; UHR-NP, ultra-high-risk subjects who did not develop psychosis; PANSS, Positive and Negative Syndrome Scale.
a Dutch Adult Reading Test IQ estimate.
b Right/Left/Ambivalent/Unknown.
c Within 3 months before magnetic resonance imaging scanning.
d Estimated chloorpromazine equivalents (Woods, Reference Woods2003). Of one UHR-NP subject no dose was available.
e Medication: SSRI/TCA/unknown.
f Cannabis use ever/last month.
* Significant difference.
Of the UHR-NP group, five subjects were lost to follow-up before 18 months but had not developed psychosis at the time of the last contact. Of the remaining UHR-NP subjects, 20 had completed the full 24 months follow-up and two had completed 18 months follow-up.
The mean transition time to psychosis in the UHR-P group was 16 months, median was 14 (range 6–37) months.
Imaging results/DT-MRI voxel-based analysis
UHR-P subjects had significantly lower FA than control subjects of WM in left (p<0.0001 FWE and FDR-corrected at voxel level, Z=5.81, cluster size 11065, TT: −14, 42, 43) and right (p<0.0001 FDR-corrected at voxel level, Z=4.43, cluster size 2022, TT: 16, 26, 49) superior frontal lobes (Fig. 1).
Ultra-high-risk subjects with psychosis (UHR-P) versus non-psychiatric controls. Significant clusters of lower fractional anisotropy in UHR-P are yellow/red.

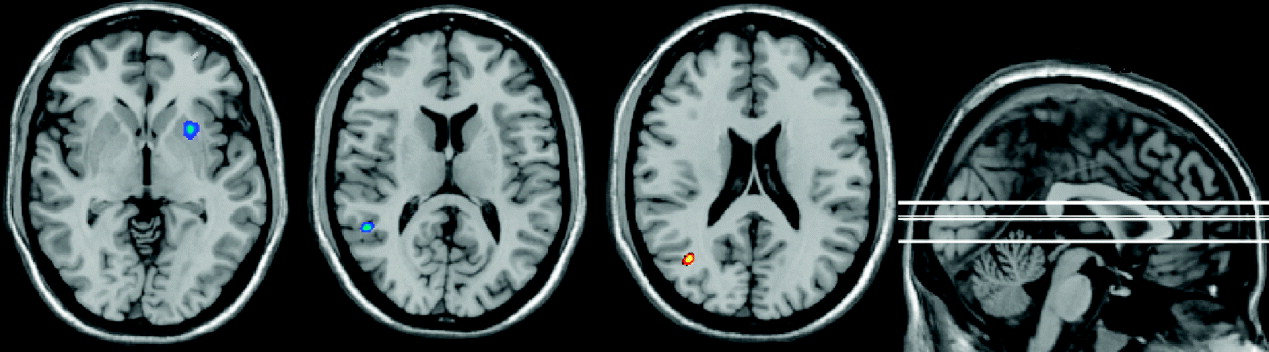
UHR-P subjects had a significantly lower FA than UHR-NP subjects of WM lateral to the right putamen (p<0.0001 corrected at cluster level, Z=3.40, cluster size 572, TT: 24, 12, −4) and the left superior temporal lobe (p<0.0001 corrected at cluster level, Z=3.23, cluster size 152, TT: −52, −48, 12). Also, UHR-P subjects had a corresponding decrease in WM density lateral to the right putamen (p<0.001, uncorrected, Z=2.72, TT: 24, 13, −3), although this density result did not survive correction for multiple comparisons. No other areas differed significantly in WM density.
UHR-P subjects had higher FA than UHR-NP subjects of left medial temporal lobe WM (p<0.0001 corrected at cluster level, Z=3.78, cluster size=370 TT: −39, −64, 20). The corresponding brain regions in these areas are depicted in Fig. 2.
Ultra-high-risk subjects with psychosis (UHR-P) versus ultra-high-risk subjects without psychosis. Significant clusters: blue depicts lower fractional anisotropy (FA); red depicts higher FA in UHR-P subjects. (Although clusters may appear to touch grey matter, they are in white matter only and have been depicted on a SPM T1 template image to aid rough visual reference.)

Additionally, in the UHR-P group, we found a significant relationship between reduced FA and more severe positive symptoms (PANSS) in the left middle temporal lobe (p<0.0001 corrected at cluster level, Z=3.72, cluster size 123, TT: −36, 12, −36).
In the total UHR group (UHR-P+UHR-NP), we found a significant relationship between reduced FA and more severe positive symptoms (PANSS) in the right superior temporal WM (p<0.0001 corrected at cluster level, Z=3.10, cluster size 439, TT: 50, −55, 14).
Discussion
This study is the first comparison of whole brain WM integrity between UHR subjects who develop psychosis and those who do not. Areas where UHR-P differed from the healthy control group were located in the frontal lobe WM, particularly in the left hemisphere, containing the anterior thalamic radiation and the inferior fronto-occipital fasciculus (IFO). Our voxel-based whole brain methodology does not allow for the identification of fibre tracts and so the implication of these tracts remains tentative. This is in line with a recent meta-analysis that reported that reduced frontal (and temporal) FA is one of the most consistent DT-MRI findings in schizophrenia (Ellison-Wright & Bullmore, Reference Ellison-Wright and Bullmore2009). Areas that differed between UHR-P and UHR-NP included WM lateral of the right putamen, containing the uncinate fasciculus, the IFO and the superior longitudinal fasciculus (SLF). There is consensus that the striatum is important in schizophrenia, due to its extensive dopaminergic input, the fact that its dopamine D2 receptors are the target of most antipsychotic drugs and the role of the striatum in cognitive, sensory and motor processing (Shenton et al. Reference Shenton, Dickey, Frumin and McCarley2001). UHR subjects have been reported to have increased dopamine function in the striatum (Howes et al. Reference Howes, Montgomery, Asselin, Murray, Valli, Tabraham, Bramon-Bosch, Valmaggia, Johns, Broome, McGuire and Grasby2009). Furthermore, there is evidence for an association between size of the striatum and executive function in schizophrenia (Antonova et al. Reference Antonova, Sharma, Morris and Kumari2004). Our findings suggest that WM abnormalities in striatal brain regions may play a role in the development of psychosis in UHR subjects.
In addition, we found that UHR-P subjects had significantly lower FA in the left superior temporal lobe than UHR-NP subjects, including the SLF, IFO and inferior longitudinal fasciculus (ILF). The left superior temporal lobe WM might therefore have a role in the development of schizophrenia. Witthaus and colleagues reported decreased WM volume in the right superior temporal lobe in UHR subjects compared with healthy controls (Witthaus et al. Reference Witthaus, Brune, Kaufmann, Bohner, Ozgurdal, Gudlowski, Heinz, Klingebiel and Juckel2008) and schizophrenia has been consistently associated with left temporal GM and WM abnormalities (Konrad & Winterer, Reference Konrad and Winterer2008; Ellison-Wright & Bullmore, Reference Ellison-Wright and Bullmore2009). Again, our temporal findings seem specific to the selected subcategories of UHR subjects, indicating a difference between transition and non-transition. Hence, lower integrity of WM in the superior temporal lobe might increase the vulnerability for the development of frank psychosis in at-risk subjects.
UHR-P subjects had higher FA than UHR-NP in the left medial temporal lobe, in WM containing the posterior thalamic radiation, IFO and ILF. A finding of higher FA in pathological studies is unusual. Reduced FA may be caused by decreases in myelination and putatively reflects a decrease in connectivity. A higher FA may be caused by, for instance, increased neuronal density (Beaulieu, Reference Beaulieu2002) and thus may reflect heightened connectivity. Our WM density analysis did not provide support for this hypothesis. Conversely, an increase in FA may also reflect tissue loss. It can arise when a region in the control group has a low FA due to crossing fibres and when loss of one of these fibre populations in the patient group causes an increase in FA. Interpretation of our result of higher FA in the UHR-P group is difficult. The result may be an artefact, but since we used a corrected conservative analysis, and the voxels are not near any ventricle, we think it nonetheless reflects different micro-structural integrity. It is important to realize that we compared with UHR subjects who later did not develop psychosis. Using functional magnetic resonance imaging it was shown that activation in the medial temporal lobe is associated with positive symptoms in genetic high-risk populations (Whalley et al. Reference Whalley, Gountouna, Hall, McIntosh, Whyte, Simonotto, Job, Owens, Johnstone and Lawrie2007) and our study adds to evidence that the medial temporal lobe has a role in the progression to schizophrenia in high-risk subjects.
We found a significant negative association between FA in the left middle temporal lobe and positive symptom severity on the PANSS (at baseline) in the UHR-P group. The middle temporal lobe has previously been associated with positive symptoms, for instance, the middle (and superior) temporal lobe has been associated with formal thought disorder in schizophrenia (Kircher et al. Reference Kircher, Liddle, Brammer, Williams, Murray and McGuire2001). Our results suggest that lower integrity of WM in the middle temporal lobe is related to increased positive symptoms, specifically in a subgroup of UHR subjects who later develop psychosis. We found a significant negative correlation in the combined UHR group between FA in the right superior temporal lobe and positive symptoms on the PANSS. Hence, superior temporal FA correlates to positive symptoms in UHR subjects, but is not specific for the development of psychosis.
Others recently reported frontal WM volume differences in UHR-P subjects compared with UHR-NP (Walterfang et al. Reference Walterfang, McGuire, Yung, Phillips, Velakoulis, Wood, Suckling, Bullmore, Brewer, Soulsby, Desmond, McGorry and Pantelis2008a). We did not find WM frontal differences between the UHR subgroups in our sample, but did find these when comparing with non-psychiatric controls. This could be due to the different methodology, as we used FA values and not volumetric measures, or could be because of lack of power. Further, we did not find a bilateral decrease in FA near the striatum. This may be due to lack of power or may reflect a true lateralization, as others (Buchsbaum et al. Reference Buchsbaum, Tang, Peled, Gudbjartsson, Lu, Hazlett, Downhill, Haznedar, Fallon and Atlas1998) have previously reported a decrease in anisotropy adjacent to the right putamen in schizophrenia, and co-registered positron emission tomography data revealed a corresponding deficit in functional connectivity between the right putamen and right frontal lobe. Also, a relative decrease in WM volume was found in the putamen and other striatal regions in patients with chronic schizophrenia (Tamagaki et al. Reference Tamagaki, Sedvall, Jonsson, Okugawa, Hall, Pauli and Agartz2005).
This preliminary study has its limitations, particularly the relatively small sample size. Nevertheless, we had sufficient power to detect significant group differences in FA. The results we report are likely to represent true differences in FA because of the use of a conservative analysis, which was corrected for multiple comparisons to reduce the risk of type 1 errors.
Some subjects did not complete the full 24 months follow-up or were lost to follow-up. It is possible that more transitions to psychosis may have occurred in the UHR-NP group and this may have influenced our results. To reduce this chance, we contacted all drop-outs by telephone and interviewed them about their current complaints and their current work or study. All drop-out subjects were working or in school and none reported increased symptoms. Although in the absence of a standard SCID no ‘objective’ conclusions could be drawn, none was suspected of having developed psychosis. Also, we expect that any missed transition in the UHR-NP group would attenuate the observed FA differences rather than intensify them; hence, we do not think our results can be wholly explained by this.
Although the UHR-P and UHR-NP groups did not differ significantly in the number of cannabis users, they may have differed in quantity of use and we cannot exclude an effect on our results.
The UHR-P group differed significantly from the healthy control group (but not from the UHR-NP group) in medication and cannabis use and thus these factors may have influenced our results.
Finally, apart from other limitations discussed in the Method section, voxel-based whole brain DT-MRI methodology does not allow for the identification of fibre tracts. Nevertheless, this study may provide hypotheses for future fibre-tracking studies that could identify which tracts are implicated.
Conclusion
We found differences in FA values and WM density between UHR-P and UHR-NP subjects in striatal and temporal regions and between UHR-P and non-psychiatric controls in frontal lobes. These regions are known to be involved in psychosis and are associated with severity of psychotic symptoms in other samples. The putative changes in connectivity that these FA differences represent may play a role in the development of psychosis or its symptomatology or, conversely, may be a result of this process. As the UHR paradigm essentially consists of attenuated psychotic symptoms, it is not possible to actually differentiate between cause and result. Nevertheless, it provides an interesting possibility to study psychosis in a ‘true prodromal’ stage. From our data it appears that, compared with the more extensive frontal differences with non-psychiatric controls, relatively subtle differences in WM integrity in temporal and striatal brain regions may influence whether a UHR subject develops psychosis.
Acknowledgements
This work was supported by the European Commission in Brussels, Belgium (QLGU-CT-2001–01081) and by Zon-MW (2630.0001). Zon-MW is funded by the Dutch government. The funding body had no further role in study design, in the collection, analysis and interpretation of the data, in the writing of the report and in the decision to submit the paper for publication.
Declaration of Interest
None.