I. INTRODUCTION
Transparent conducting oxide (TCO) thin films are being researched because of their importance in many transparent electronic devices, especially as electrodes in flat screen displays and thin film photovoltaic (PV) cells.Reference Sutthana, Hongsith and Choopun1 TCOs are wide band gap semiconductors (E g > 3 eV), and most applications require high transparency in the visible range (>80%) with low resistivity (∼10−3 Ω·cm). The most common TCO material is indium tin oxide, which demonstrates good electrical and optical properties.Reference Calnan, Upadhyaya, Thwaites and Tiwari2 However, the high cost of indium due to its scarcity is expected to limit its wide application in large area PV cells in the future.
Zinc oxide (ZnO) has gained much attention as an alternative TCO material due to its excellent transparency, good conductivity, high stability, nontoxicity, and low cost.Reference Bhosle, Tiwari and Narayan3–Reference Beyer, Hüpkes and Stiebig7 ZnO is most commonly doped with aluminum to improve the electrical properties.Reference Majumder, Jain, Dobal and Katiyar8, Reference Lin and Tsai9 However, previous work shows that gallium-doped ZnO (GZO) films are more stable with respect to oxidationReference Yim, Kim and Lee10 and are expected to create a more homogenous structure with less defects because of a closer atomic radius of Ga (0.062 nm) to Zn (0.060 nm) than the Al (0.052 nm) analog.
Different deposition methods such as chemical vapor deposition,Reference Huang, Li, Chen, Uen, Lan, Liao, Huang, Ku, Chen, Yang and Chiang11 pulsed laser deposition,Reference Gong, Ye, Lu, Zhu, Huang, Gu and Zhao12 magnetron sputtering,Reference Lu, Tsai, Lu, Lin and Gan13spray pyrolysis,Reference Wienke and Booij14 and sol–gelReference Lin and Chen15–Reference Kim, Tai and Shu17 have been used to prepare doped ZnO films. The sol–gel method is a high yield, low cost, simple, and robust technology that we studied in this particular work. The desired stoichiometry of the film is controlled by the material’s ratio in the starting precursor solution. The influence of various parameters has been examined previously including the precursor materials,Reference Ohya, Saiki, Tanaka and Takahashi18 dopant concentration,Reference Mridha and Basak19 and heat treatment conditions.Reference Xue, Zu, Zheng, Chen and Xiang20 However, the influence of the solution solvent and stabilizer type on the entire sol–gel process has rarely been studied. In this work, we investigated the influence of two solvents, isopropanol (IPA) and 2-methoxyethanol (2-ME), and two chelating agents, monoethanolamine (MEA) and diethanolamine (DEA), on GZO film’s properties. As will be shown, the common solvents and chelating agents mentioned above can shed new light on the quality of the deposited film. In particular, the film’s properties can be greatly improved by the selection of an optimal solvent and stabilizer. We believe that this important effect is due to the stabilization mechanisms of the stabilizers and the evaporation rates of the solvents. These two effects influence the aggregation and crystallization sequence within the deposited film, which in turn affect the final film properties.
II. EXPERIMENTAL PROCEDURE
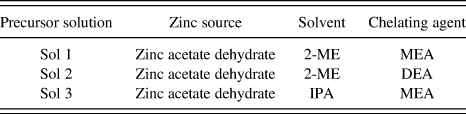
Three different precursor solutions were prepared as summarized in Table I. The first solution, Sol 1, was prepared as follows: the solvent 2-ME (Sigma-Aldrich, Milwaukee, WI) was mixed with a chelating agent MEA (Fluka, Buchs, Germany) to increase the sol’s stability. Zinc acetate dihydrate powder (AR; Merck KGaA, Darmstadt, Germany) was added to the solution and stirred at 70 °C. The molar ratio of MEA and zinc acetate was fixed at 1:1. The molar concentration in the solution was set to 0.5 M. After stirring for 1 h, a clear, transparent solution was obtained. This solution was cooled to room temperature and aged for 24 h. Sol 2 was prepared in a similar way, but DEA (Fluka) was used as a chelating agent instead of MEA. Sol 3 was also prepared in a similar way as Sol 1 with IPA (Gadot, Haifa Bay, Israel) as a solvent instead of 2-ME. Gallium nitrate hydrate (Merck) salt was used as the gallium dopant source. The salt was dissolved in 2-ME and added to each precursor solution in the desired amount. The gallium concentration in the precursor solutions varied from 0 to 5% mol.
Parameters of the three precursor solutions.

2-ME, 2-methoxyethanol; IPA, isopropanol; MEA, monoethanolamine; DEA, diethanolamine.
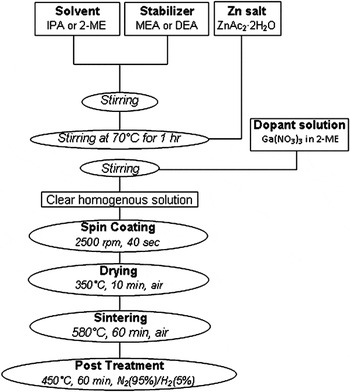
The general GZO film deposition procedure is presented in Fig. 1. A schematic description of the solution preparation procedure described earlier is shown in the top section of Fig. 1.
General diagram of Ga-doped ZnO (GZO) film deposition procedure.

GZO films were coated on 1-inch-diameter borosilicate glass discs. Before coating, the substrates were cleaned in an ultrasonic bath using acetone, IPA, and highly purified water. The films were deposited by spin coating with a rotation speed of 2500 rpm for 40 s. After each coating cycle, samples were inserted into a box furnace at 350 °C for 10 min in air for drying and removal of the organic residues. To reach the desired thickness, 7–15 cycles of coating and drying were executed, depending on the solution. After reaching the desired thickness, samples were sintered at 580 °C for 1 h in air to densify the film and to increase its crystallinity. Post-treatment in tubular furnace with a reducing atmosphere (95% N2 and 5% H2) at 450 °C for 1 h was applied to improve the films’ electrical properties.
The thermal decomposition of the solutions was analyzed using simultaneous thermogravimetric analysis/differential thermogravimetric analysis (TGA\DTA) (TG-92; Setaram, Caluire, France). Film morphology was studied using high-resolution scanning electron microscope (HRSEM) (Ultra plus; Zeiss, Zurich, Switzerland). Crystalline structure was evaluated by x-ray diffraction (XRD) (Diffractometer D5000; Siemens, Munich, Germany). We defined the (002) relative intensity as I (002) = I (002)/[I (100) + I (002) + I (101)].Reference Lin and Chen15 Electrical resistivity was measured using a four-point probe instrument (Jandel Engineering, UK). A transmittance spectrum was recorded with Jasco V-570 (Jasco, Tokyo, Japan) scanning spectrophotometer in the range of 250–1000 nm.
III. RESULTS AND DISCUSSION
A. Thermal decomposition of the sols
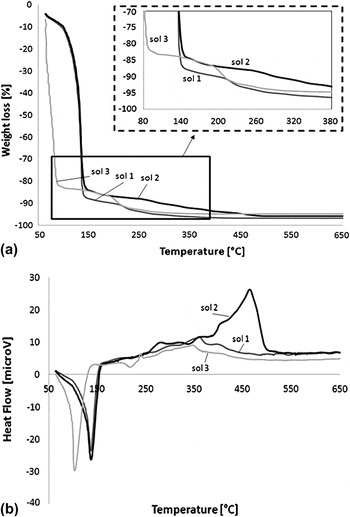
To understand the effect of the sol compositions, it is important to study their thermal decomposition pattern. Figure 2(a) shows TGA results for the three different solutions in the 50–650 °C range. Sol 1 shows two significant weight loss stages: an abrupt weight loss that begins at 91 °C and ends at 138 °C due to evaporation of most of the solution containing mainly 2-ME. A second weight loss starts at 199 °C and ends at 365 °C, probably due to decomposition and oxidation of Zn acetate and organic residues remaining from the MEA. In Sol 2, the first weight decrease is similar to that for Sol 1. However, the slope of the second weight loss stage is gradual and the weight loss occurs from ∼250 to 470 °C. This is due to the higher organic content of this precursor solution containing DEA instead of MEA. The moderate slope in this case might suggest that the decomposition occurs in several stages. In Sol 3, the first significant weight loss starts at 65 °C and ends at 110 °C. This is due to the lower boiling temperature of IPA (T b = 82 °C) in Sol 3 in comparison to 2-ME (T b = 124 °C). However, the second weight loss is identical to that of Sol 1 as the same chelating agent is involved.
(a) TGA and (b) DTA data of the different precursor solutions in the 50–650 °C range.

The DTA analysis [Fig. 2(b)] shows an endothermic peak at 102 °C for Sol 3 and at 137 °C for Sols 1 and 2. These peaks are well correlated with the solvent evaporation discussed earlier. Exothermic peaks are evident at 365 °C for Sols 1 and 3. We believe that these effects resulted from the crystallization of the amorphous ZnO. For Sol 2, small exothermic peaks are evident at 260 and 340 °C. A more significant exothermic effect with at least two overlapping peaks was detected in a wide range between 350 and 465 °C. We believe that the early peaks indicate the decomposition and oxidation of different organic residues and that last peak is due to crystallization of ZnO. The shift of crystallization process to a higher temperature in the case of Sol 2 could be attributed to the strong influence of DEA as a chelating agent in comparison with MEA, which forms stronger bonds with Zn2+ ions because of the two hydroxyl groups. The strong bonding causes a late decomposition of organic residues and increase in the temperature range where ZnO remains amorphous.
B. Effect of chelating agent, solvent, and gallium addition on the orientation
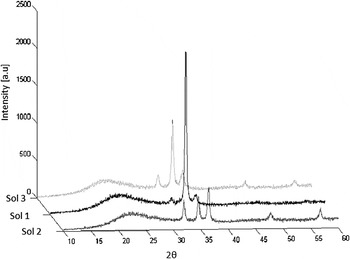
The XRD of films deposited from precursor solutions with different stabilizers and solvents are presented in Fig. 3. Films deposited from Sol 1 are characterized by textured structure with a very intense (002) peak with a relative intensity of 0.91. On the other hand, films deposited from Sol 2 do not show any preferred orientation, with a (002) relative intensity of 0.3, consistent with earlier results.Reference Yoon, Liu, Shen, Park and Kim21 Clearly, the use of DEA as a chelating agent inhibits the crystallization in the (002) direction. Yoon et al.Reference Yoon, Liu, Shen, Park and Kim21 suggested that this effect is due to a higher nucleation barrier caused by the strong bonds formed between two OH groups in the DEA and Zn2+ ions. In the case of MEA, only one OH group stabilizes the Zn2+ ion, leading to a weaker bond. The lower energy barriers for MEA solution systems may facilitate the c-axis ZnO growth, the direction with lowest energy state of this material. Based on the data in Fig. 3 and the Scherrer equation, the grain size in the film is 40 nm, which is in a good agreement with the scanning electron microscope images presented in the following section.
X-ray diffraction (XRD) results of ZnO films deposited using solutions with different stabilizers and different solvents after heating to 580 °C for 60 min in air.

The diffraction pattern of the films deposited from Sol 3, which had IPA solvent, are dominated by the (002) peak with a relative intensity of 0.7. This result is significantly lower than the preferred orientation of 0.91 obtained when using 2-ME as a solvent.
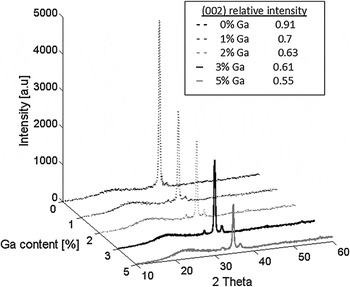
The influence of Ga dopant content on the ZnO structure formation is presented by the XRD pattern of Fig. 4. All samples were prepared from Sol 1. All samples are characterized by intense and dominant (002) peak that decreases significantly with increasing Ga content in the films. This effect shown in the inset of Fig. 4 may be attributed to the difference in the radii of zinc and gallium ions (0.074 and 0.062, respectively). These differences could cause mechanical stresses that deteriorates the crystallinity of the GZO films in general and the preferred (002) crystallization in particular.Reference Nayak, Yang, Kim, Chung, Jeong, Lee and Hong22In addition, as will be shown further, the higher Ga loading leads to decreased grain size in the film, thus the probability of misaligned grains increases.
XRD pattern of GZO films from Sol 1, as a function of Ga content.

C. Morphology
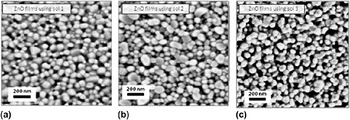
The HRSEM images of ZnO films from different solutions are shown in Fig. 5.
Nanostructure of ZnO films obtained from different precursor solutions (a) Sol 1, (b) Sol 2, and (c) Sol 3, after treatment at 580 °C.

ZnO film created from Sol 1 [Fig. 5(a)] consists of particles with a bimodal size distribution range of 50–100 and 100–170 nm. This film is represented by a relatively denser structure than Sol 2. The films derived from Sol 2 [Fig. 5(b)] show smaller grains with diameter ranging from 40 to 90 nm and many voids on the surface. This could be attributed to the higher organic content of the “green” film due to the use of DEA instead of MEA. The relatively large mass of organics is being sharply oxidized and decomposed during the heat treatment, forming the voids inside the ZnO film.
Films derived from Sol 3 [Fig. 5(c)] have a more porous structure with smaller grains (30–80 nm) as a comparison to films from Sol 1. We believe that this highly porous morphology is due to the lower boiling point of IPA than 2-ME (85 versus 125 °C, respectively). The fast evaporation rate of IPA during the coating leads to local nonuniform precipitation or agglomeration in the dried film; this structure in the “green” state leads to a lower density of the sintered film with lower orientation consistent with the XRD results.
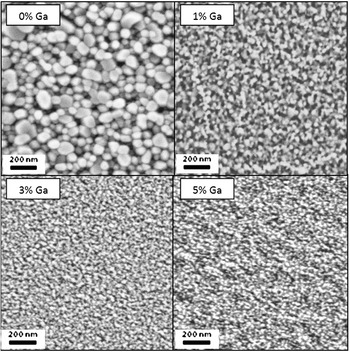
Figure 6 shows the nanostructure of ZnO films prepared using Sol 1 with different Ga dopant content. It is evident that the average grain size significantly decreases with the Ga concentration. This result is well correlated with the crystallinity deterioration observed in the XRD graphs caused by the nucleation of many more grains in the highly loaded Ga film, which can crystallize and grow in more diverse orientations.
Effect of gallium content on the nanostructure of sintered ZnO films.

D. Transparency
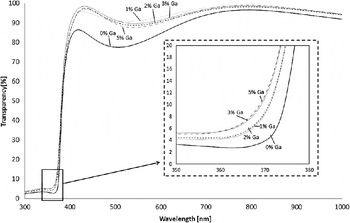
Since high transparency is an important factor in the application of GZO TCO films, the transmission was tested in the wavelengths of 250–1000 nm and the results are presented in Fig. 7 for samples with thickness of ∼400 nm prepared from Sol 1. The transparency of these films was studied as a function of Ga concentration in the 0–5 wt% range.
Transparency of GZO films with different Ga content.

All doped samples showed excellent transparency in the visible spectrum with a transparency in the 88–97% range. A significant improvement in the transparency is observed for all the doped films relative to the undoped ZnO films. A closer view of the transmission in the UV range is shown in the inset of Fig. 7. In this range, the transmission is strongly dependent on the Ga content where the absorption edge shifts to shorter wavelengths at higher Ga concentrations. This phenomenon is consistent with the “Burstein–Moss effect”Reference Burstein23, Reference Moss24 and is caused by the increasing charge carrier concentration at higher dopant content. This phenomenon was reported in many reports for Al-doped ZnO films. In fact, some previous studies have suggested that this phenomenon does not existReference Cheong, Muti and Ramanan25 in GZO case, contrary to our findings.
E. Resistivity
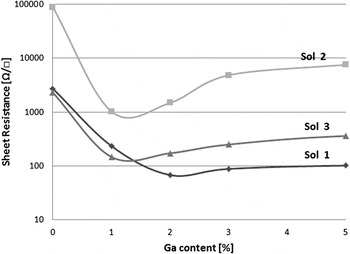
The electrical resistivity of GZO films is presented in Fig. 8. The graph shows the results for GZO films deposited using different precursor solutions and with rising gallium content. All films have a similar thickness of 550 nm. For Sol 1, lowest sheet resistance of 68 Ω/□ was achieved at 2% Ga. For Sols 2 and 3, the lowest sheet resistances occurred at 1% Ga and were 1022 and 124 Ω/□, respectively. The use of gallium as a dopant for ZnO films lowers the resistivity as a result of the rise in charge carrier concentration, caused by the Zn atoms being replaced by Ga atoms. The Ga atoms are being ionized to Ga3+, contributing an extra electron. However, a further rise in gallium content does not cause a further improvement in films’ resistivity. This is due to the fact that a rise in Ga above 2–2.5% could create segregation of Ga2O3 secondary phase at the grain boundaries. Such Ga-rich nano-entities at the grain boundaries may be amorphous or below the XRD detection limit and thus not detected. In addition, the deterioration of the preferred crystalline orientation caused by the rise in Ga content might also cause this result. A significant difference is also observed between the solvent of the precursor solutions used for the deposition. The lowest sheet resistance was achieved for GZO films deposited from Sol 1. We believe that the denser structure, lower porosity, and increased crystalline orientation are responsible for the significant improvement in electrical properties of the deposited films.
Sheet resistance of GZO films prepared from different precursor solutions with varied Ga content.

IV. CONCLUSIONS
The resistivity, transmission, and crystalline orientation of GZO thin films prepared using sol–gel spin coating technique are reported in this work. The influence of chelating agent (MEA and DEA), solvent type (IPA and 2-ME), and Ga content (1–5 wt%) was investigated. XRD results showed preferential c-axis orientation when a solvent with a lower boiling point was used. In addition, the lower boiling point also caused a more porous structure. The preferred c-axis orientation did not appear when the chelating agent was changed from MEA to DEA and a more porous structure was observed in HRSEM images. The grain size was found to decrease with Ga incorporation in the films. The rise in Ga content improved the optical transparency up to a range of 88–97% in the visible range. Sheet resistance of the samples showed an optimum at 1 or 2%, depending on the precursor solution, and the best (lowest) result was of 68 Ω/□ for films deposited using MEA and 2-ME as stabilizer and solvent, respectively. These results indicate that the solvent of precursor solution and composition have a significant influence on the crystalline structure and morphology on the electrical and optical properties of sol–gel-deposited GZO films. These films, developed and investigated in this work, could offer a promising option as TCO electrodes in various electro-optical applications.
ACKNOWLEDGMENTS
We thank Dr. J.M. Reisner (Department of Physics, Technion) for assistance in XRD measurements. We also thank Y. Cohen, B. Bank-Srur, A. Dana, R. Muscal, P. Bluvshtein, and L. Alterzon for their assistance in this work. The research was supported by the Grand Technion Energy Program; the Russell Berrie Nanotechnology Institute of Technion; the Solar Energy Solutions MAGNET Consortium, Ministry of Industry and Trade, Israel; Arturo Gruenbaum Chair in Material Engineering; and the Berman-Shein solar energy research fund.