
I. INTRODUCTION
In the International Thermonuclear Experimental Reactor (ITER), pure W is considered to be one of the most promising candidates for plasma facing materials (PFMs) and divertor plates in fusion power reactors, due to its high melting point (3695 K), high strength at high temperatures, high sputtering threshold energy, good thermal conductivity, and low thermal expansion coefficient. Reference Tanabe, Noda and Nakamura1–Reference Chuyanov3 In addition, tungsten is also used as a shielding material in fusion reactors and other systems involving nuclear reactions. Reference Ekman, Persson and Grimvall4 Unfortunately, pure tungsten metal exhibits poor radiation stability and fracture toughness, and low ductility associated with a high ductile-to-brittle transition temperature (DBTT). These properties are strongly dependent on the chemical composition and the micro-structural state. Reference Matera and Federici5 Alloying is a good method to improve the physical properties of tungsten. For example, the thermodynamic properties of tungsten are expected to be enhanced by alloying with other elements. Reference Kim, Oh, Oh and Moon6–Reference Liu, Huang, Geng, Wang, Liu and Zhang8
Among various alloying strategies of W metal, W–Ta alloy is a typical one. To our knowledge, both experimental and theoretical aspects focus on understanding the mechanical properties of W–Ta alloy. For example, Vani Shankar et al. studied the influence of varying W and Ta on low cycle fatigue and creep-fatigue interaction behavior of reduced activation ferritic/martensitic steels. Reference Shankar, Mariappan, Sandhya and Laha9 Zhang et al. studied the effect of thickness ratio on toughening mechanisms of Ta/W multilayers. Reference Zhang, Ouyang, Liu, Wang, Du, Zhang, Feng and Suo10 Bercegeay et al. studied second-nearest-neighbor modified embedded-atom potential for binary Ta–W alloys based on first-principles calculations. Reference Bercegeay, Jomard and Bernard11 Turchi et al. studied stability and local order in substitutional Ta–W alloys by first-principles calculations. Reference Turchi, Gonis, Drchal and Kudrnovsk12 So far, only a few work has been reported on the effect of Ta-alloying and the Ta concentration on the fundamental mechanical properties such as elastic properties and ductile/brittle behaviors. We know that the mechanical properties are very important for the first wall materials. The density-functional theory (DFT) calculation can be used to predict the mechanical performance of materials with relatively low cost and high efficiency, comparing with the experimental evaluations. Since conventional experimental alloy design processes can be very expensive and time-consuming, DFT calculations can be used to study the structure–property relationships and help to design these materials. Computer simulation focus on improving specific alloy properties that can narrow down the number of compositions that are needed to be prepared and characterized.
In this work, we thus investigate the phase stability and mechanical properties of W1−x Ta x alloys (x = 0.0625, 0.125, 0.1875, 0.25, 0.3125, 0.5, 0.5625, 0.625, and 0.75) using first principles calculations. The lattice constants, the cell volume, the formation energies and the elastic constants of the W1−x Ta x alloys are calculated. Based on the mechanical characteristic of B/G ratio, Poisson's ratio (ν) and Cauchy pressure (C′), the ductile/brittle properties of the W–Ta alloys are evaluated. These computational results may serve as guidance for further optimizing the composition of W–Ta alloys, which will provide a useful database for PFMs investigation.
II. MODEL AND COMPUTATIONAL DETAILS
Computations in the current work were done within the DFT and the plane-wave pseudopotential method, which were implemented in the Vienna ab initio simulation package (VASP). Reference Kresse and Hafner13,Reference Kresse and Furthmüller14 The core ion and valence electron interaction were described by the projector augmented wave (PAW) method. Reference Blöchl15 The valence electrons included in the PAW potential for W and Ta atoms are W-6s 25d 4 and Ta-6s 25d 3, respectively. The exchange-correlation part was described with the generalized gradient approximation (GGA) by Perdew and Wang (PW91). Reference Wang and Perdew16 All models were described by a 2 × 2 × 2 supercell containing 16 atoms in a body centered cubic (bcc) structures. Part of W atoms were substituted by the Ta atoms to obtain various alloys with different Ta concentrations, that is pure W, W0.9375Ta0.0625, W0.875Ta0.125, W0.8125Ta0.1875, W0.75Ta0.25, W0.6875Ta0.3125, W0.5Ta0.5, W0.4375Ta0.5625, W0.375Ta0.625, W0.25Ta0.75, and pure Ta. All the systems were modeled with bcc supercells. For the Brillouin-zone sampling, we used the 9 × 9 × 9 Monkhorst–Pack mesh Reference Monkhorst and Pack17 for all W1−x Ta x alloys with bcc structures. A cutoff energy of 400 eV was used for all systems. Gaussian smearing method with a smearing width of 0.05 eV is applied in all calculations in this study.
Within the framework of the continuum elasticity theory, Reference Wallace18,Reference Zhao, Winey and Gupta19 for the cubic structure, there are three independent elastic constants: C 11, C 12, and C 44. To calculate these elastic constants, three sets of specific strains (δ) along different directions are applied to the cubic supercell, and the total energy changes are calculated as a function of the applied strains. Then, the elastic constants can be obtained through fitting the energy changes (ΔE) versus the applied strains (δ). As shown in Table I.
The change relationship of strain and total energy of cubic crystal system.

The mechanical properties can be calculated from these single crystal elastic constants, according to the Voigt–Reuss–Hill scheme. Reference Voigt20–Reference Hill23 The bulk modulus (B), shear modulus (G), Young's modulus (E), Poisson's ratio (ν), and Cauchy pressure (C′) of the cubic W–Ta alloys are calculated with C 11, C 12, and C 44 and given by the following formula:
 $$B = {{{C_{11}} + 2{C_{12}}} \over 3},\;G = {{3{C_{44}} + {C_{11}} - {C_{12}}} \over 5}\quad,$$
 $$E = {{9BG} \over {3B + G}},\;\nu = - 1 + {E \over {2G}},\;C' = {{{C_{12}} - {C_{44}}} \over 2}\quad.$$
III. RESULTS AND DISCUSSION
A. The mechanical properties of bcc tungsten (W) and bcc tantalum (Ta)
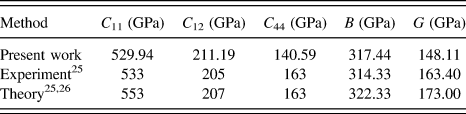
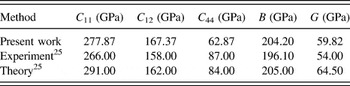
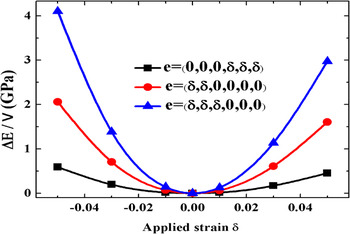
The calculated single crystal elastic constants and mechanical property parameters of W and Ta are listed in Table II and Table III. As an example, the fitting quadratic curves of the total energy change to strain of bcc W are shown in Fig. 1. For comparison purpose, we also list the data from experiments, as well as other theoretical results in the tables. Note that the elastic constants as well as the mechanical parameters of the bcc W and bcc Ta metal from our calculations is basically in agreement with the experimental and other theoretical results. This confirms that the model and computational parameters are reasonable in the present work and therefore the following results on the W–Ta alloys are reliable. Furthermore, the elastic constants C 44 for the bcc W and Ta are underestimated comparing with those experimental data. This is due to the GGA-PW91 functional we used in the current study. Reference Csonka, Perdew, Ruzsinszky, Philipsen, Lebègue, Paier, Vydrov and Ángyán24 As GGA-PW91 functional always underestimate the lattice constants of metal systems, it transfers this error to the calculation of the elastic constants.
The elastic constants of bcc W.

The elastic constants for bcc Ta.

The fitting quadratic curve of the total energy change to strain (δ) of bcc pure W.

B. The energetics and stability of the binary W–Ta alloys
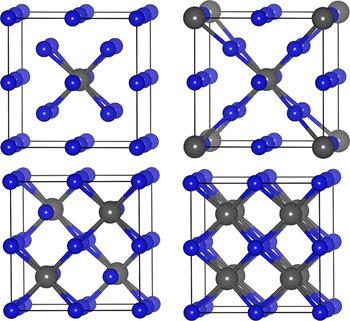
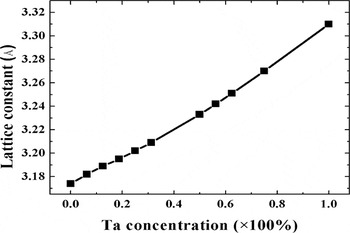
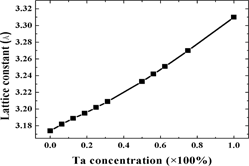
First of all, the atomic positions and W–Ta configuration in the supercell are considered and optimized, and the configuration with the lowest total energy is chosen for further study. The schematic diagrams of the part atomic configurations with the lowest total energy of the W1−x Ta x alloys at different x value are shown in Fig. 2. As it is shown, the W–Ta alloys keep the bcc lattice, and the Ta atoms prefer to locate at positions to ensure that the structure is in a highest symmetry. This shows that the solid solution of the W–Ta alloy can be formed at the atomic level. In addition, to obtain the equilibrium lattice constant, we calculated the total energies as a function of the volume and then fit the results using Birch–Murnaghan equation of state. Figure 3 shows the variation of the equilibrium lattice constants of W1−x Ta x alloys as a function of the Ta concentration. The lattice constant of the W1−x Ta x alloy increases almost monotonically with x increases, due to the larger radius of the Ta atom comparing with that of the W atom. Here we mention that we also tested the alloys with bcc Ta lattice, and our results show that the calculated energies of the W–Ta alloys with bcc Ta lattice is almost equal to that of with bcc W lattice. For example, the energy of W0.5Ta0.5 in the bcc W lattice (−199.28 eV) is only a little more than that of W0.5Ta0.5 in the bcc Ta lattice (−199.29 eV). For other concentrations, the energy difference is even no. It means that the W–Ta alloy is an infinite solid solution.
The energetically most favorable atomic arrangements of the bcc W1−x Ta x (x = 0.0625, 0.125, 0.25, and 0.5) alloys in a 2 × 2 × 2 supercell. Small blue and large gray balls are W and Ta atoms, respectively.

Equilibrium lattice constants of bcc W–Ta alloys as a function of Ta concentration.

To evaluate the stability of the alloys, we calculated the formation energy of the W1−x Ta x alloys, which is defined as:
 $${E_{\rm{f}}} = {E_{{\rm{W}}-{\rm{Ta}}}} - \left( {1 - x} \right){E_{\rm{W}}} - x{E_{{\rm{Ta}}}}\quad ,$$
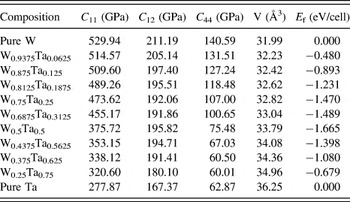
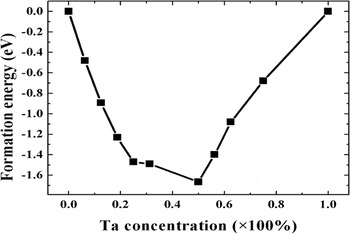
where x is the concentration of the alloying element, E W, E Ta, and E W–Ta are the total energies of bcc W, bcc Ta and W–Ta alloy in the bcc lattice, respectively. From this definition, negative value of the formation energy means that the alloy is thermodynamically more stable. The calculated results are summarized in Table IV and the variation of the formation energy as a function of the Ta concentration are given in Fig. 4, from which we can see that almost 100% atomic ratio of Ta can be alloyed in the bcc lattice of the W. indication of thermodynamically stable at all different concentrations. Also further show that the W–Ta alloys is an infinite solid solution. When the Ta concentration is lower than 50%, the formation energy decreases when the concentration is increased. When the Ta concentration is more than 50%, the formation energy increases when the concentration is increased. In addition, we also tested the influence of the supercell size to the formation energy, and our results show that the 2 × 2 × 2 supercell is large enough in this study. For example, the formation energy difference is less than several meV for one Ta atom in 2 × 2 × 2 and 3 × 3 × 3 supercells. This is reasonable because Ta only interacts with its nearest neighboring W atoms, which will be shown in the following of this paper.
The cell volumes, elastic constants, and formation energies of bcc W1−x Ta x alloys.

Formation energy of bcc W–Ta alloys as function of Ta concentration.

The formation energy discussed above is based on the calculated ground state total energy. In real systems, rather than the total energy, the Gibbs free energy accounts for the phase formation and stability. To clarify that the above mentioned phases can be stable and dominated in real systems, we compared it with other disordered configurations and evaluated the entropy contribution of a disordered system. We take the 12.5% Ta concentration as our example and created a supercell that contains 128 atoms. The ordered configuration in the supercell is same as the W0.875Ta0.125, while several other disordered configurations are tested. Our results shows that the total energy of the system in the ordered configuration (−1642.6364 eV) is much lower than that of the disordered configurations (e.g., we obtained total energies of −1639.8560, −1641.0292, −1641.4149, −1641.7085, −1642.0198, and −1642.0634 eV for different configurations). On the other hand, the entropy of the system can be evaluated with S = k B ln Ω, where Ω is the total number of the configurations. Therefore, we can estimate that the contribution of the entropy to the Gibbs free energy is around 1.1 eV under room temperature, which is clearly lower than that of the energy difference between the ordered and disordered configurations. Therefore, the disordered systems are not considered in this paper.
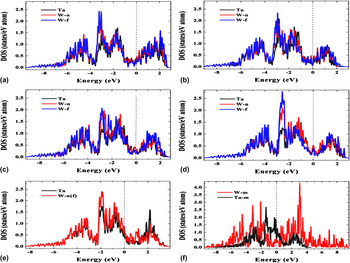
The bonding interaction can be illustrated with the density of states. Figure 5 presents the atomic projected density of states (PDOS) to W and Ta atoms with different atomic surrounding environments. From Fig. 5 we can see that the alloying effect lowers the energy level of the Ta states comparing with that of in pure Ta metal in the case of W0.9375Ta0.0625, while the energy level of the W atoms are not changed much comparing with that of W metal. As a result, the energy of the W0.9375Ta0.0625 alloy is lower than that of the pure metal and gives rise to the negative formation energy. When the concentration of the Ta becomes higher, more Ta-states (as more Ta atoms are involved) become lower in energy, which further decreases the energy of the alloy. On the other hand, the energy levels of W-states getting higher in energy, which increases the energy of the alloy. Therefore, the decreased energy from Ta atoms is compensated by the increased energy from W atoms, and finally the formation energy states to increase when the Ta concentration reaches certain value (50%). Furthermore, Fig. 5 also demonstrate that the degree of overlapping of the W-states and Ta-states in the case of W0.75Ta0.25 is higher than that of in W0.9375Ta0.0625, indicating that the W–Ta bonding strength is higher in W0.75Ta0.25 comparing with that of in W0.9375Ta0.0625.
The atomic PDOS of W and Ta atoms in bcc W1−x Ta x . (a) W0.9375Ta0.0625; (b) W0.875Ta0.125; (c) W0.8125Ta0.1875; (d) W0.75Ta0.25; (e) W0.5Ta0.5; (f) pure W and pure Ta. The energy is with respect to the Fermi level. “W-n”, “W-f” and “W-m” are the PDOS of W nearest neighboring to Ta, far away from Ta, and pure W metal, respectively. “Ta” and “Ta-m” are the PDOS of Ta atom in the W–Ta alloy and pure Ta metal, respectively.

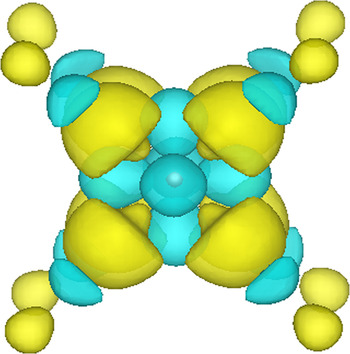
Charge transfer between W and Ta is essential for the lowered energy of the alloy. As the electronegativity of W (1.7) is higher than that of Ta (1.5), it is expected that small charge transfer from Ta to W in the alloy. Figure 6 gives the differential charge density that illustrates the charge transfer clearly. As it is shown, the 8 nearest neighboring W atom to the Ta atom obtains most of the charge from the Ta atom. Charge transfer can also be analyzed with the Bader charge analysis. Our results show that the Bader charge of Ta is 4.405e, indicating that Ta losses of about 0.6 electrons (Ta atom has 5 valence electrons). On the other hand, the Bader charge of the W atoms nearest to the Ta atom is 6.152e, indicating that each W atom obtains about 0.15 electrons (W atom has 6 valence electrons). The charge transfer gives rise to slightly positively charged Ta and negatively charged W. The major interaction among the W and Ta atoms is metallic bonding, as the amount of the charge transfer is very small (the isosurface value is 0.0062 e/Å3), the charge transfer strengthened the W–Ta metallic bonding, which will be shown in the following of this paper.
Charge transfer upon Ta alloying in the case of W0.9375Ti0.0625. The color and size of W and Ta atoms are the same as in Fig. 2. The yellow and blue color charge density contours indicate gain and loss charge, respectively. The value of the isosurface is 0.0062 e/Å3.

C. The mechanical properties of the binary W–Ta alloys
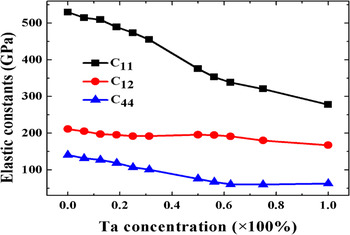
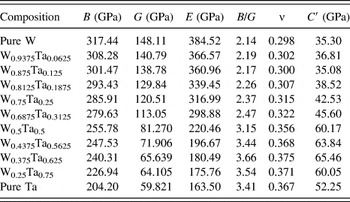
For each Ta concentration x, we calculated the single crystal elastic constants and the mechanical property parameters of the W1−x Ta x alloys in a bcc structure. The calculated elastic constants are shown in Table IV and plotted in Fig. 7 as a function of x. As it can be seen, when the Ta concentration is less than 62.5%, the elastic constants C 11 and C 44 decrease obviously and almost monotonically with the increase of the Ta concentration. When the Ta concentration is more than 62.5%, the slope of curve for C 11 and C 44 decrease obviously with the increase of the Ta concentration, especially the slope of curve for C 44. The C 11 is an important elastic coefficient related with the stiffness of cubic crystals. The C 11 value changes from 529.94 GPa for pure W to 277.87 GPa for pure Ta, indicating that the stiffness of the W1−x Ta x alloys decreases with the increase of the Ta concentration. The C 12 represents the ability of resistance to lateral deformation of the cubic lattice. As it is shown, the C 12 value of the bcc W does not change much upon Ta alloying.
Elastic constants of bcc W–Ta alloys as a function of Ta concentration.

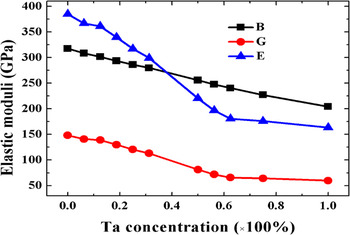
With the above elastic constants, we calculated the elastic moduli as shown in Table V and Fig. 8. The elastic modulus include bulk modulus (B), shear modulus (G), and Young's modulus (E), which represent the ability of resistance to deformation of the bulk material. Reference Meradji, Drablia and Ghemid27 For the bulk modulus of pure W, the calculated value (317.44 GPa) matches very well with experimental data (314.33 GPa), Reference Soderlind, Eriksson, Wills and Boring25 as it is indicated above. Obviously, we can see that the bulk modulus decreases monotonically with the increase of Ta concentration. When Ta concentration reaches 100%, bulk modulus of W–Ta alloy decreased to 204.20 GPa. The changes of Young's modulus and shear modulus are similar, and the slope of curve for the Young's modulus is steeper than that of the bulk modulus. The Young's modulus decreases from 384.52 GPa for pure W down to 163.50 GPa for pure Ta. The shear modulus decreases from 148.11 GPa for pure W down to 59.82 GPa for pure Ta. Although, these data suggest that the mechanical strength of the W1−x Ta x alloys decreased comparing with that of pure W, it is still much better than that of pure Ta metal.
Bulk modulus (B), shear modulus (G), Young's modulus (E), B/G ratio, Poisson's ratio (ν), Cauchy pressure (C′) for bcc W1−x Ta x alloys.

Bulk modulus (B), shear modulus (G), and Young's modulus (E) of bcc W–Ta alloys as function of Ta concentration.

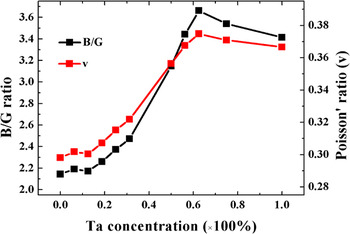
On the other hand, the ductility of the W–Ta alloys is improved substantially compared with the pure W metal. According to Pugh theory, the bulk modulus to shear modulus ratio (B/G ratio) is strongly related with the ductility of metal materials. The larger the B/G ratio is, the better ductility the material exhibits. Reference Pugh28 Fig. 9 presents the B/G ratio and the Poisson's ratio (ν) as functions of the Ta concentration x. With increasing Ta concentrations, the B/G value increases gradually and reaches a value of 3.66 at x = 62.5%. This value is already higher than that of pure Ta metal (3.41), indicating that the ductility of the W0.375Ta0.625 alloy is better than that of pure Ta metal. Poisson's ratio can also characterize the ductility of bulk materials. As it is shown in Fig. 9, the variation of the Poisson's ratio to the Ta concentration exhibits similar trend to that of the B/G ratio. When the Ta concentration x reaches 0.625, the Poisson's ratio is 0.375 and larger than that of pure Ta (0.367).
B/G ratio and Poisson's ratio of bcc W–Ta alloys as function of Ta concentration.

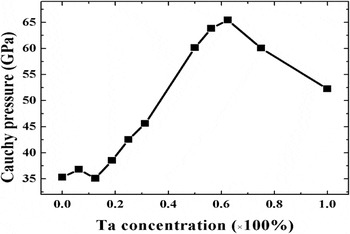
Qualitatively, the metallic bonding (ductile metals) and covalent bonding (directionally bonded solids) behaviors of the W–Ta alloy can be characterized by the calculated Cauchy pressure, Reference Kamran, Chen and Chen29 which is shown in Fig. 10. When the Cauchy pressure (C′) has a positive value, metallic bonding interaction dominates the materials and therefore the bulk material exhibits ductility. The larger the C′ value is, the stronger of the metallic bond and thus better ductility properties. Reference Kamran, Chen and Chen29,Reference Tang, Yu, Zeng, Ding and Gray30 On the contrary, as for brittle materials, the Cauchy pressure is negative. The smaller the negative value is, the stronger covalent bonding and the more serious degree of brittleness of materials. Reference Kamran, Chen and Chen29,Reference Tang, Yu, Zeng, Ding and Gray30 From Fig. 10 we can see that the Cauchy pressures of the binary W1−x Ta x alloys are positive, because metallic bonding dominates the binary W1−x Ta x alloys. Furthermore, the Cauchy pressure increases with the increased Ta concentration, showing that the metallic bonding is strengthened upon alloying higher concentration of Ta in the bcc W. This is consistent with the above analysis of the charge distribution and PDOS in Sec. III. B.
Cauchy pressure (C′) of bcc W–Ta alloys as function of Ta concentration.

Finally, it is worthwhile to mention that the distribution of the Ta atoms does not affect much to the mechanical properties of the W–Ta alloys. Taken as an example, Table VI gives the mechanical parameters of the W0.875Ta0.125 concentration with two different disordered random distributions of the Ta atoms in the lattice, comparing with that of the ordered distribution. As it can be seen, the mechanical parameters of those disordered system is very close to that of the ordered W0.875Ta0.125 configuration, indicating that the distribution of the Ta atoms do not affect much to the mechanical properties. Therefore, in real application, although some kind of disorder of the Ta distribution may occur due to various preparing conditions, the mechanical properties can be retained.
Mechanical parameters of the W0.875Ta0.125 different Ta distributions in the unit cell. The elastic constants, B, G, E, and C′ are in GPa.

IV. SUMMARIES AND CONCLUSIONS
In summary, the effect of Ta alloying on the fundamental mechanical properties of bcc W has been studied by first principles calculations. Within a 16 atoms solid solution model, the lattice constants, the cell volumes, the formation energies, and the elastic constants of W1−x Ta x (x = 0.0625, 0.125, 0.1875, 0.25, 0.3125, 0.5, 0.5625, 0.625 and 0.75) alloys were calculated, and the Ta concentration to the performance of the W–Ta alloys are specifically addressed. It is shown that Ta alloying in bcc W lattice is an infinite solid solution and the W0.5Ta0.5 have the lowest formation energy. From the obtained elastic constants, the elastic moduli and the mechanical parameters are calculated. The elastic constants and the elastic moduli of W1−x Ta x alloys decrease with the increase of Ta concentration. Although these data suggest that the mechanical strength of the W1−x Ta x alloys decreased comparing with that of pure W, it is still much better than that of pure Ta metal. On the other hand, based on the calculated B/G and Poisson's ratio, it is found that the ductility of bcc W can be improved through Ta alloying. The ductility of the W1−x Ta x alloys increases with increasing Ta concentrations, and it is even better than that of pure Ta metal when the Ta concentration reaches 62.5%. Through analysis of the Cauchy pressure (C′), the metallic bonding is strengthened upon alloying higher concentration of Ta in the bcc W.
ACKNOWLEDGMENTS
This study is supported by the Jiangxi Provincial Natural Science Foundation of China (Grant No. 20151BAB202009) and the Scientific Research Fund of Jiangxi Provincial Education Department (Grant No. GJJ151329).