


Do voters effectively hold elected officials accountable for policy decisions? Studies of political behavior are divided on their views of voter competence, not only in the domain of vote choice but also in the domain of attitude formation. On the one hand, The Michigan School conceived of the public as myopic, uninformed (Campbell et al. Reference Campbell, Converse, Miller and Stokes1960), and lacking an organized belief system of political attitudes (Converse Reference Converse and Apter1964). Subsequent research showed that voters lack political knowledge (Delli Carpini and Keeter Reference Delli Carpini and Keeter1996), possess misinformation (Kuklinski et al. Reference Kuklinski, Quirk, Jerit, Schwieder and Rich2000), and often make seemingly irrational electoral decisions (Bartels Reference Bartels2008; Caplan Reference Caplan2007; Lau and Redlawsk Reference Lau and Redlawsk2006). Although not always explicitly demonstrated, these studies suggest that voter incompetence is normatively undesirable because it reduces social welfare.
On the other hand, Key (Reference Key1966) argued that the electorate is “responsible,” in that citizens often vote to reward or punish the incumbent administration for its stewardship of the country (Fiorina Reference Fiorina1981; Kramer Reference Kramer, Gerald1971). Even if voters are not fully informed, they can rely on information shortcuts such as cues and endorsements to make sensible decisions (Lupia Reference Lupia1994; Lupia and McCubbins Reference Lupia and McCubbins1998; Popkin Reference Popkin1991; Sniderman et al. Reference Sniderman, Brody and Tetlock1991). The information market induced by electoral competition incentivizes politicians to provide voters with such information (Wittman Reference Wittman1995). Moving from the individual to the aggregate level, Page and Shapiro (Reference Page and Shapiro1992) argued that even if individual voters exhibit unsophisticated and unstructured conceptions of politics, collective preferences are well organized and respond sensibly and swiftly to government action and national events. These studies generally conclude that citizen competence is sufficient to the tasks of electoral accountability.
However, there exist important limitations in the evidence brought to bear by both sides in this debate on democratic competence. For example, studies of individual-level attitudes typically rely on secondary indicators of democratic competence, such as scores on political knowledge tests (e.g., Delli Carpini and Keeter Reference Delli Carpini and Keeter1996), correlations among survey responses as measures of “constraint” (e.g., Converse Reference Converse and Apter1964), and experimental treatment effects of information cues and heuristics (e.g., Lupia and McCubbins Reference Lupia and McCubbins1998). Moreover, aggregate-level studies showing that voters respond to macroeconomic conditions at election time (e.g., Kramer Reference Kramer, Gerald1971) or that mass public opinion is sensitive to changes in events (e.g., Gerber and Green Reference Gerber and Green1998; Page and Shapiro Reference Page and Shapiro1992) generally contend that such patterns are evidence of rational response.Footnote 1 However, as Achen and Bartels (Reference Achen and Bartels2004b, Reference Achen and Bartels2005) argued, this is not necessarily the case because voters may be reacting in ways that make little sense. Finally, the arguments of both the optimists and the pessimists suggest that levels of information (or lack thereof) among the public have social welfare consequences, but generally do not demonstrate their existence.
More broadly, the extant literature has not provided a full test of government accountability, in the sense that previous studies have not simultaneously examined (1) voters’ responses to government policy, (2) incumbents’ responses to public opinion, and (3) the welfare consequences of elite and mass behavior.
This study develops a fuller test of citizen competence and political accountability via an examination of natural disasters—stochastic, exogenous events that offer a unique opportunity to assess the reciprocal relationship between government actions and voter responses. Disaster preparedness and response is an area in which we can actually estimate the effectiveness of specific policy decisions and voter responses to these policies. Our results show that voters significantly reward disaster relief spending, holding the incumbent presidential party accountable for actions taken after a disaster. In contrast, voters show no response at all, on average, to preparedness spending, even though investing in preparedness produces a large social benefit.Footnote 2 We estimate that the average $1 spent on disaster preparedness reduces future disaster damage by more than $7 in a single election cycle, and that the total value of a dollar of preparedness spending for all future damage reduction is about $15.
These empirical results address the limitations of extant scholarship described previously. First, by exploring electoral responses to government policies, we avoid secondary indicators, enhancing the ecological validity of our findings. Second, by examining the electoral consequences of specific government actions in response to stochastic events, we are able to disentangle voters’ responses to events outside incumbents’ control from their responses to incumbents’ efforts to prevent or ameliorate the damages produced by those events. Accordingly, we build on studies that have also examined voter responses to random events (e.g., Achen and Bartels Reference Achen and Bartels2004a), but have only explored the direct effects of the events themselves. Third, we assess the social welfare consequences of voter decision making, allowing us to assess whether the observed (un)responsiveness is a sign of competence.
Our central finding is that voters offer scant incentive to presidents to pursue cost-effective preparedness spending, but do encourage them to send in the cavalry after damage has been done and lives have been lost. It is difficult to say how exactly preparedness and relief spending should be optimally balanced, but the evidence strongly suggests that the manner in which voters currently incentivize politicians—with essentially all weight on the latter—is anything close to optimal. How voters incentivize politicians helps explain why public policy has very strongly favored relief over preparedness, providing a partial account for the government's failure to take sufficient ex-ante measures to mitigate damages from events such as Hurricane Katrina and the 2008 California wildfires.
This article is organized as follows. In the next section, we present an overview of the theoretical issues underlying our analyses. The following section describes the data and discusses our empirical approach. The final two sections present the results and discuss their implications for the study of democratic accountability.
BACKGROUND AND CONCEPTUAL FRAMEWORK
In developing the theoretical basis for our analysis, we draw on the extant literature on two sets of relationships: (1) the effect of conditions and events on elections and voting behavior, and (2) the influence of voters’ attitudes and behavior on policy making. We extend these literatures by empirically examining each direction of the relationship between voting behavior and policy decisions, whereas the existing literature has generally focused on mass behavior or elite institutions in isolation.
As described previously, the bulk of the literature on retrospective voting and electoral accountability has explored how voters hold governments accountable for economic conditions (e.g., Fiorina Reference Fiorina1981; Gomez and Wilson Reference Gomez and Wilson2006; Hibbing and Alford Reference Hibbing and Alford1981; Kinder and Kiewiet Reference Kinder and Kiewiet1979; Kramer Reference Kramer, Gerald1971; Lewis-Beck Reference Lewis-Beck1988; Rudolph Reference Rudolph2003a, Reference Rudolph2003b; Stein Reference Stein1990). Scores of studies have found evidence that economic conditions affect voting behavior, both in the United States and internationally, using both individual-level and aggregate data. Voters tend to reelect incumbents who have been stewards of healthy economies and tend to vote them out during times of economic hardship.
Recognizing the limitations of analyzing macroeconomic conditions, some more recent empirical research has explored retrospective voting in noneconomic domains. Achen and Bartels (Reference Achen and Bartels2004a) found that voters punish incumbents in response to droughts, floods, and other natural disasters. Malhotra and Kuo (Reference Malhotra and Kuo2008) explored partisan bias in attributing blame to government officials following Hurricane Katrina. Grose and Oppenheimer (Reference Grose and Oppenheimer2007) and Karol and Miguel (Reference Karol and Miguel2007) observed that military deaths harm incumbents’ reelection prospects. Berry and Howell (Reference Berry and Howell2007) found that citizens vote against incumbent school board members in response to falling test scores, but only when the media make education issues salient in voters’ minds.
Another body of research has argued that government policies are strongly driven by politicians’ desires for reelection. Even if politicians have higher-minded goals of pursuing sound and beneficial public policies, reelection is the proximate objective, and elections serve as a mechanism to select for “single-minded reelection seekers” (Mayhew Reference Mayhew1974, 17). Previous scholarship has found evidence for this proposition, even in seemingly nonideological domains such as disaster relief and preparedness in which politicians might not be expected to pander to narrow constituencies. For example, Garrett and Sobel (Reference Garrett and Sobel2003) found that nearly half of all Federal Emergency Management Administration (FEMA) disaster relief payments were motivated by political considerations as opposed to need.Footnote 3 Besley and Burgess (Reference Besley and Burgess2002) showed that politicians in India respond more aggressively to crises when there is greater media presence, arguing that an active media is important for creating electoral accountability. Even the decision to make a presidential disaster declaration, a prerequisite for the availability of federal aid in some cases, may be politically motivated (Sobel and Leeson Reference Sobel and Leeson2006). Finally, Chen (Reference Chen2008) found evidence suggesting that FEMA may have strategically delivered grants to maximize vote share and buy turnout for the incumbent administration after the Florida hurricane season in 2004. Taken together, the extant literature underscores the importance of political motivations in determining how governments respond to disasters.
In this study, we tie together the research agenda on voters’ reactions to government performance and the literature on the effect that electoral incentives have on public policy via an empirical analysis of natural disaster management and voter responses to federal government relief and preparedness initiatives. Although we focus primarily on voters’ actions rather than the processes driving their behavior, previous research suggests several mechanisms that could explain why voters reward relief expenditures, but not preparedness spending.
Collectiveness. First, in our data, relief spending consists mostly of direct payments, whereas preparedness spending consists mainly of public goods, and voters may prefer receiving private goods to public ones (Green Reference Green1992; Lizzeri and Persico Reference Lizzeri and Persico2001; Sears and Citrin Reference Sears and Citrin1985). There is an extensive literature in political science that has argued that the United States is characterized by a high amount of universalistic support for particularistic spending, especially as compared to other developed countries (e.g., Ferejohn Reference Ferejohn1974; Levitt and Snyder Reference Levitt and Snyder1997; McGillivray Reference McGillivray2004; Shepsle and Weingast Reference Shepsle and Weingast1981; Stein and Bickers Reference Stein and Bickers1995), which may reflect the fact that voters particularly value this kind of spending. Citizens may prefer these highly targetable goods because they receive the whole of the particularistic benefit, but only partly share in the tax burden (e.g., Buchanan and Tullock Reference Buchanan and Tullock1962; Shepsle and Weingast Reference Shepsle and Weingast1981; Weingast, Shepsle, and Johnsen Reference Weingast, Shepsle and Johnsen1981).
Observability and Media Priming. Second, the benefits of preparedness spending may be difficult to observe and not realized immediately, whereas the benefits of relief spending are highly salient and immediate. Because citizens have been found to be disinterested in politics, and to possess little information about the specifics of public policies (e.g., Delli Carpini and Keeter Reference Delli Carpini and Keeter1996; Kuklinski et al. Reference Kuklinski, Quirk, Jerit, Schwieder and Rich2000), many may possess limited awareness of disaster preparedness policies.
In addition, the news media may be a mediating factor in what citizens observe. Because the media compete in a market, they are responsive to audience preferences (Mullainathan and Shleifer Reference Mullainathan and Shleifer2005). At the same time, they seek to gain professional prestige by reporting on issues of high societal significance. Finally, politicians attempt to influence media coverage toward stories that bolster their image (Zaller Reference Zaller1999). These mechanisms may lead journalists to publicize dramatic relief efforts after newsworthy disasters take place, while not discussing more pedestrian preparedness efforts. Because the news media have been found to have the power to set the agenda on the issues that citizens use to evaluate politicians (e.g., Iyengar and Kinder Reference Iyengar and Kinder1987; Miller and Krosnick Reference Miller and Krosnick2000), citizens may be primed to consider relief spending when evaluating government performance.
Temporal Attribution. Compared to preparedness expenditures, relief expenditures may be more easily attributable to the current administration, making it easier for the incumbent to claim credit for the spending (Chen Reference Chen2008; Mayhew Reference Mayhew1974). However, citizens may only appreciate successful preparedness expenditures after they successfully mitigate a disaster, which may be years after the incumbent leaves office. Hence, politicians may not be able to claim credit for preparedness projects.
Counterfactual Calculation. Citizens may weakly respond to preparedness projects because it is impossible for them to observe an important counterfactual: what would have been the impact of the disaster in the absence of the preparedness spending? Conversely, the counterfactual of relief spending is clearer. Individuals can more easily calculate the utility gains of receiving transfer payments.
Shortsightedness. Scholars of public choice have often pointed to “the shortsightedness effect,” or the observation that public policies are often inefficient because politicians are incentivized to enact policies with short-term benefits and larger, long-term costs because of imminent reelection pressures (Gwartney et al. Reference Gwartney, Stroup, Sobel and Macpherson2008; Sobel and Leeson Reference Sobel and Leeson2006). Constituents may reward incumbents in the current election cycle for immediately enjoyed relief payments, but not for preparedness spending, because the associated benefits may occur with a lag. Moreover, citizens may heavily discount the future, meaning that they have preferences for shortsighted policies (Achen and Bartels Reference Achen and Bartels2004b).
EMPIRICAL STRATEGY AND DATA
Data
We analyze data on voting behavior, disaster damage, and federal government spending for the 3,141 counties or county-equivalent units in the United States.Footnote 4 All regressions are run at the county level, and include both county and year fixed effects. We describe each of the data sources in detail in the Appendix, and we briefly introduce those sources here.
For the voting data, we focus on presidential election results because the executive branch has substantial control over providing relief and preparedness spending via FEMA and other agencies (Schneider Reference Schneider2008). To cover the same time frame as is encompassed by the spending data, we use the 1988 through 2004 election results to construct the dependent variables in the voting regressions. The 1984 election results are also included in the analysis because some of the regressions include the incumbent party's vote share in the previous election as a control. The election results from 1992 to 2004 come from Congressional Quarterly's Voting and Elections collection. The 1984 and 1988 results are from the Inter-university Consortium for Political and Social Research (ICPSR).
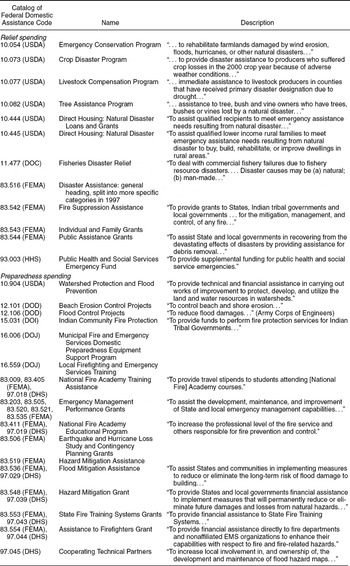
The spending data come from the Census Bureau's Consolidated Federal Funds Report (CFFR). The CFFR describes all federal expenditures in “the following categories: grants, salaries and wages, procurement contracts, direct payments for individuals, other direct payments, direct loans, guaranteed or insured loans, and insurance.”Footnote 5 Each spending item includes the county in which the expenditure occurs and a five-digit code to identify the purpose of the spending. The first two digits of the spending code identify the agency (e.g., FEMA) doing the spending. The entire five-digit code describes the program under which the allocation was made. The Catalog of Federal Domestic Assistance (CFDA) contains names for each of the spending codes and more detailed descriptions of the spending programs in most cases. The catalog descriptions make it possible to identify both disaster relief spending and disaster preparedness spending.
In Table 1, we describe all programs that we have classified as relief or preparedness spending for which there are observations in the data, including the program name and, if it is available, a brief description of the program that is excerpted from the full description available from the CFDA. For some spending codes that appear to be disaster relief or preparedness, no expenditures actually occurred, and so we do not list those expenditure categories. As Table 1 shows, many of these expenditures were made by FEMA, but there are also expenditures from the Department of Commerce (DOC), Department of Health and Human Services (HHS), and six different expenditure categories under the U.S. Department of Agriculture (USDA).
Disaster Spending and Relief Categories

Note: (1) The agency codes are USDA, U.S. Department of Agriculture; DOC, Department of Commerce;
FEMA, Federal Emergency Management Administration; HHS, Health and Human Services;
DHS, Department of Homeland Security, DOI, Department of the Interior; DOJ, Department of Justice.
The top panel of Table 1 refers to relief spending items, most of which consists of direct payments made to individuals, such as payments to farmers to compensate them for crop losses caused by natural disasters.Footnote 6 The relief spending is ex-post in that it deals with the consequences of a disaster. As the headings suggest, these spending items would not be expected to have spillover mitigation effects, an expectation that is confirmed by the empirical results showing that relief does not affect future damage. Some, but not all, of the expenditure categories require a presidential disaster declaration. The bottom panel of Table 1 describes the government's ex-ante expenditures to either prepare for disasters or mitigate their impacts. These preparedness spending categories include items to increase flood protection, training of firefighters, and contingency planning for earthquakes and hurricanes. Preparedness spending consists of all spending under the categories described in Table 1 allocated in the three years preceding an election, and we also separately examine individual spending items that start and end within those three years.
All spending data is at the county level. This is sensible because the executive branch has significant discretion in specifying narrow geographic boundaries for disaster-affected areas (Schneider Reference Schneider2008). In the analysis, we focus on the aggregate relief and preparedness spending that the federal government allocates in a given unit of time.
Following the September 11 attacks, there was a dramatic increase in preparedness spending devoted to firefighting under the Assistance to Firefighters Grant Program. Although the vast majority of these grants were administered by the Department of Homeland Security's Office for State and Local Government Coordination and Preparedness, which is responsible for coordinating preparation for terrorism, many of the purchases made under the program could also be useful in dealing with natural disasters. Because it is unclear whether these expenditures should be included in preparedness spending for natural disasters, we conducted our analyses both including and excluding these expenditures. We present summary statistics that both include and exclude this spending, but exclude it when estimating the regression models. The parameter estimates are very similar to those obtained by including the grants, both in terms of statistical significance and substantive meaning.Footnote 7
One concern about our focus on federal preparedness is that states sometimes engage in preparedness spending, and therefore, voters may reward state officials as opposed to federal officeholders for preparedness expenditures. Moreover, federal grants to the states may be directed by subnational governments, meaning that state and local governments should be held responsible by voters. We are not greatly concerned by these possibilities for two main reasons. First, federal disaster preparedness grants are, by and large, narrowly targeted to particular geographic areas (Birkland and Waterman Reference Birkland and Waterman2008). Second, the bulk of state spending comes in the form of matching grants for federal expenditures (Carafano and Mayer Reference Carafano and Mayer2007; Jordan Reference Jordan2006). In sum, disaster preparedness and management is a coordinated effort in the United States, both fiscally and logistically. During the time period examined in this analysis, the federal government has maintained a significant role in disaster mitigation, preparedness, relief, and recovery in the wake of the Stafford Act of 1988. Still, we examined the possibility that state officials are rewarded for federal relief and preparedness expenditures. Those results (not reported) show that voters do not significantly reward governors for federal relief or preparedness spending.
To supplement the spending data, we use the comprehensive data on natural disasters contained in the Spatial Hazard Events and Losses Database for the United States (SHELDUS), collected by the Hazards and Vulnerability Research Institute at the University of South Carolina. The database contains estimates of the amounts of damage to property and crops caused by natural disasters. Among the events included in the data are severe thunderstorms, earthquakes, hurricanes, tornadoes, fires, and floods. All events that caused damages of at least $50,000 are included in the database.
We combine the voting, spending, and disaster damage data in each county for which it is possible to do so.Footnote 8 For some disasters, the SHELDUS database does not break damage down by county. For example, if a disaster affected ten counties and caused a total of $1 million in damage and two fatalities, the database will simply express damage as $100,000 and fatalities as .2 for each of the ten counties. Because damage is apportioned evenly for the ten counties, this has the effect of making per-capita damage appear larger for small counties, as they are allocated the same amount of damage as larger counties, with the damage being spread out over fewer people. To deal with this issue, we have taken the total damage associated with each individual disaster and apportioned it according to the population in each affected county. Continuing with the previous example, if a county has 1% of the combined population in the ten affected counties, we would assign 1% of the damage (here, $10,000) to that county. Our results remain essentially the same whether we use this measure of damage or the measure obtained by apportioning damage equally to all affected counties.
Empirical Strategy
To estimate a county's preferences for the incumbent party at time t, we use the percentage of the presidential vote for the incumbent party in the county, c, which we denote by IncumVotect. Results are nearly identical using the incumbent party's share of the two-party vote, which is to be expected because we include year fixed effects that will account for the overall strength of third-party opposition in a given year.
To measure disaster relief spending, we use the total relief spending in a state in the three years preceding an election. Total relief spending is the sum of all spending in the expenditure categories listed under relief spending in Table 1. To deal with the heavy skew in the spending measures, we follow other authors (e.g., Ansolabehere, Gerber, and Snyder Reference Ansolabehere, Gerber and Snyder2002) and convert the spending measures into logarithms. The spending measure that we use is the logarithm of per-capita spending plus one. The one is added so that, when we take the logarithm, the relief spending measure is mapped back to zero for the case of zero spending. In equation form, where RelSpend is relief spending in inflation-adjusted January 2008 dollars and Population is the county's population, we use the following measure of relief spending:

We operationalize preparedness spending and disaster damage similarly, again considering the amounts in the three years preceding the election. We consider spending and damage three years before the election because we are interested in estimating how effective preparedness spending is in preventing future damage, and we want to consider preparedness spending that takes place beyond just election years. However, because evidence suggests that it is election-year economic conditions that influence voters’ decisions (Achen and Bartels Reference Achen and Bartels2004b; Fair Reference Fair1978), it is reasonable to expect that spending and disaster damage in the year immediately before the election might particularly affect voting behavior. Due to this possibility, we also considered specifications that included only spending and damage in the year preceding the election. Those results (not reported) are similar to those reported in this article, with the estimated effect of relief spending being nearly the same and the estimated effect of damage being somewhat, but not significantly, larger.
To model the voting decision, we start by extending the baseline model that many previous researchers (e.g., Achen and Bartels Reference Achen and Bartels2004b; Markus Reference Markus1988, Reference Markus1992; Nadeau and Lewis-Beck Reference Nadeau and Lewis-Beck2001; Partin Reference Partin1995) have used, allowing for a voter's decision to depend specifically on the actions that the government takes with respect to disaster relief and preparedness. We aggregate the individual voting decision to the county level for estimation purposes. We estimate the following equation for the five presidential elections from 1988 to 2004:
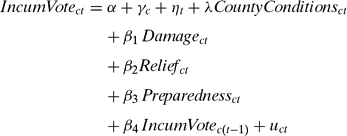
To account for time-invariant county characteristics, we include county fixed effects, γc, in each regression. To control for national-level conditions in a given year, such as the identity of the incumbent party and the national growth rate in personal income, we include year fixed effects, ηt. The inclusion of the county and year fixed effects ensures that our coefficients of interest are identified by variation in spending at the county level in a given election cycle. In our basic specifications, we include the fixed effects, the damage and spending variables, and the incumbent party's previous vote share in the county.Footnote 9
RESULTS
Trends in Relief and Preparedness Spending
Natural disasters of some type affect most of the country, and the amount of damage they cause is substantial. For 95% of the county-election observations in the data, there is at least one event causing damage of $50,000 or more during the three years before an election. In some locations and at certain times, disaster damage is small, and no federal relief spending occurs. Federal relief spending is positive for 45% of the county-election observations in the data set. Preparedness spending is positive for 35% of the observations in the data set. From 1985 to 2004, the average annual damage caused by natural events to property and crops averaged $16.5 billion per year (in January 2008 prices). Over the same set of years, the federal government spent an average of $3.05 billion on disaster relief and $195 million on disaster preparedness annually.
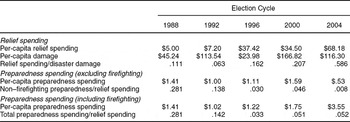
The disparity between the amount that the government spends on disaster relief and the amount that it spends on disaster preparedness has grown considerably since 1988. As shown in Table 2, per-capita relief spending was $5.00 in the three years preceding the 1988 election. By the 2004 election cycle, relief spending had increased to $68.18 per person. If we consider the amount spent on relief by the federal government per dollar of disaster damage, this ratio increased more than five times from .111 for the three years preceding the 1988 election to .586 for 2004.Footnote 10 In other words, in the years preceding the 2004 election the federal government spent $.59 in relief for every dollar in disaster damage, whereas it only spent $.11 in the years before the 1988 election.
Damage and Spending over Time

Note: Election cycle refers to the three fiscal years preceding an election. For example, the measures for the 1988 election cycle include all spending from October 1, 1985 to September 30, 1988.
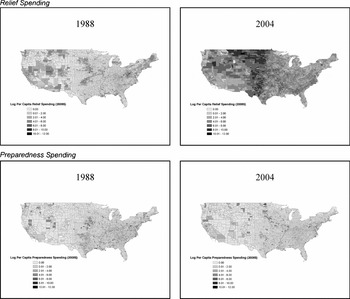
These patterns are illustrated geographically in Figure 1, which also shows a very different pattern for preparedness spending. In 1988, relief spending exceeded preparedness spending across the country, but this gap had widened by 2004, particularly in the Midwest and Southeast.Footnote 11 Expenditures on hurricane, flood, and earthquake preparedness (excluding firefighting expenses) fell during the sample period. Per-capita preparedness spending was $1.41 in the years preceding the 1988 election, somewhat lower during the following two election cycles, and it then increased to $1.59 for 2000 before falling to $.53 for 2004. A shift in priorities toward responding to terrorism appears to explain the fall in natural disaster preparedness spending during the first term of the Bush Administration. If we include spending under the Assistance to Firefighters grant program (most of which was related to terrorism) in our overall preparedness measure for the 2004 election cycle, we find that per-capita preparedness spending increased to $3.55 during Bush's first term. Even this increase is still much smaller than the rise in disaster relief spending over the same time period. After spending $.28 in preparedness for every dollar spent on relief during the 1988 election cycle, the federal government spent only $.05 on preparedness for every dollar spent on relief in the 2004 election cycle. If firefighting spending is excluded from preparedness, spending fell precipitously in the 2004 election cycle to only $.01 on preparedness for every dollar spent on relief.
Time Trends for Relief and Preparedness Spending

Qualitative evidence suggests reasons for these trends. Walters and Kettl (Reference Walters and Kettl2005) interviewed disaster management experts, who noted that the federal role in disaster response and recovery has greatly expanded since the 1980s, principally due to a series of major disasters between 1989 and 1992. Our interviews with FEMA officials in the Oakland regional office indicated that the increasing focus on relief instead of preparedness arose in part because criticism of the federal government's handling of events such as the Loma Prieta earthquake and Hurricane Andrew focused on failures in assisting victims ex-post.Footnote 12
The Value of Preparedness
Depending on the effectiveness of government preparedness efforts, the shift in priorities from preparedness to relief may be accompanied by significant efficiency losses. Here, we attempt to estimate the effectiveness of previous government projects aimed at preparing for or mitigating damage from natural disasters. To estimate the effectiveness of government preparedness spending, we regress disaster damage in a county on preparedness spending during the previous two election cycles, as well as county and year fixed effects. We also consider a specification that includes relief spending and damage during the previous two election cycles as additional independent variables. The inclusion of relief spending in the regression makes it possible to test the hypothesis that relief itself may mitigate future damage. Lagged damage was included because preparedness is higher in places that previously experienced disasters. Therefore, without a control for lagged damage, the coefficient for preparedness will capture both the effect of preparedness spending on damage and the mean reversion that takes place in damage.
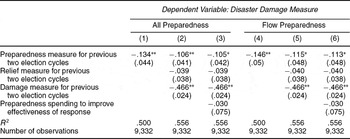
Preparedness spending has led to significant reductions in disaster damage. In the first column of Table 3, the coefficient estimate of −.134 indicates that a 1% increase in preparedness spending during the previous two election cycles led to a .134% reduction in damage during the current cycle. This estimate is somewhat smaller, but is still significant, when we include relief spending and previous damage as control variables (see the second column of Table 3). These results also show that relief spending has no significant effect on future damage and that, not surprisingly, there is significant mean reversion in disaster damage, as indicated by the negative coefficient for lagged damage. The coefficient for preparedness is −.106, suggesting that a 1% increase in preparedness spending during the previous two election cycles led to a .106% reduction in damage during the current cycle. We find a similar estimate when we separately control for the preparedness spending that is intended to increase the effectiveness of response, such as first responder training (see column three). Our estimates suggest that it is other kinds of preparedness spending and not relief-related spending that reduces future damage.
Value of Preparedness Spending

Notes: (a) Standard errors are corrected for clustering at the county level.
(b) Each regression includes county fixed effects and year fixed effects.
(c) The categories that are identified as preparedness that improves the effectiveness of response are 16.006, 16.559, 83.009, 83.405, 83.203, 83.505, 83.520, 83.521, 83.535, 83.506, 83.553, and 97.043.
(d) *p < .05, **p < .01 (two-tailed).
Using the estimate of the impact of preparedness spending on future damage in column (3), we can estimate the value of a dollar of preparedness spending. The coefficient estimate of −.105 suggests that a $1 increase in preparedness spending resulted in approximately a $7.37 decrease in disaster damage, and this estimate captures only the reduction in damage that occurs during a single election cycle.Footnote 13 We can use this figure to estimate the net present value (NPV) of a dollar of preparedness spending in terms of reduced future damage from natural disasters. This estimate of the total benefit of a dollar of preparedness spending represents all future reductions in damage, where those benefits are discounted for the fact that resources invested today in other ways could have yielded their own return and that preparedness investments will depreciate, becoming less effective over time. Assuming a 4% annual interest rate and a 6% depreciation rate for preparedness investments, we estimate the NPV of $1 of disaster preparedness to be about $15.Footnote 14
In columns (4) through (6), we consider the effectiveness of preparedness projects that were started and completed within a single presidential term. We refer to this sort of spending as flow preparedness. We break down preparedness spending in this manner because in later tables we estimate the effect that within-term preparedness spending has on voting behavior. Approximately 45% of total preparedness spending falls into the flow category. The results in columns (4) through (6) show that this sort of preparedness spending is about equally successful in mitigating future damage as overall preparedness spending.
Although our estimates strongly suggest that preparedness spending reduces a substantial amount of future damage, it is important to note that the estimated effect represents the average effect of preparedness spending on disaster damage. If the government pursues only the most urgent preparedness projects, the marginal effect associated with the government pursuing the best project that it currently ignores will be somewhat less than the average effect. Nevertheless, the results clearly demonstrate that preparedness spending significantly reduces future losses. Consistent with the anecdotal evidence on recent government failures to adequately prepare for disasters, our findings strongly suggest that there are large efficiency losses associated with underinvestment in disaster preparedness.
The Determinants of Disaster Spending
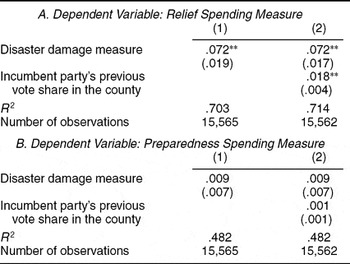
Before describing the effects that relief and preparedness spending have on voting behavior, we first examine the determinants of spending. We regress our relief and preparedness spending measures on disaster damage, the incumbent party's previous vote share in the county, and county and year fixed effects. The county fixed effects account for a given county's average exposure to natural disasters. We include the incumbent party's previous vote share to account for the fact that more government spending on disasters may be directed to areas that provide more electoral support to the incumbent party (Chen Reference Chen2008).
Government relief expenditures are significantly affected by disaster damage, as one would expect. As shown in the first column in the top panel of Table 4, when disaster damage increases by 1%, the regression results suggest that relief expenditures increase by .072%, on average. There appears to be a significant political component to disaster relief spending as well. As shown in the second column, counties that more strongly supported the incumbent party in the previous election received more relief spending than did other counties. The effect of previous vote share on spending is substantial and highly significant (p < .001). The coefficient of .018 indicates that a one percentage point increase in the incumbent's previous vote share in the county leads to an average increase of 1.8% in the amount of relief spending that a county receives. Hence, incumbents are either more prone to respond to disasters that occur in supportive counties, or they dress up other transfers in the guise of disaster relief and then direct those payments to supportive areas.Footnote 15 In contrast to relief spending, preparedness spending does not significantly respond to disaster damage (see bottom panel of Table 4).Footnote 16 Counties that supported the incumbent party are not significantly more likely to receive disaster preparedness spending, and the point estimate is close to zero. The fact that the effect of political considerations is much smaller for preparedness spending than for relief spending makes sense in light of the results that follow, which suggest that voters do not, in general, value preparedness spending.
Determinants of Disaster Spending

Notes: (a) Standard errors are corrected for clustering at the state * year level.
(b) All regressions include county and year fixed effects.
(c) *p < .05, **p < .01 (two-tailed).
Voter Responses to Relief and Preparedness Spending
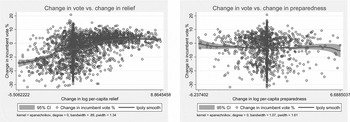
A visual inspection of spending and voting patterns reveals inconsistency in political accountability. We first present the raw data, examining the general shape of the relationship between disaster-related expenditures and incumbents’ reelection prospects. In Figure 2, we plot the change in the incumbent party's county-level vote share from the previous election to the current one against the changes in relief and preparedness spending in the county. We observe a positive relationship between changes in incumbent vote share and changes in relief spending. The relationship between changes in the incumbent party vote share and changes in preparedness spending is, in contrast, nearly flat.Footnote 17 We confirm these general patterns via nonparametric regression curves.Footnote 18
Scatterplot for Change in Incumbent Vote Share and Changes in Disaster Spending

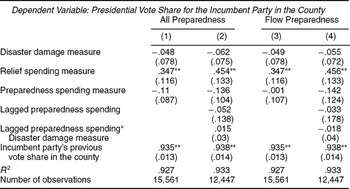
The figures suggest a relationship, and potentially a strong one, between voter decisions and relief spending, as well as the absence of such a relationship between voting decisions and preparedness spending. Table 5 presents the results of regressions that subject these apparent relationships to a variety of controls. The first column reports the results obtained by including county and year fixed effects in a regression of incumbent party vote share on disaster damage, relief spending, preparedness spending, and the incumbent party's previous vote share in the county. The second column expands the regression to include lagged preparedness spending as well as an interaction between lagged preparedness spending and disaster damage. Because preparedness spending has been shown to reduce damage, including the interaction between lagged preparedness and damage allows us to account for the fact that damage is endogenous to previous preparedness spending. In the third and fourth columns, we consider analogous regressions that use the flow measure (spending on projects completed within a single presidential term) as the preparedness variable.
Voter Responses to Relief and Preparedness Spending

Notes: (a) Standard errors are corrected for clustering at the state * year level.
(b) All regressions include county and year fixed effects.
(c) *p < .05, **p < .01 (two-tailed).
Although we are primarily interested in the spending coefficients, we first note that damage enters insignificantly in all specifications, but its negative sign suggests that disaster damage may have some negative effect on the incumbent party, consistent with Achen and Bartels (Reference Achen and Bartels2004a).Footnote 19 Consistent with the figures, the results for spending in the first two columns indicate that increases in relief spending significantly predict increases in the incumbent party's vote share (p = .003 in column (1), p = .001 in column (2)), whereas preparedness spending has no significant effect, and the point estimates are close to zero. When we consider the flow measure of preparedness, the coefficient for relief remains highly significant, and preparedness continues to have no significant effect. Comparing the coefficients associated with the spending variables via an F-test, the null hypothesis that relief and preparedness spending have the same effect on incumbent vote share can be rejected (p < .001 in columns (2) and (4)) in all specifications.
In column (2), the size of the coefficient for relief spending of .454 indicates that, on average, a 1% increase in relief spending—an increase of about .01 in the log of relief spending—increases the incumbent party's vote share by about .0045 percentage points. The t-statistic for this effect of 3.42 indicates that the relationship between relief spending and voting decisions is strongly significant. The estimated coefficient confirms the visual evidence in Figure 2, indicating that large increases in relief spending lead to substantial vote gains for the incumbent party. If the incumbent party increases relief expenditures in a county from $1 per person (the 66th percentile for spending in the data) to $10 per person (the 93rd percentile in the data), the regression results suggest that the incumbent party will gain about .77 percentage points in the county.Footnote 20 Another way to think about this effect is in terms of the amount of disaster spending required to buy an additional vote. The coefficient estimate suggests that about $27,000 in relief spending buys one additional vote.Footnote 21 This estimate is of a similar magnitude to the $21,000 that Chen (Reference Chen2008) found it cost President Bush to purchase a vote in moderate precincts with disaster relief in response to the Florida hurricanes in 2004.Footnote 22
We also tested some of the mechanisms described previously. Detailed results for each of these tests are available on request. As shown in the third and fourth columns of Table 5, the coefficient estimate on preparedness spending is small and insignificant regardless of whether we consider the overall amount or the flow measure. The fact that voters do not reward preparedness projects even when they are confined to a single presidential term suggests that the temporal attribution mechanism may not be a primary determinant of why voters do not respond to preparedness spending in general.
To investigate the shortsightedness mechanism, we examined the effect of relief and preparedness spending in just the year before the election and found that the effect sizes are similar to those obtained using a three-year horizon. The fact that the results are consistent across different lag structures suggests that the shortsightedness mechanism likely does not explain voter responses.
To consider the possibility that only the largest preparedness projects are observed by the voters, we estimated regressions that allowed for nonlinearities in the relationship between spending and election outcomes. We found no evidence that voters respond to preparedness above some threshold. Hence, observability as measured by project size appears not to explain the flat relationship between incumbent vote share and preparedness spending. We are, however, unable to assess observability as a function of media attention and priming because we do not have a measure of media coverage. Future research could potentially use content analysis to investigate this aspect of the observability mechanism in greater detail.
Finally, we considered a variety of control variables and robustness checks to these basic regression results. As controls, we included terms for the percentage nonwhite in the county, an interaction between the percent nonwhite and the identity of the incumbent party, per-capita income in levels, per-capita income growth, and overall per-capita federal government expenditure. One specification check we considered included controls for relief and preparedness spending in the nearest five counties because preparedness spending could have spillover effects that help reduce damage in nearby areas.Footnote 23 We also tested the robustness of our results by analyzing the data using propensity score matching, employing Imai and Van Dyk's (Reference Imai and Van Dyk2004) procedure for continuous treatment variables. Across the different specification checks, the results of interest remain essentially unchanged. The coefficients for relief and preparedness remain nearly the same in terms of magnitude and exactly the same in terms of statistical significance.
Collectiveness as an Explanatory Mechanism
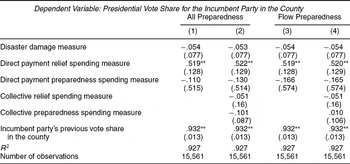
We next explore in depth a potential mechanism underlying the results: voters reward relief spending but not preparedness spending because relief spending generally comes in the form of direct, individual-level payments, whereas preparedness usually comes in the form of collective goods. Most of the spending codes are easily identified as representing direct payments to individuals or some other form of expenditure. For example, the Crop Disaster Program (10.073) provides “disaster assistance to producers who suffered crop losses,” and we code this program as providing direct payments to individuals. In contrast, the Public Assistance Grants (83.544) “assist state and local governments in recovering from the devastating effects of disasters by providing assistance for debris removal,” and we code that program as being a form of collective relief expenditure.
Some codes either include both expenditures with individual and collective benefits or are ambiguous as to the kinds of expenditures associated with the program. An important example in our data is the general heading “Disaster Assistance” (83.516), which was split into a variety of more specific headings in 1997. For these programs, we use another data source, the Federal Assistance Awards Data System (FAADS), to estimate the share of payments in a county in a given election cycle that was directed to individuals. The Consolidated Federal Funds Report, on which the preceding tables are based, is constructed from a variety of data sources, one of which is the FAADS. The FAADS contains a variable that describes the recipient type (e.g., state government, private business, or individual) for the expenditures that the federal government makes. For all election cycles where the FAADS contains data on the expenditures made in a county for a given program, we assign the share of payments made to individuals in the FAADS to be the share of total payments made to individuals for our spending data. For example, if $10 per capita was spent in a county in the 1992 election cycle under program 83.516, and we estimate from the FAADS that 90% of the expenditures in the 1992 election cycle in that county under program 83.516 were expenditures directed to individuals, then we assign $9 per capita to be direct payments to individuals.Footnote 24
The results suggest that voters respond only to relief spending that consists of direct payments to individuals, thereby providing some support for the collectiveness mechanism. In Table 6, we report the results obtained by estimating the different effects that relief and preparedness spending have on vote share by whether the expenditures are individually targeted as opposed to being collectively targeted. The coefficient on collective relief spending is statistically indistinguishable from zero, and the point estimate is small in magnitude. Conversely, the coefficient estimate for individually targeted relief spending is large and statistically significant across all specifications.
Voter Responses to Individual and Collective Spending

Notes: (a) Standard errors are corrected for clustering at the state * year level.
(b) All regressions include county and year fixed effects.
(c) The following codes are classified as direct payments to individuals: 10.054, 10.073, 10.077, 10.082, 10.444, and 83.543. The following codes are classified as collective payment programs: 10.904, 12.101, 12.106, 16.006, 16.559, 83.203, 83.505, 83.506, 83.519, 83.520, 83.521, 83.535, 83.536, 83.542, 83.544, and 83.548. The Federal Assistance Award Data System was used to identify the type of spending for 11.477, 15.031, 83.009, 83.405, 83.411, 83.516, 83.553, 93.003, 97.018, 97.019, 97.029, 97.039, 97.043, 97.044, and 97.045. For one case (La Paz County, Arizona, for the 1988 election cycle), we were not able to assign any spending to either individual or collective aims.
(d) *p < .05, **p < .01 (two-tailed).
At the same time, voters appear not to reward preparedness spending even when the benefits are particularistic. As shown in Table 6, the point estimates for individual and collective preparedness expenditures are similar in size, and both are close to and not significantly different from zero. We caution against making strong statements here because only .4% of preparedness expenditures were targeted to individuals, leading to a large standard error on our coefficient for the effect of individual preparedness spending.
To summarize, we find partial support for the collectiveness mechanism as an important determinant of voter behavior. Voters only value relief when those expenditures are individually targeted, but appear not to value preparedness spending under any circumstances. We found evidence inconsistent with many of the other theoretical mechanisms described previously. Voters treat flow preparedness expenditures no differently than total preparedness expenditures, suggesting that they are not misattributing mitigation measures from previous administrations. Government spending undertaken the year before the election has a similar effect on incumbent vote share as does spending undertaken over the past three years of an administration, meaning that voters do not appear to be particularly shortsighted in the domain of natural disaster spending. Finally, voters are not responsive to larger (and potentially more observable) preparedness and mitigation initiatives.
The Cost of Imperfect Retrospection
Consistent across all results is the finding that voters reward relief spending, but not preparedness spending. What is the cost associated with this behavior? Here, we consider a back-of-the-envelope calculation that gives some idea of the loss in public welfare.
As an example, we consider 2000, the median election cycle in the data for the ratio of relief spending to preparedness spending. In that cycle, per-capita relief spending was $34.50 and per-capita preparedness spending was $1.59. Suppose that just $1 per-capita is added to preparedness, a total increase of about $291 million that would still leave the federal government spending more than ten times as much on relief as on preparedness.Footnote 25 Subtracting the $1 cost of the investment, the approximately $15 reduction in future damage yields a welfare gain of $14 from the increase in preparedness. Our estimates therefore suggest that voters would realize a welfare gain of about $4.07 billion from the $291 million increase in preparedness spending. This calculation assumes that marginal increases in spending will continue to have the same effect as earlier increases, when it is likely to be the case that the earlier increases will be more powerful than the final ones because the government is likely to pursue the most pressing projects first. Still, it is clear that even a modest political incentive for preparedness spending—enough to cause politicians to increase preparedness by just $1 per capita—would likely increase social welfare by billions of dollars.
Although increased preparedness efforts to reduce damage from natural disasters would substantially increase social welfare, we do not know the optimal mix of relief and preparedness expenditures to maximize efficiency. Indeed, relief spending is important, and our results do not imply that it is inefficient for the government to assist citizens after a disaster takes place or even that relief aid should be reduced in terms of levels, given than some negative effects of disasters are inevitable. The fact that voters reward politicians who provide it is a sign of competent responsiveness. However, the fact that preparedness spending has virtually no electoral utility is clearly suboptimal. It appears that voters incentivize politicians to at least get the ratio of preparedness to relief wrong.Footnote 26
DISCUSSION
A government responding to the incentives implied by our results will underinvest in natural disaster preparedness. The inability of voters to effectively hold government accountable thus appears to contribute to significant inefficiencies in government spending because the results show that preparedness spending substantially reduces future disaster damage. Voters are, in a word, myopic. They are not, as we have shown, myopic in the sense that they respond more to spending just before an election than to spending a year or two earlier; rather, they are myopic in the sense that they are unwilling to spend on natural disasters before the disasters have occurred. An ounce of prevention would be far more efficient than a pound of cure, but voters seem interested only in the cure. The resulting inconsistencies in democratic accountability reduce public welfare by discouraging reelection-minded politicians from investing in protection, while encouraging them to provide assistance after harm has already occurred.
Although we consider our findings to be relevant to potential underinvestments in preparedness in areas beyond natural disasters such as preventive medicine, the government almost certainly does not underinvest in all kinds of preparedness. For example, after the attacks on September 11, large investments were made in preventing future attacks on passenger jets. One clear difference between airport security and most natural disaster preparedness measures is that airport security is highly observable and salient. Moreover, this example may be the exception that proves the rule we have demonstrated in this article. When voters provide their elected officials with incentives to make mistakes—ranging from insufficient investment in natural disaster preparedness to perhaps excessive attention to airline security—elected officials are likely to provide the inefficient policies that voters implicitly reward.
Moreover, it is possible that major events such as Hurricane Katrina can heighten the value of natural disaster preparedness, but this effect may be temporary. For example, California passed Proposition 1E in 2006, a measure that provided bond financing for $4.1 billion in flood control measures, with $3 billion for upgrades to levees in the Central Valley, an area considered by experts to be exposed to catastrophic flooding due to insufficient protection from the existing levee network. Experts characterized the situation as a “ticking time bomb” in January 2005 (California Department of Water Resources 2005). The bond proceeds were to be used to obtain federal matching funds for the projects, in addition to financial and technical assistance from federal agencies such as the Army Corps of Engineers.
Despite repeated warnings about the risk of severe flooding in the Central Valley, large-scale action was implemented only after Hurricane Katrina made the danger salient. The importance of Hurricane Katrina in ensuring support for Proposition 1E is suggested by the short argument that supporters of the measure included on the ballot. The argument read, “Our nation learned a tragic lesson from Hurricane Katrina—we cannot continue to neglect our unsafe levees and flood control systems” (California Attorney General 2006). The measure passed easily, winning 64% of the vote, including 67% of the vote in Los Angeles County and 56% of the vote in relatively conservative Orange County, despite the fact that neither would be affected directly by the bulk of the proposed spending. For voters in these areas, it appears to be the case that levee repair became a public good that voters were willing to support after Hurricane Katrina made clear the potential costs of inaction.Footnote 27
A similar phenomenon appears to have occurred at the federal level. Following Hurricane Katrina, Congress passed and President Bush signed the Post-Katrina Emergency Reform Act of 2006, which reorganized FEMA and appropriated $3.6 billion for levees and other flood control measures.Footnote 28 In the immediate aftermath of Katrina, voters in New Orleans also appear to have placed greater value on these preparedness projects. In late 2006, 30% of New Orleans residents said that “repairing the levees, pumps, and floodwalls” should be one of the top two priorities in the rebuilding efforts, ranking this item and crime control as their top two concerns (Kaiser Family Foundation 2007, 55). The increased voter concern for disaster protection appears to have faded significantly since then. By mid-2008, only 2% of New Orleans voters ranked “hurricane protection/rebuilding floodwalls, levees” as the top rebuilding concern (Kaiser Family Foundation 2008, 52). This apparent change in priorities for New Orleans residents suggests that even an event like Hurricane Katrina is likely to increase the salience of preparedness issues only temporarily.
Interestingly, the case of Hurricane Katrina may be anomalous with respect to the electoral benefits of relief spending. The federal government delivered more than $94.8 billion in relief payments to the Gulf Coast following Katrina (Congressional Budget Office 2007), and the Republican Party suffered heavy losses in the 2006 and 2008 elections. Unlike most disaster events, Hurricane Katrina was highly unique in the substantial amount of media coverage it received. In an Associated Press poll of U.S. news editors and in the Pew Research Center U.S. News Interest Index, Hurricane Katrina was the top world story of 2005 (Kohut, Allen, and Keeter Reference Kohut, Allen and Keeter2005), and most of this coverage focused on the mishandled immediate logistical response to the disaster as opposed to the generous financial response that came later. Hence, voters may have been substantially affected by the early negative media coverage and carried those initially formed attitudes about the administration's competence with them into the voting booth. Nevertheless, the case of Katrina offers two potential extensions to this research. Subsequent studies can explore how the salience of a disaster changes the political effectiveness of relief spending, in addition to more closely examining how logistical response differs from financial response.
Due to the transience of the effect that disasters have on the visibility of preparedness, it is important to note that there is some suggestive evidence that governments may be able to take action to make preparedness salient to voters in a more permanent fashion. In the late 1990s, FEMA introduced Project Impact, a grass-roots disaster preparedness initiative that emphasized collaboration between government, businesses, and local community leaders, bypassing state governments (Birkland and Waterman Reference Birkland and Waterman2008; Wachtendorf and Tierney Reference Wachtendorf and Tierney2001; Witt Reference Witt1998). Under Project Impact, FEMA selected a group of 57 communities from all 50 states (as well as Puerto Rico and the District of Columbia) to receive either $500,000 or $1-million grants to pursue disaster preparedness and mitigation initiatives (Government Accounting Office 2002). The program targeted areas of varying size and disaster risk. Interviews with participants in the program indicate that people valued the program. It was also credited with helping limit damage from the February 2001 Nisqually earthquake in the Puget Sound, ironically on the very day that the program was cancelled by the Bush Administration (Holdeman Reference Holdeman2005). Compared to other counties, the change in the Democrats’ vote share from 1996 to 2000 was 1.9% higher in Project Impact counties, a significant difference (p = .006) (Healy and Malhotra Reference Healy and Malhotra2009). This estimate is only suggestive of the possibility that voters may have responded to Project Impact because it is not possible to control for the omitted variables that could be driving this difference.Footnote 29 Future scholarship could use surveys, as well as lab and field experiments, to determine the extent to which voter decisions can be influenced by government efforts at increasing the salience of issues and policies in areas such as disaster preparedness.
Although our results indicate that the incumbent presidential party has not been rewarded for investing in disaster preparedness, it is possible that voters could credit members of Congress for those initiatives. A natural extension to this analysis is to explore whether similar effects are observed in House and Senate elections. We conducted a preliminary exploration of this question by estimating analogous models predicting the vote share for the incumbent Senate party in the county as the dependent variable. For a variety of potential reasons, we did not obtain precise coefficient estimates from which to draw firm conclusions.Footnote 30 Across all specifications that we considered, though, preparedness spending entered with a near-zero coefficient. We anticipate that future research more closely examining Congressional elections will find that members of Congress, like presidents, are not rewarded for preparedness spending.
Subsequent research could also apply our empirical strategy of simultaneously examining voting decisions, government policy, and associated outcomes to issues such as education or health care, as well as explore potential ingredients for improved retrospection. A more complete understanding of how citizens value preparedness and relief across a variety of domains could both advance our theoretical understanding of retrospective voting and help inform policy making. Through an analysis of voter responses to disaster relief and preparedness spending, we have addressed outstanding questions in the long-standing and extensive literature on citizen competence in democratic societies. Examining actual decisions by the electorate, we found heterogeneity with respect to the public's responsiveness to various government policies. However, we have also shown that the mere presence of responsiveness does not necessarily indicate citizen competence and that failures in accountability can lead to substantial welfare losses.
APPENDIX: DATA SOURCES
Elections Data: For 1984 and 1988, the county-level voting data come from General Election Data for the United States, 1950–1990, a database held at the ICPSR. For 1992–2004, the voting data are from Congressional Quarterly's Voting and Elections Collection.
Natural Disaster Data: The data on natural disaster events and damages for 1984–2004 come from the Spatial Hazard Events and Losses Database for the United States, a database hosted by the University of South Carolina. The data can be accessed at www.sheldus.org.
Government Spending Data: The government spending data come from the Consolidated Federal Funds Report. For 1993–2004, the data come from the U.S. Census Bureau's online database: www.census.gov/govs/www/cffr.html. For 1985–1992, the data are held at the ICPSR. The spending categories are identified using the five-digit code names provided by the Catalog of Federal Domestic Assistance (www.cfda.gov). The data on per-capita federal government spending come from Historical, Demographic, Economic, and Social Data: The United States, 1790–2000, a database held at the ICPSR. The Federal Assistance Award Data System is used to identify expenditures that consist of direct payments. For 1996–2004, the Census Bureau's website has the data. For 1984–1995, we obtained data from Bickers and Stein's database (www.policydata.net).
County Income Data: The county-level income data come from the Small Area Income and Poverty Estimates constructed by the Census Bureau, primarily from the Current Population Survey. The data can be accessed at www.census.gov/hhes/www/saipe/index.html.
County Demographic Data: The data on the demographic composition of counties come from the Census Bureau's Historical Population Estimates series. The data can be accessed at www.census.gov/popest/archives/.



Comments
No Comments have been published for this article.