I. INTRODUCTION
To help control the electronic behavior of carbon nanotubes (CNTs), electron-withdrawing halogen atoms are often covalently bonded to the surface to assist in the conversion from metallic to semiconducting properties. Theoretical calculations predict that side wall fluorination yields either metallic or semiconducting nanotubes depending on the type of fluorination and composition.Reference Seifert, Kohler and Frauenheim1–Reference Park, Choi and Lee3 The reaction of diatomic molecular chlorine with CNTs has been achieved using mechano-chemical ball millingReference Barthos, Mehn, Demortier, Pierard, Morciaux, Demortier, Fonseca and Nagy4,Reference Konya, Vesselenyi, Niesz, Kukovecz, Demortier, Fonseca, Delhalle, Mekhalif, Nagy, Koos, Osvath, Kocsonya, Biro and Kiricsi5 and sonicating with chlorinated solvents.Reference Moonoosawmy and Kruse6 Chlorine atoms, generated by UV photolysis of Cl2, react more readily than chlorine molecules with the π-conjugation of multi-walled carbon nanotubes (MWCNTs) to produce a saturation level of approximately 13 at.% as observed by x-ray photoelectron spectroscopy (XPS).Reference Oliveira, Debies and Takacs7 In contrast to covalent functionalization, as observed for fluorine and chlorine, the reaction of molecular bromine with single-walled carbon nanotubes (SWCNTs) leads to doping of the CNTs, resulting in charge transfer from the π-conjugation to the electron acceptor.Reference Prasad, Sato, Enoki, Hishiyama, Kaburagi, Rao, Sumanasekera and Eklund8–Reference Park, Miyamoto, Lee, Choi, Ihm, Yu and Han12
In this study, SWCNTs were treated with UV photo-dissociation of gaseous Cl2, HCl, and HBr, where the UV radiation may interact with the π-conjugation and H atoms may add across the π-conjugation of SWCNTs to assist with bromination. Surface modification was investigated using XPS.
II. EXPERIMENTAL DETAILS
A. SWCNT powder
The SWCNT powder, purchased from Strem Chemicals, Inc., Newburyport, MA, consisted of tubes with diameters from 0.7 to 2 nm, lengths from 2 to 20 µm, and was usually present in bundles of 20 tubes. The powder was used as received and placed within a well of a quartz block having diameter and depth of approximately 2 and 1 mm, respectively.
B. SWCNT paper
Synthesis of SWCNT paper was performed using an Alexandrite laser (755 nm) vaporization process. The laser pulse was rastered using GSI Lumonics (GSI Group, Bedford, MA) mirrors over the surface of a graphite (1–2 μm) target doped with 2% (w/w) Ni (sub-micrometer) and 2% (w/w) Co (<2 μm) at an average power density of 100 W/cm2. The reaction furnace temperature was held at 1150 °C, with a chamber pressure of 9.3 × 10⁴ Pa under 100 sccm flowing Ar. The raw SWCNT soot was collected from the condensed region on the quartz tube at the rear of the furnace.Reference Raffaelle, Landi, Harris, Bailey and Hepp13 Approximately 50 mg of raw SWCNT soot was refluxed at 125 °C in 3 M nitric acid for 16 h and then filtered over a 1 μm poly(tetrafluoroethylene) (PTFE) membrane filter with copious amounts of water. The filter paper was rinsed consecutively with acetone, ethanol, 2.5 M NaOH, and H2O until the filtrate became colorless after each washing. The membrane filter was dried at 70 °C in vacuum to release the resulting SWNT paper from the filter paper. The SWCNT paper was thermally oxidized in air at 550 °C for 1 min in a Thermolyne (Barnstead/Thermolyne, Dubuque, IA) 1300 furnace. Finally, a 6 M hydrochloric acid wash for 60 min using magnetic stirring, with similar filtering steps, as described above, and thermal oxidation at 550 °C for 20 min completed the purification.Reference Landi, Cress, Evans and Raffaelle14 The 1 cm diameter SWCNT paper was attached to the top of a microscope coverslip using double-sided adhesive tape and subjected to photo-bromination and XPS analysis.
C. UV photo-chlorination and -bromination
A cylindrical photochemical cell (2.54 cm in diameter, 17.8 cm long) was constructed of Suprasil® quartz (Heraeus Quartz America LLC, Buford, GA) to allow transmission of UV radiation into the cell and fitted with a Cajon removable high vacuum stainless steel for placement and removal of the sample from the cell.Reference Sener, Entenberg, Kahn, Egitto, Matienzo, Debies, Takacs and Mittal15 The photochemical cell was placed inside a 25.4 cm i.d. Rayonet photochemical reactor (RPR) (manufactured by Southern New England Ultraviolet Co., Inc., Branford, CT), which was equipped with three sets of 16 lamps: (i) RPR-300 nm, sunlight phosphor lamps emitting a broad band of wave lengths from approximately 250 to 400 nm with a maximum intensity at approximately 300 nm for photolysis of Cl2, (ii) low-pressure Hg lamps emitting 253.7 nm photons for photo-decomposition of HBr, or (iii) low-pressure Hg lamps emitting both 253.7 and 184.9 nm photons with an intensity ratio of 6:1, respectively, for photo-dissociation of HCl and HBr.Reference Calvert and Pitts16
The photochemical cell was attached to a pyrex vacuum line and the following pressures were added: (1.1 − 1.6) × 104 Pa of ultra-high purity Cl2 (Matheson Tri-Gas, Parsippany, NJ), (0.8 − 1.8) × 104 Pa of gaseous HBr (Matheson Tri-Gas, Basking Ridge, NJ), or (0.8 − 1.1) × 104 Pa of technical grade HCl (Airgas, Elmira, NY) as measured with a Hg manometer that was topped off with approximately 2 cm of dibutyl phthalate to prevent reaction with the Hg. The gases were de-gassed of air using at least 2 freeze-thaw cycles at 77 K. The unreacted gases were neutralized by condensing the gas into an evacuated pyrex flask containing a 1 M NaOH solution frozen at 77 K and then warmed up to room temperature.
D. X-ray photoelectron spectroscopy
The samples were analyzed with a Physical Electronics Model 5800 XPS that examines the top 2–5 nm of a sample's surface using a take-off angle of 45° between the sample and analyzer. A region of about 800 μm in diameter was analyzed. The samples in the quartz block or attached to the microscope coverslip were mounted directly on the XPS sample holder. The monochromatic Al Kα (1486 eV) x-ray beam was focused to accept only photoelectrons emitted from the nanotubes. The quantitative analyses are precise to within 5% for major constituents and 10% for minor constituents. For chemical state analysis, binding energies reported in the literatureReference Beamson and Briggs17 were utilized to assign the peaks for curve fitting the spectra. The minimum number of curves needed to achieve a fit with a chi-squared value of less than 2.0 was used. The samples were charge-neutralized with a flood of low energy electrons from a BaO field emission charge neutralizer to minimize radiation damage to the samples. The XPS chamber pressure was 5 × 10⁻⁹ Torr, and there was no evidence of any desorption during handling or analysis.
III. RESULTS
A. Photo-chlorination of SWCNT powder with Cl2
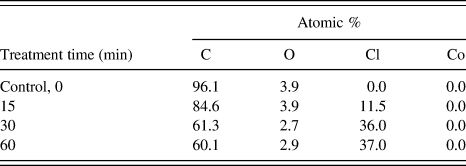
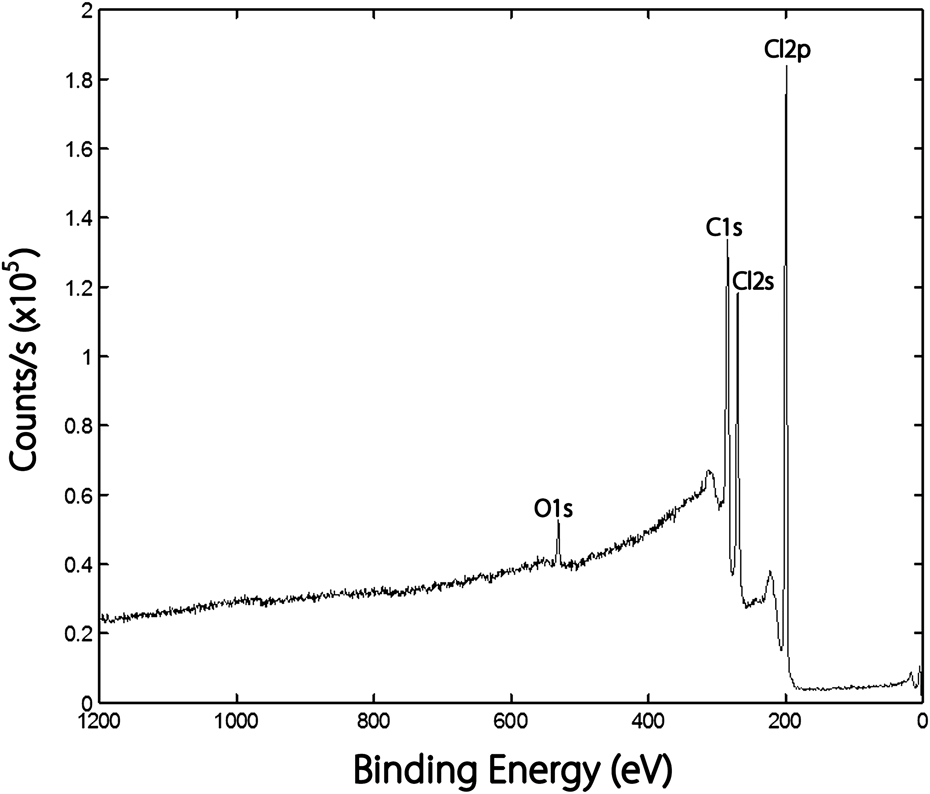
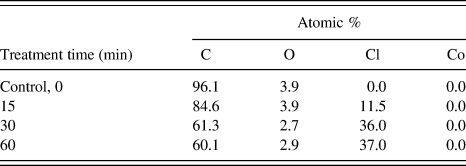
Table I shows the quantitative XPS analysis results for SWCNT powder treated with photolysis of Cl2 using the broad band of radiation centered around 300 nm. The untreated control sample of SWCNT powder showed only the presence of carbon and oxygen with 3.9 at.% O. The three treated samples contained carbon, oxygen, and chlorine up to a saturation level of 36–37 at.% Cl. Figure 1 shows the XPS survey scan from 0 to 1200 eV for SWCNT powder treated for 30 min of photo-chlorination. The Cl atom peak dominates the spectrum having a small presence of O atoms. When SWCNT powder was exposed to gaseous chlorine for 60 min without radiation, only 2.7 at.% Cl was detected on the surface.
Quantitative XPS results for UV photo-chlorination of SWCNT powder with gaseous Cl2.
XPS survey spectrum for SWCNT powder containing a low level of oxygen (2.7 at.% O) treated for 30 min with UV photolysis of Cl2 using a broad band of wave lengths centered around 300 nm.

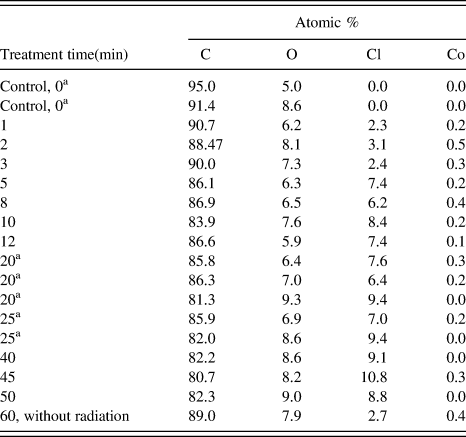
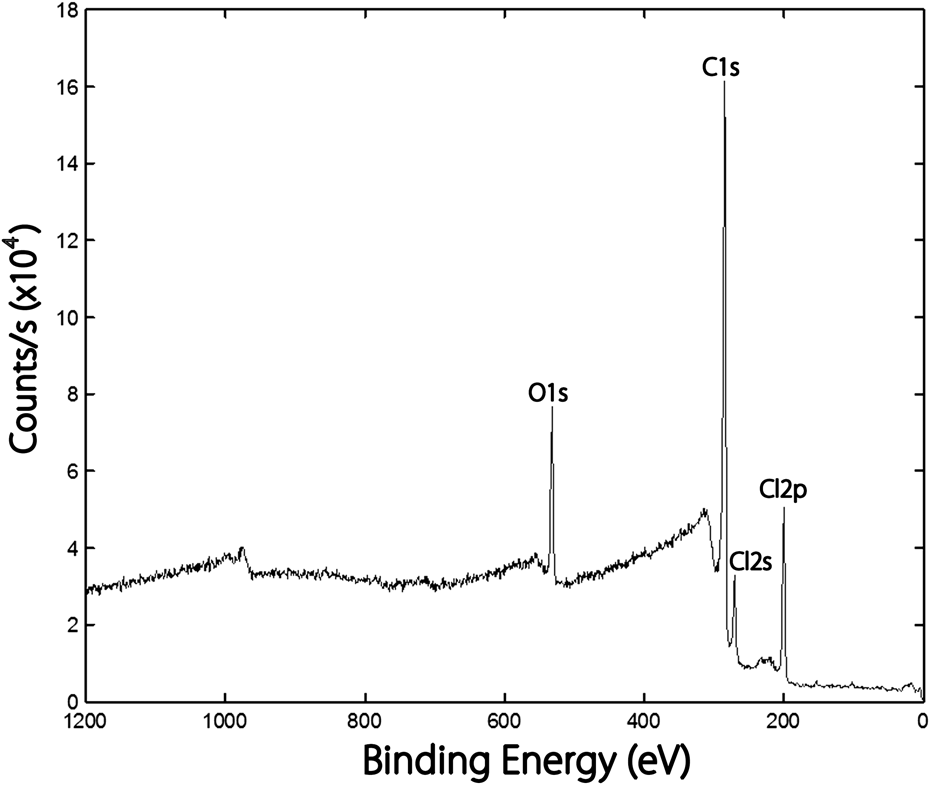
Additional experiments were done with SWCNT powder samples, which had higher oxygen content as shown in Table II. The treated samples contained carbon, oxygen, chlorine, and sometimes trace amounts of cobalt, which is often used in the synthesis of SWCNTs. Figure 2 displays a XPS survey scan for a sample with a higher level of oxygen than the data reported in Table I. The amount of oxygen bonded to SWCNTs greatly influenced the saturation level of chlorination, which only reached approximately 9 at.% Cl for samples with higher levels of oxygen concentration (approximately 8 at.% O). The atomic percent of oxygen remained relatively constant independent of the treatment time.
Quantitative XPS results for UV photo-chlorination of higher oxygen-containing SWCNT powder with gaseous Cl2.
a Replicate samples.
XPS survey spectrum for SWCNT powder containing a higher level of oxygen (9.0 at.% O) treated for 50 min with UV photolysis of Cl2 using a broad band of wave lengths centered around 300 nm.
Figure 3 shows the C 1s XPS spectra for the sample having the highest level of chlorination (37 at.%), and the curve fitting results are reported in Table III compared to an untreated sample. The absolute percentages of C were calculated by multiplying the atomic percent of C from the quantitative analyses, with the percentage contribution from the species obtained from the curve fitting. Therefore, the sum of the carbon concentrations equals the concentration of C obtained from the quantitative analyses and not 100%. Given the complexity of the C 1s spectrum, a good model for energy loss structure is needed to curve fit the peaks due to chemical bonding. The energy loss structure of the nanotube control was curve fit using the well-characterized C 1s spectrum of P-Quaterphenyl(poly(phenylene)oligomers)Reference Beamson and Briggs17 as the model giving the initial number of peaks, binding energies, and peak widths as input for the software. The dominant increase with treatment was observed in the singly bonded chlorine moiety, with less evidence for changes in the concentration of C–Cl2, O–C=O, and O–C–O functional groups.
XPS C 1s curve fitting for SWCNT powder (Table III) treated for 60 min with UV photolysis of Cl2 with a broad band of wave lengths centered around 300 nm.
XPS C 1s curve fitting results for untreated SWCNT powder treated 60 min with UV photolysis of Cl2.
a Quantitative analysis: 95.0 at.% C and 5.0 at.% O.
b Quantitative analysis: 60.1 at.% C, 37.0 at.% Cl, and 2.9 at.% O.
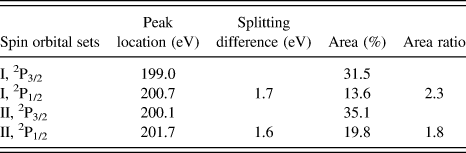
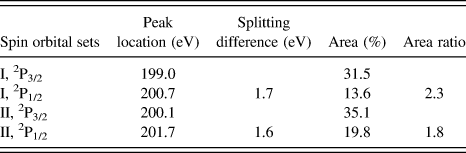
Figure 4 displays the Cl 2p XPS spectrum for the sample having the highest level of chlorination (37 at.%). Curve fitting of the Cl 2p spectrum provides the number of pairs of spin orbital components (2p 3/2 and 2p 1/2) having an area ratio of approximately 2:1 and binding energy splitting differenceReference Beamson and Briggs17 of 1.6 eV. The curve fitting results (Table IV) indicate two sets (I and II) of spin orbital components.
Curve fitting Cl 2p XPS spectrum for SWCNT powder (Table IV) treated for 60 min with UV photolysis of Cl2 using a broad band of wave lengths centered around 300 nm.
Curve fitting Cl 2p XPS spectrum (Fig. 4) for UV photo-chlorination of SWCNT powder with gaseous Cl2 using a broad band of wave lengths centered around 300 nm.
B. Photo-chlorination of SWCNT powder with HCl
Figure 5 shows a plot of the atomic percent of chlorine and oxygen for SWCNT powder samples treated with 253.7/184.9 nm photolysis of HCl as a function of treatment time. The chlorine atom concentration increases as a function of treatment time to a saturation level of approximately 5.8 at.% Cl for treatment times of 60–90 min while oxygen shows no trend with treatment time and remains relatively constant at approximately 8 at.% O. A control experiment containing 2.9 × 10⁴ Pa of HCl in the presence of SWCNT powder for 60 min showed 0.24 at.% Cl without any radiation. The C 1s XPS spectra display an increase in Cl-substituted moieties with treatment time at a binding energy of approximately 286–287 eV (Fig. 6) according to the curve fitting assignments in Table III.
Plot of atomic percent of Cl (■) and O (♦) for untreated SWCNT powder and samples treated with 253.7 and 184.9 nm photolysis of HCl as a function of treatment time.
Overlapped C 1s XPS spectra for SWCNT powder treated for 20, 30, 45, 60, and 90 min UV photolysis of HCl with 253.7 and 184.9 nm photons. Increasing treatment time is shown in the direction of the arrow.
C. Photo-bromination of SWCNTs with HBr
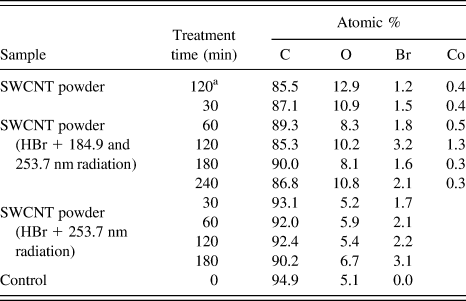
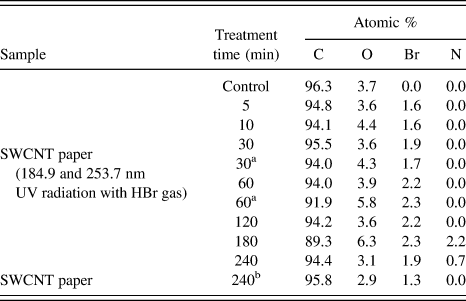
Table V gives the quantitative XPS results when SWCNT powder was treated with UV photolysis of gaseous HBr using the 253.7 and 253.7/184.9 nm radiation sources, respectively. The amount of bromination was independent of the radiation source and was approximately 2.5 at.%, which was approximately 1 at.% higher than that obtained in the absence of radiation. The principal peak in the C 1s spectra was due to the carbon–carbon bonding at 284.4 eV, and the intensities of the high binding energy peaks did not show any significant change due to the little changes in the oxygen and bromine concentrations. The overlapped Br 3d spectra also were relatively identical. Treatment of SWCNT paper with 253.7/184.9 nm photo-dissociation of HBr (Table VI) displayed similar results as SWCNT powder.
Quantitative XPS results for SWCNT powder treated with UV photolysis of HBr.
a SWCNT powder reacts with HBr gas at room temperature without UV radiation.
Quantitative XPS results for SWCNT paper treated with UV photolysis of HBr.
a Replicate samples.
b SWCNT paper reacts with HBr gas at room temperature without UV radiation.
IV. DISCUSSION
UV photolysis of Cl2 produces chlorine atoms that interact with the π-conjugation of CNTs to form a higher level of chlorination on SWCNT powder (36–37 at.% Cl) than on MWCNTs (approximately 13 at.%Reference Oliveira, Debies and Takacs7). A similar trend is observed for the 254.7/184.9 nm photo-oxidation with gaseous O2, where the saturation oxygen amount is higher for SWCNT powderReference Krysak, Jayasekar, Parekh, Oliveira, Debies, Santhanam, DiLeo, Landi, Raffaelle, Takacs and Mittal18 (23.5 at.% O) than for MWCNT powderReference Parekh, Debies, Knight, Santhanam and Takacs19 (7.5 at.% O). The interaction of the π-conjugation in the CNTs within MWCNTs tends to make them less reactive than SWCNTs. When oxygen occupies more of the reactive sites on the SWCNTs (approximately 8 at.% O), the achieved saturation level of chlorination is only approximately 9 at.% Cl. The degree of chlorination clearly depends on the amount of oxygen in the SWCNTs. Photochemical chlorination of graphene, using xenon lamp irradiation of Cl2, also shows covalent attachment of chlorine atoms with about 8 at.% on samples containing oxygen contamination.Reference Li, Zhou, Wu, Peng, Yan, Zhou and Liu20 The photo-chlorination of graphene increases the resistance by over four orders of magnitude and introduces an electronic band gap, hence showing potential for an all-graphene electric circuit.Reference Li, Zhou, Wu, Peng, Yan, Zhou and Liu20
Theoretical density function calculations have been performed on the structural and electronic properties of chlorinated SWCNTs. The chemisorption of Cl atoms to SWCNTs was found to be an exothermic process that showed strong aromaticityReference Wang, Xu, Su, Muhammad and Hou21 with a significant increase in the highest occupied molecular orbital/lowest unoccupied molecular orbital energy gap, hence making the chlorinated nanotubes promising candidates for use in nanoelectronics.Reference Wang, Xu, Su, Muhammad and Hou21–Reference Erbahar and Berber23 Calculations showed that chlorine atoms should be adsorbed in pairs with the first Cl atom covalently attached to SWCNTs strongly influencing the positional preference for the addition of the second Cl atom.Reference Saha, Dinadayalane, Murray, Leszczynska and Leszczynski22,Reference Erbahar and Berber23 Systematic investigation of the adsorption of Cl atoms on a graphene sheet resulted in various coverages and configurations where in the initial state a charge-transfer complex is formed, followed by covalent bonded Cl pairs eventually resulting in further cluster in hexagonal rings where the resulting coverage is less than 25%.Reference Yang, Zhou, Wang, Liu and Liu24 In this study, the C 1s curve fitting XPS results for the photo-chlorination of SWCNTs (Fig. 3, Table III) indicated an increase in Cl-substituted SWCNTs with a smaller presence of the C–Cl2 moiety. The Cl 2p spectrum (Fig. 4) is similar to that observed during a study of hydrothermal functionalization of SWCNTs with hydrochloric acid solution.Reference Duesberg, Graupner, Downes, Minett, Ley, Roth and Nicoloso25 Curve fitting shows that two sets of curves are present for the Cl 2p spectrum (Table IV), suggesting both bonded and adsorbed chlorine on the SWCNT surface. The higher binding energy set is associated with covalently bonded Cl, which is within experimental error of the reported binding energiesReference Barthos, Mehn, Demortier, Pierard, Morciaux, Demortier, Fonseca and Nagy4,Reference Konya, Vesselenyi, Niesz, Kukovecz, Demortier, Fonseca, Delhalle, Mekhalif, Nagy, Koos, Osvath, Kocsonya, Biro and Kiricsi5 of 200.5 and 202.1 eV for 2p 3/2 and 2p 1/2, respectively. The areas of the curves (Table IV) indicate a larger amount of the covalently bonded than adsorbed chlorine.
In addition to halogen atoms, the photo-dissociation of HCl and HBr produces H atoms,Reference Calvert and Pitts16 which may abstract a hydrogen atom from the hydrogen halides to form molecular hydrogenReference Calvert and Pitts16 and/or add to the reactive π-conjugation sites on the SWCNTs. Therefore, the observed lower amounts of covalent halogenation using photolysis of the hydrogen halides (approximately 5.8 at.% Cl and 2.5 at.% Br) are expected relative to photo-chlorination with Cl2. Hydrogenation of SWCNTs with atomic hydrogen results in: forming covalent C–H bonds,Reference Khare, Meyyappan, Cassell, Nguyen and Han26 achieving approximately 65 at.% H,Reference Nikitin, Ogasawara, Mann, Denecke, Zhang, Dai, Cho and Nilsson27 causing structural enlargement, reducing electrical conductance, and increasing semiconducting properties,Reference Zhang, Qi, Wang, Lu, Mann, Li and Dai28 which confirms theoretical calculationsReference Wang, Xu, Su, Muhammad and Hou21 showing the electronic band gap properties of hydrogenated SWCNTs.
The addition of gaseous Br atoms to SWCNTs is less energetically favorable than the reactions of Cl and H atoms, because of the weak C–Br bond strength, and photo-dissociation of HBr results in lower coverage of the surface (approximately 2.5 at.% Br) than photolysis of Cl2 and HCl. Previously, there have been no reports of C–Br formation directly on SWCNTs,Reference Colomer, Marega, Traboulsi, Meneghetti, Van Tendeloo and Bonifazi29 although interaction with HBr solution could indicate the presence of bromine atom or ion.Reference Gao, Zhong, Song, Wu, Xie, Qian, Dong and Luo30 In this study, the amount of bromine detected is very low, does not correlate with treatment time, and with short treatment time, or in the absence of radiation, approximately 1 at.% Br is detected indicating little reaction with the surface, possibly, because of adsorption or reaction with trace amounts of Co.
V. SUMMARY
UV photolysis of Cl2 to form Cl atoms produced a higher level of covalent chlorination on SWCNT powder (36–37 at.% Cl) than previously reported for MWCNTs (approximately 13 at.%). The degree of chlorination depended on the amount of oxygen on the surface of the SWCNTs. Photo-dissociation of gaseous HCl, which forms both H and Cl atoms that can interact with the π-conjugation sites on SWCNTs, produced lower amounts of halogenation, approximately 5.8 at.% Cl. XPS analysis showed only trace amounts of Br (approximately 1–2 at.%) on SWCNTs treated with UV photo-dissociation of gaseous HBr.
ACKNOWLEDGMENTS
The authors gratefully acknowledge J. Alvarenga and Dr. B. J. Landi for the supply of SWCNT paper. These research results were presented at the Ninth International Symposium on Polymer Surface Modification: Relevance to Adhesion, Lehigh University, Bethlehem, PA, June 17–18, 2013.