I
Japan's rapid industrialization in the late nineteenth century has been attributed in part to the early development of its financial system (Mitchener and Ohnuki Reference Mitchener and Ohnuki2009; Rosovsky Reference Rosovsky1961; Rousseau Reference Rousseau1999; Rousseau and Sylla Reference Rousseau, Sylla, Bordo, Taylor and Williamson2001). With financial institutions in place that could mobilize capital, coordinate investments and monitor businesses, Japanese entrepreneurs were able to lower the risks and transaction costs involved in establishing modern enterprises. This in turn laid the groundwork for technological catch-up with western nations and gave the economy an advantage in building capital-intensive industries and achieving economies of scale.
While the positive association between finance and economic growth is fairly well documented across a number of countries, largely from Europe and North America, there is less research on Japan's initial industrial development in the late nineteenth century largely owing to a lack of historic data, especially disaggregated at the sector and regional levels (Cameron Reference Cameron1967, Reference Cameron1972). Firm data, with the exception of some state-sponsored enterprises and large, family-owned conglomerates, are sporadically available and largely only after the turn of the century following the establishment of the Tokyo and Osaka stock exchanges in 1878 and the promulgation of the 1893 Commercial Code.Footnote 1 Moreover, while financial sector firms have better coverage during this period, most existing studies of early modern Japanese finance rely on national aggregates of financial assets and variation in lending rates or focus on governmental policies like the National Banking Acts or expansion of the Bank of Japan. Less understood is the role of financial institutions in the emergence of firms across different industries and whether this impact varied by location and over time.
This article re-examines the link between financial system development and industrialization through a newly developed data set of firms from the Meiji period. These data are grouped by major industry and prefecture, which allow for more detailed analysis of inter-sectoral relationships compared to national aggregates. Using a two-stage least squares instrumental variable model on panel data, the results indicate that at the prefectural level, financial intermediation is positively associated with industrial activity measured extensively by the number of enterprises, and are robust to different specifications of industries. In contrast, when series of the total number of firms for Japan as a whole are used, no statistically significant relationship obtains. Moreover, this relationship appears causal in that non-financial firm activity does not predict changes in financial sector activity. The causal impact is pronounced for manufacturing firms, particularly among less capital-intensive sectors like textiles that have been identified as important to Japan's early industrialization. The general effect weakens in the latter part of the period, following institutional reforms and increasing financial maturity, and for the prefectures outside metropolitan Tokyo and Osaka, which had the highest numbers of financial and industrial firms.
These findings corroborate existing claims of finance-led growth in Meiji Japan, but through the extensive margin as measured by the number of firms. In particular, the robust relationship between intermediation and textile manufacturing supports the narrative of Japanese industrialization taking off with an emphasis on less capital-intensive production before orienting toward capital-intensive sectors in the 1900s. This may also explain the attenuated impact of finance over time and in rural areas, as firm scale and industry concentration became increasingly important for continued economic growth.
II
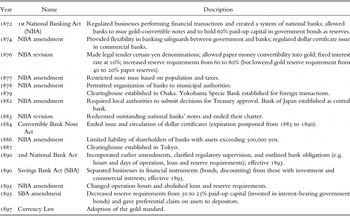
Even as the government experimented with model factories and industrial policies, it overhauled the existing financial system and laid a legal framework on which modern institutions could develop.Footnote 2 Immediate objectives included redeeming previously issued notes of credit by feudal lords, establishing a credible currency and creating a national banking system. Seeking to emulate the economic prowess of western countries like the United States and Great Britain as well as recognizing the importance of financial intermediation, government leaders immediately began a series of reforms culminating in the National Bank Act of 1872. This act established a decentralized national banking system similar to that in America, with chartered national banks operating under a fractional reserve system and issuing gold-convertible notes. However, with the depreciation of government notes, these banks incurred substantial losses and petitioned for paper-convertibility only. After numerous revisions to the first banking law, the last of which ended the national banks' power to issue notes, the government promulgated a second National Banking Act in 1890, which imposed lending restrictions and financial reporting on ordinary banks and coincided with a new commercial code for non-banking firms. As shown in Table 1, the vacillations between restricting and liberalizing bank activity continued until the early 1890s with the adoption of the gold standard and enactment of comprehensive commercial and banking codes marked the maturation of the financial system.
Number of firms, industry series

Number of firms, finance series

Number of firms, finance series

Major financial reforms in the early Meiji period, 1868–97

Source: Soyeda (Reference Soyeda1994).
Numerous studies repeatedly find evidence that financial sector development contributes to industrialization and more generally to economic growth. Rajan and Zingales (Reference Rajan and Zingales2001) provide a survey of both theoretical and empirical work suggesting a positive relationship between financial intermediation and growth, suggesting differences in impact depending on whether finance was transacted at arms-length or not. King and Levine (Reference King and Levine1993) compare data from 80 countries between 1960 and 1989, and find that measures of financial development (i.e. liquid liabilities, bank deposits) are positively associated with contemporaneous and future economic growth. In one of the first studies to apply modern time-series analysis to the finance-led growth literature, Rousseau and Wachtel (Reference Rousseau and Wachtel1998) also find for a smaller group of western countries that financial intermediaries make a critical contribution to economies at earlier stages of development.
Following Rousseau (Reference Rousseau1999), this article focuses on nineteenth-century Japan as an illustrative example of finance-led industrialization.Footnote 3 Regularly cited as an example of successful late development, Japan is notable for developing both its industrial and financial sectors based on foreign institutions and technologies. In particular, its financial institutions possessed characteristics similar to those in other late developing countries like Germany, such as diversified portfolio investments, close relationships with their clients, vigilant screening of loan applications, and lending oriented toward longer-term industrial investments (Burhop Reference Burhop2006; Gerschenkron Reference Gerschenkron1962; Kindleberger Reference Kindleberger1993; Rosovsky Reference Rosovsky1961). This may help to explain the country's rapid build-up of physical capital, with gross domestic capital formation averaging 13 percent of national income from 1887 to 1916 (Rosovsky Reference Rosovsky1961, p. 9).Footnote 4 Other recent scholarship underscores the importance of the central bank through its branch activity and coordination with private banks in creating an integrated national capital market, in addition to financial institutional reform and the diffusion of the telegraph (Ohnuki Reference Ohnuki2007; Mitchener and Ohnuki Reference Mitchener and Ohnuki2009). These policy experiments were one of many implemented by the Meiji government in its attempt to modernize the economy, alongside establishing model factories and importing foreign labor and technology. Evidence of the effectiveness of financial system institutionalization include lower transaction costs and regional variation in interest rates, an improved debt capacity, and greater saving and investment (Grossman and Imai Reference Grossman and Imai2008; Sussman and Yafeh Reference Sussman and Yafeh2000).
Nevertheless, it can be argued that part of this narrative remains unexplained. For one, the government's policy contributions seem more visible than they were efficacious. The government's first major financial reform was to create a system of national banks modeled on that of the US in the early 1800s. These banks, which were chartered in the 1870s and lightly regulated, were authorized to print bank notes, unlike unchartered private banks. Subsequent inflation, bank note defacement and system instability due to the semi-autonomy of the national banks led to a revision of the National Bank Act to increase regulation and the creation of the central Bank of Japan in 1882 that was solely authorized to print bank notes (Soyeda Reference Soyeda1994). Even then, the central bank was initially limited in reach, relying on private banks and correspondent relationships to extend its remit and provision of financial services, and government policy may also have dampened banking competition (Ohnuki Reference Ohnuki2007; Grossman and Imai Reference Grossman and Imai2008). As for direct industrial investments, while the government is usually credited with making substantial capital outlays, it is interesting to note that both public and private investment were comparable throughout the pre-World War II period, with the latter showing much less volatility (Rosovsky Reference Rosovsky1961).
Another qualification to the efficacy of finance on industrialization is the prevalence of captive banking relationships, in which many ‘organ banks’ (aka, kikko ginko) were controlled by shareholders in major industrial concerns (Kato Reference Kato1957; Okazaki et al. Reference Okazaki, Sawada and Yokoyama2005). This phenomenon was pervasive in the early 1900s and suggests that financial resources may not have been efficiently allocated, thus undermining the premise that increased intermediation will necessarily correspond with greater economic activity and firm performance. Moreover, financial system instability may have increased due to non-performing assets, thus affecting the availability of intermediation itself. Unfortunately, determining the extent of this capture is difficult given the lack of firm-level financial information before the turn of the century, with studies using data post-dating the Meiji period, although it is likely to have earlier origins, especially since dominant firms like the zaibatsu conglomerates had close links to financial firms or owned banks themselves (Okazaki et al. Reference Okazaki, Sawada and Yokoyama2005; Morikawa Reference Morikawa1992).
More generally, the paucity of firm-level data for much of Meiji period means that little is known about the activities and spread of financial intermediaries, and even less about most industrial firms excepting the largest firms. For the former, between the economy-wide studies based on financial asset aggregates and interest rate variation and the case studies of particular institutions like the central bank, there appears to be a wide range of financial activity during the high Meiji period that is unaccounted for, especially at the local level. Consequently, it is difficult to specify the channels through which financial intermediation affects economic growth during the initial wave of Japanese industrialization in the late 1800s when attempting to account for industrial and regional variation.Footnote 5 This would be relevant if firms were credit constrained due to fewer intermediaries in their area of operations given incomplete market integration and the importance of proximity to lending relationships and information gathering, especially since many Meiji-era firms were newly established and adopted foreign technologies (Berger et al. Reference Berger, Miller, Petersen, Rajan and Stein2005). To address these issues, this study uses a new prefecture-level panel data set collected from firm genealogies for the whole of the Meiji period, which may provide insight into industrial and regional variations that heretofore are poorly documented. For the statistical analysis, I employ a two-stage least squares (2SLS) first difference estimation model that uses lagged values of financial and industrial firm activity as instruments.
III
The research in this study is based on an original data set of firm establishments in the Meiji period. Complementing existing data comprising values of financial assets holdings and interest rates, this data set is derived from entries found in a collection of corporate genealogies, the Shuyo Kigyo no Keifuzu collection. Like other types of genealogies, these corporate family trees trace a firm's lineage back to its origins and provide basic information like a date of establishment, ownership, industry classification and geographic location. The Shuyo compilation, collected by Japanese business historians from firms listed on the Tokyo Stock Exchange in 1984, includes genealogies for 1,089 firms and cumulatively contains over 14,000 unique establishments dating back to the early nineteenth century or earlier (Yagura and Ikushima Reference Yagura and Ikushima1986). The entries also include defunct firms whose assets were transferred to a direct ancestor of a firm with a genealogy, which partly mitigates the issue of firm survivor bias, and annotations about asset type and investor can be found as well. These genealogies, previously used to demonstrate variation in technology adoption among Meiji-era zaibatsu and other Japanese firms, represent some of the oldest available documentation of firm activity and are also novel for their scope of industries and geographic detail (Tang Reference Tang2011). The main limitation, however, is their qualitative nature, which means only extensive measures of economic activity (e.g. firm counts) can be obtained for analysis.
To compare financial and industrial development, I group the annual number of private firms by industry based on their respective two-digit industrial classification code, assigned from the 1984 edition of the Standard Industrial Classification of Japan (JSIC) (Statistics Bureau of Japan 1984). Government enterprises are excluded due to their access to public sector financing, which precludes the need for private-sector financial intermediation. Sectors include agriculture, mining, food processing, textiles, wood and paper manufactures, chemicals, ceramics and glass, metal processing, machinery, miscellaneous manufacturing, utilities, transportation and communication, retailing, banking, other financial services, construction, and miscellaneous services. To have sufficient numbers for analysis, these 17 sectors are further aggregated to four major divisions: primary, manufacturing, and both financial and non-financial services. Among these, textile manufacturing and transportation and communication services are well represented in the data and thus separately reported.
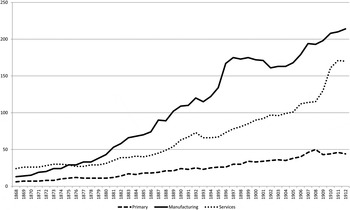
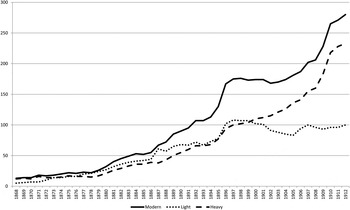
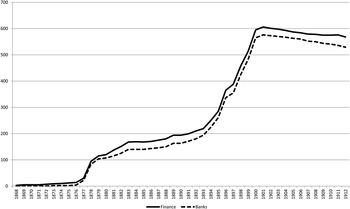
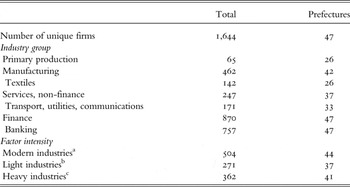
Following Rosovsky (Reference Rosovsky1961), I construct three separate non-financial series from the above sectors based on technology and capital intensity: modern, light and heavy. Modern industries include textiles, chemicals, metal processing, machinery, utilities, and transport and communication industries. Light industries include food and beverage manufacturing, textiles, woodworking and paper products, stoneware and ceramics, and miscellaneous manufacturing. Heavy industries include chemicals, metal processing, utilities, and transport and communication industries. Table 2 provides some descriptive statistics about the data set, which show the number of unique establishments broken down by industry series and prefectural coverage. In the regression analysis that follows, these establishments are tracked over time, so annual firm counts include both those established in the given year as well as any surviving firms. To illustrate net firm activity over time, Figures 1 and 2 track firm establishment by the three major industrial divisions (excluding finance) and the three Rosovsky series, respectively. For financial firm activity, I construct two series: one that includes all types of financial intermediaries (e.g. banks, securities brokers, insurers, pawnbrokers) and another that contains only banks. Both series are shown in Figure 3.
Descriptive statistics
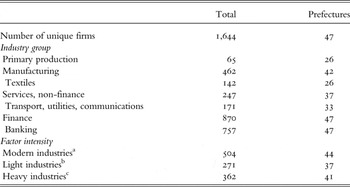
a includes textiles, chemicals, metals processing, machinery, utilities, transport.
b includes food processing, textiles, wood processing and printed, ceramics/glass manufacturing, miscellaneous manufacturing.
c includes chemicals, metals processing, machinery, utilities.
Source: author's calculations
As shown in the figures, firm activity across sectors steadily increases over the period, especially after the 1890s and in manufacturing (Figure 1) and banking (Figure 3), which is consistent with widespread economic growth. For the banking sector, there is also an initial wave of start-up in the late 1870s, which is due to the disbursement of government bonds to ex-samurai in exchange for giving up their hereditary pensions, many of which were used to capitalize banks, and the progressive deregulation of banking discussed earlier (Lockwood Reference Lockwood1954; Soyeda Reference Soyeda1994). The second wave in the 1890s owed to new commercial and banking laws promulgated in that decade, which liberalized business practices and clarified fiduciary responsibilities of debtors and lenders (Loenholm Reference Loenholm1904; Rosovsky Reference Rosovsky1961; Soyeda Reference Soyeda1994). In particular, the adoption of the 1893 Commercial Code standardized incorporation procedures and defined fiduciary responsibilities, which may have encouraged both industrial and financial firm establishment by providing the former with improved protection of property rights and the latter with demand for third-party finance.
IV
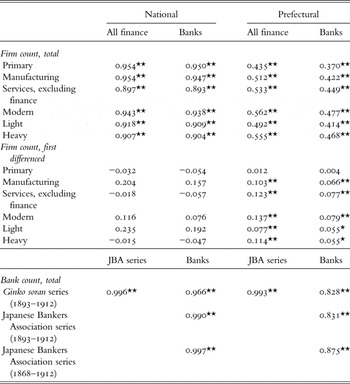
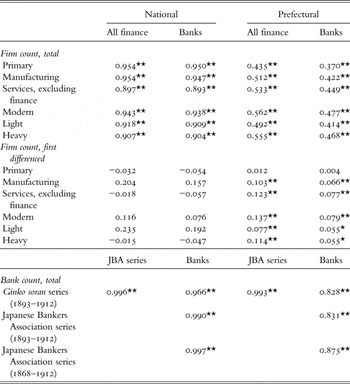
The central question of this article is whether the rise in industrial firm activity was predicated by earlier financial development. Casual observation of these national trends does not indicate a pronounced relationship, and the general increase in activity across sectors may stem from other factors like foreign trade and institutional improvements not specifically captured by one sector's development. To compare national trends against prefectural ones as well as total firm activity to its change over time, I perform pairwise correlation analysis for all industrial and financial series, with results presented in Table 3. In the top panel, the relationship is highly positive and statistically significant for the national economy (columns 1 and 2), while the magnitudes are lower when disaggregated by prefecture (columns 3 and 4). Small differences between industry series notwithstanding, it is notable that the ordinal ranking among them changes depending on the level of aggregation.
Correlations
Significance level: *5 percent, **1 percent
Source: Japan Ministry of Finance (various years), Japanese Bankers Association (2012), and author's calculations.
The middle panel shows correlation coefficients for the industrial and financial series, differenced by one period. By using net firm activity over time, this removes static influences particular to a prefecture and thus may be more informative of a general relationship. Here, the difference between the national and prefectural series is much more visible. For the former, there is no statistically significant relationship between industry and finance; many coefficients are even negative. For the latter, however, aside from the primary sector all other industries have correlations that are modestly positive and highly significant. Among these, the strongest relationship is between modern industries and finance, broadly and narrowly defined, with coefficients of 0.137 and 0.079 respectively.
Before proceeding to the regression analysis, it may be worthwhile to consider the robustness of the genealogical data. At first glance, it can be argued that using firm counts as opposed to more typical measures of output and assets would lead to estimates that do not conform with standard interpretations of economic activity. While this is a valid concern since the qualitative nature of these data provides no indication of firm scale, it can be argued that the absence of a modern financial system and corresponding industries in early nineteenth-century Japan means the physical establishment of intermediaries and industrial firms directly measures development in those sectors during the period in question. In other words, this article assumes that the act of establishment was a credible signal of firm activity since there were banking regulations such as a minimum capitalization requirement of 10,000 yen, to be paid up within the year of establishment, and the government's assumption of liabilities upon bank default (Soyeda Reference Soyeda1994). Moreover, if extensive growth of firms can be viewed as one manifestation of development, be it through greater ease in setting up firms, the formalization of economic activities, or increased risk taking among entrepreneurs, then the data can be viewed as augmenting existing scholarship that uses more traditional measures.
Another concern may be that the data are not representative of the economy given their provenance. That is, there may be underrepresentation of primary and service sector firms and over-representation of firms from the largest metropolitan areas (e.g. Tokyo, Osaka). While sample selection is highly possible, there are a number of factors that can mitigate this. Since the genealogies are based on 1,089 modern-day firms listed in the Tokyo Stock Exchange, which are mostly manufacturing (627) and financial (131), whatever bias present in the industrial composition for these firms will most likely be shown in their Meiji-era ancestors. This also seems reasonable since these are the types of firms possessing physical or financial assets that would merit documentation, unlike cottage industries or similar-sized retail establishments. Given that the focus of this article is to identify a relationship between finance and (modern) industries, particularly manufacturing, this overrepresentation may thus not pose a problem to interpreting results using these series. As for the issue of survivorship bias, while the sample may favor stronger firms that were able to remain in operation up to 1984, the genealogies also include those establishments that changed ownership either in whole or in part. As mentioned earlier, weak firms that had their assets purchased by another firm that ultimately survived would thus appear in the genealogies, although most likely with lower representation. Survivorship bias in the data set may even offset the issue of captive banking, since firms that survived are most likely the strongest performers while weaker firms receiving preferential access to capital would be underrepresented in the genealogies. It also stands to reason that survivorship bias should apply uniformly across sectors over time, so comparisons between them would still be valid.
For this article's analysis, more relevant is whether the share of firms within sectors is consistent over time and location. Unfortunately, there is little documentation of firms at the prefectural level prior to the 1900s for Japan as a whole, much less for individual industries; even for banks, comprehensive data are available only starting in 1893 in the banking directory (aka, Ginko soran) of the Japan Ministry of Finance (various years). To compensate for the first 25 years of the Meiji period not covered by official statistics, this article also uses banking establishment data from the Japanese Bankers Association (2012) to construct a separate prefectural-level series that dates back to 1868. These two series, the official statistics (GS) and the banking association (JBA) data, are numerically similar to each other in total bank counts for the overlapping years of 1893 to 1912. As such, they can be used as reference points to compare to the genealogical data, which contain between a quarter and a third of the totals in the other two series for the same period.
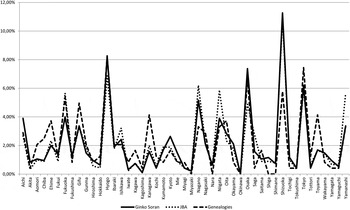
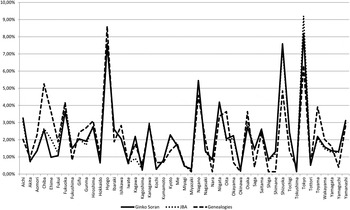
The bottom panel of Table 3 provides correlation results of the three banking series across all prefectures using annual bank establishment data; national bank counts are aggregated up from the prefectures in each series. The prefectural-level correlation between the GS and the JBA series is 0.993 at 1 percent statistical significance for the years 1893 to 1912, which indicates virtual equivalence across time and location.Footnote 6 For the same period, the GS series has a positive correlation coefficient of 0.828 with the genealogical banking data, also at 1 percent significance. Using the entire Meiji period (1868–1912), the correlation coefficient for the JBA and genealogical series is 0.875. Breaking down these two series by individual prefecture, the estimates show positive correlations exceeding 0.70 for all 47 prefectures at 1 percent significance, with 41 prefectures have correlations exceeding 0.90.Footnote 7 Moreover, estimates with Bonferroni and Sidak adjustments do not change the significance levels. To further illustrate their comparability, Figures 4 and 5 show the share of banks by prefecture from each of the three series in the years 1893 and 1912. The high similarity in bank establishment shares among the three series over time and across prefectures indicates reasonable confidence that the genealogical firm data in the banking sector is representative of Japanese banking. Assuming consistency in the documentation of non-financial firms in the genealogies, these results suggest that the data are representative of the national economy.
Comparison of prefectural bank shares, 1893

Comparison of prefectural bank shares, 1912

V
While the industry series correlations suggests a positive relationship between financial and industrial development at both the national and prefectural levels, these are insufficient for a causal interpretation. This may be possible, however, by using a two-stage least squares (2SLS) first difference panel model with lagged dependent variables as instruments, also known as the Anderson-Hsiao estimator (Anderson and Hsiao Reference Anderson and Hsiao1981, Reference Anderson and Hsiao1982). These instruments allow one to consistently estimate whether changes in one series (e.g. financial) over time can predict changes in another (e.g. industrial); moreover, taking the first difference typically removes serial correlation, nonstationarity and time-invariant factors. Besides being computationally straightforward, the 2SLS first difference estimator has been shown to be robust to multicollinearity and specification errors as well as efficient relative to other estimators (e.g. generalized method of moments and least-squared dummy variables) for panels of long length and is consistent regardless of the initial conditions of the series (Judson and Owen Reference Judson and Owen1999).
In this article, first differencing is appropriate given that unit roots are present in some of the prefectural-level firm series, as demonstrated via augmented Dickey-Fuller and Phillips-Perron tests (with and without drift). In contrast, none of the differenced series appears to have unit roots. It should also be noted that since financial development is highly autocorrelated and endogeneity is difficult to remove with instruments, one can check the causal interpretation by inverting the industrial and financial series in the model specification.
To test the finance-led growth hypothesis measured through extensive firm activity, the basic model setup regresses the net annual total of firms in a given industry group y i,t on the net annual total of financial firms x i,t, where i indexes prefectures and t indexes time in years. The methodology is similar to Rousseau (Reference Rousseau1999), which measures financial development with total assets held by intermediaries, non-intermediaries' holdings of equity and bonds, and circulated currency and economic performance with per capita income, gross fixed investment, private fixed investment, and the ratios of the latter two to the first. The difference with that study is that here I substitute extensive measures (firm counts) for intensive ones and use a prefectural panel data set to assess the impact on different industries. As described earlier, only firms established during the Meiji period are included, with counts increasing with new establishments and spin-offs and decreasing following bankruptcy, merger, or acquisition. The basic model with a single lag takes the form:
 $$y_{it} - y_{it-1} = \lpar x_{it} - x_{it-1}\rpar \beta+\lpar y_{it-1} - y_{it-2}\rpar \gamma+u_{it} - u_{it-1}\comma \; or \Delta y_{it} = \Delta x_{it}\beta + \Delta y_{it-1}\gamma + \Delta u_{it}.$$
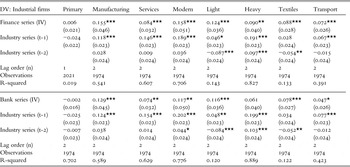
To consistently estimate the coefficients on the regressors, I use lagged terms of the financial series Δx it-1 to instrument for the current term variable Δx it, which are highly correlated with each other, but the former are not with the contemporaneous error term Δu it. To generate the instrument, I regress the financial series on its lags and the other explanatory variables in the model; the predicted values βIV are then used to instrument for β in the original model. These are indicated in Table 4, with the instrumented and lagged variables in parentheses after the explanatory variable. To obtain the optimal number of lags, I take the mode of selected prefecture-level lag order based on three different information criteria (Akaike, Schwarz, and Hannan and Quinn) for each prefecture, and average these for the panel data specification as a whole.Footnote 8 When no mode is available for a given prefectural series, the lowest lag-order value is used.
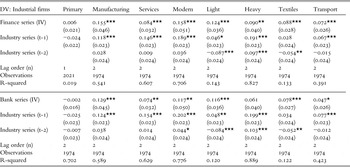
Panel regression results, 1868–1912
Significance: *10 percent, **5 percent, ***1 percent
Source: author's calculations.
Regression results from the 2SLS first difference model suggest that financial sector development indeed predicts industrial firm activity across prefectures, particularly in light manufacturing sectors like textiles. This can be seen in both the top and bottom panels of Table 4, which show the relationship of different industries to finance, broadly (all financial firms) and narrowly (banks) defined. In the top panel, the number of all financial intermediaries (row 1) positively corresponds with the number of industrial firms, with coefficients ranging from 0.155 in manufacturing (column 2) to 0.084 in non-financial services (column 3). The largest impact from financial intermediation is on modern industries (0.158, column 4), which is slightly higher than that for light manufacturing (0.124, column 5). These coefficients remain positive and statistically significant, albeit with slightly lower magnitudes, when using the narrow financial series of banking establishments in the bottom panel. Interestingly, heavy industries do not appear to benefit from additional banks, which may be due to their large capital requirements that could be met only through equity issue (e.g. railroads) and other types of intermediaries. As can be expected, earlier industrial sector activity predicts current levels, as indicated by the mostly positive coefficients on the lagged industrial series variables (rows 2–3). For comparison to other methods, these results are qualitatively similar to those using least squares dummy variable (LSDV) estimation, but the latter having coefficients and standard errors much smaller in magnitude. Ordinary least squares results also have much smaller coefficients, but are much less significant. Both methods, however, have the regressor correlated with the error term, resulting in inconsistent coefficient estimates.
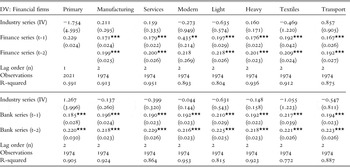
To test whether there is feedback from industrial activity to financial sector activity (i.e. reverse causality), the two respective series are switched in the regression model, with results shown in Table 5. As indicated in both the top and bottom panels, none of the industry group series (row 1) is statistically significant in predicting changes in financial firm or bank activity.
Regression results with reverse causality, 1868–1912

Significance: *10 percent, **5 percent, ***1 percent
Source: author's calculations.
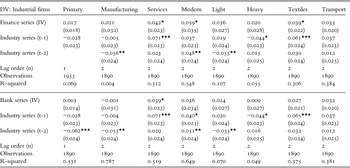
An advantage to using prefecture-level data is that individual regions may be selectively analyzed to assess whether firms were equally active across the country. In particular, considering that many developing countries confront the problem of uneven development between center cities and peripheral areas, it may be important to assess the role played by Japan's two main population centers, Tokyo and Osaka. These two metropolitan areas, comprising over a quarter of all firm establishments in the data set, were the most developed areas in the country and known to have a disproportionately large impact on overall growth throughout the Meiji period. Thus, it may be that the above results are driven by these two cities as opposed to prefectures in general. To address these issues, I remove the two prefectures containing these cities, with the results shown in Table 6.
Regression results with metropolitan exclusion, 1868–1912

Significance: *10 percent, **5 percent, ***1 percent
Source: author's calculations.
An immediate difference between these results and those using all prefectures is that financial intermediation has a much weaker effect on industrial activity. Among the eight industry groupings, while all remain positive, only three (services, modern, textiles) are statistically significant using the broad finance series and one (services) using the banking series. Moreover, inverting the finance and industry series in the specification (results not shown) shows that the modern and textiles industry groups also predict financial sector activity. This suggests the extensive growth of the latter may have coincided with industrialization in the periphery as opposed to leading it.
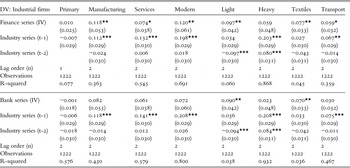
It may also be the case that the early wave of financial development in the 1870s due to the government's experiment with national banking may have a spurious influence on industrial activity, in light of the fiscal retrenchment and revocation of national bank charters in the early 1880s to combat inflation. Political consolidation, institutional development and market integration were also more likely to have affected firm activity relative to the early years of the period. To test whether finance-led industrialization held in the second half of the Meiji period, I use the subperiod starting in 1886, when inconvertible paper money had been largely withdrawn and currency redemption in specie resumed (Allen Reference Allen1946; Loenholm Reference Loenholm1904). These results are given in Table 7, and indicate that broad financial intermediation (top panel) remains predictive of industrial firm activity, although the impact from banking (bottom panel) is substantially weaker. This makes sense given the increasing use of equity finance for industries like cotton spinning and railroads starting in the 1880s, and the passage of the Commercial Code in 1893 that standardized incorporation practices and liability, and thus easing the public listing of firms. As in the first set of regressions, none of the industry group specifications predict financial sector activity at a statistically significant level when the two sets of firms series are switched, suggesting a persistent role of finance in industrial development. Separate results using the subperiod starting in 1887, when the central bank was established are qualitatively similar to those shown in Table 7.
Panel regression results, 1886–1912
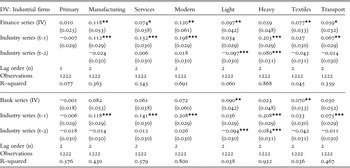
Significance: *10 percent, **5 percent, ***1 percent
Source: author's calculations.
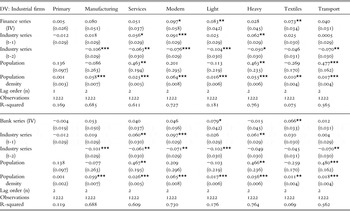
Using a later period for analysis also allows inclusion of official historical statistics like population density, which were collected at the prefectural level starting in 1884 (Japan Statistical Association 1987, series 2–5). The caveat to using this variable in the specification is that longitudinal analysis is reduced from 45 to 30 years, which is why it was not include in the basic model. Since it is likely that extensive firm activity in both finance and industry would correspond to market size (i.e. population), but possibly not in equal measure, while population density may allow for increased scale within firms, I add these variables to the specification. As shown in Table 8, the coefficients for both broad and narrow measures of financial intermediation now have smaller magnitudes and are less significant. Both population and population density are generally positive, although only the latter appears significant in most industry specifications. This may reflect a weaker relationship between extensive intermediation and industrial expansion once scale effects are controlled, although this is speculative. Population is associated with increased activity in heavy sectors like transport and communications (e.g. railroads), which corresponds with labor availability and public policies to connect major population centers. At the same time, the impact of financial intermediation on light manufacturing, particularly textiles, remains significant.
Regression results with population controls, 1886–1912

Significance: *10 percent, **5 percent, ***1 percent
Source: author's calculations.
VI
Taken together, the results using extensive measures of financial and industrial activity largely confirm existing scholarship on the importance of intermediation on industrialization, but at the prefectural level. That said, while the relationship is fairly consistent across specifications, there are notable differences between industries and locations. The industry group that benefitted most from financial intermediation was textile manufacturing, which is reasonable given its leading role in Meiji Japanese industrialization, its promotion for export and increased international demand. Intermediation was less effective among heavy and service industries, especially in areas outside Tokyo and Osaka as well as later in the period. It is also interesting to note that while the broad and narrow measures of financial intermediation are similar, the impact from banking is consistently smaller in magnitude and less widespread than that from all financial establishments. Firms in heavy and transport industries appear to benefit more from non-bank finance (Table 4), which may reflect differences in needed capital to set up and operate these facilities.
Given the coverage and qualitative nature of the genealogical data, caution in interpreting the results is advised. While some attempt has been made to demonstrate that the data are representative of the national economy at the prefectural level and over time, it is by no means certain that all industries are equally covered. This in turn would underestimate the impact of financial intermediation in sectors with fewer firms in the genealogies as well as those subject to scale economies. One should bear in mind, however, that the contribution of capital-intensive sectors (railways aside) to Meiji-era industrialization becomes relatively important only toward the end of the period.
Lastly, the issue of intensive growth is also relevant in that firm counts give little indication of firm scale, efficiency, and output, which are critical for Gerschenkronian late developing countries and to measures of economic and welfare change. Even so, it can be argued that comparisons of firm counts over time may be useful if they demonstrate longer-term competitiveness; in other words, changes in the number of firms may reveal superior management and productivity among survivors, and would apply across sectors. This could be clarified with additional work that compares firms that survived with those that did not, supplemented with quantitative records of firm performance that are increasingly available.