Introduction
Since the 1980s, cruise tourism has experienced explosive growth and become one of the world’s modern tourism industries with the fastest development and the most significant economic benefits, known as “the gold industry on the golden waterway” (Radic et al., Reference Radic, Law, Lück, Kang, Ariza-Montes, Arjona-Fuentes and Han2020). According to the statistics of Cruise Line International Association (CLIA), from 2013 to 2019, the demand for the global cruise market on the whole continued to grow in a fluctuating way. Global ocean liner passenger numbers grew from 21.3 million to 29.7 million, representing a compound annual growth rate of about 5.7%. In 2019, the direct, indirect and induced economic output of the cruise industry exceeded $154.5 billion and created more than 1.16 million jobs. In recent decades, due to the rapid development of the cruise industry, cruise activities have expanded from the Mediterranean Sea and the Caribbean to the Baltic Sea, South America, Southeast Asia, China, polar regions and other regions (Ren, James, Pashkevich, & Hoarau-Heemstra, Reference Ren, James, Pashkevich and Hoarau-Heemstra2021).
The particularity of the location environment gives the polar cruise the attribute of exploration, which satisfies more and more consumers with the spirit of adventure and the psychology of hunting for novelty. As a result, the number of polar tourists has maintained a growth rate of more than 10% for many years (Cajaiba-Santana, Faury, & Ramadan, Reference Cajaiba-Santana, Faury and Ramadan2020). And polar tourism has quickly become one of the most popular cruise tourism activities in the world (Mudryk et al., Reference Mudryk, Dawson, Howell, Derksen, Zagon and Brady2021). Compared with the vast land in Antarctica, the Arctic attracts more adventure cruises due to its wide water coverage and many islands. Between 2006 and 2016, summer tourism to the Arctic region quadrupled and winter tourism increased more than six-fold (Runge, Daigle, & Hausner, Reference Runge, Daigle and Hausner2020). From 2017 to 2019, 190,481, 223,905 and 245,688 people took adventure cruises to countries in and around the Arctic Circle. It is expected that the number of Arctic tourists will increase from 223,905 in 2018 to 412,153 in 2027, the number of cruise berths will increase from 9,637 to 14,415, and the number of cruises will increase from 73 to 94 in 2027 (Lau et al., Reference Lau, Sun, Yang and Kanrak2022).
Due to the special environment of high cold, the Arctic region has formed ice caps, sea ice, glaciers, tundra and other cryosphere landscapes, as well as unique indigenous cultural tourism resources (Shijin, Yaqiong, Xueyan, & Jia, Reference Shijin, Yaqiong, Xueyan and Jia2020). To get a close view of the natural landscape and experience the cultural scenery, tourists need to take a boat deep into the polar sea coast (Cajaiba-Santana, Faury, & Ramadan, Reference Cajaiba-Santana, Faury and Ramadan2020; Kseniia, Khan, & Chang, Reference Kseniia, Khan and Chang2021). This has made adventure cruises the preferred way to travel deep into the Arctic. In addition, due to the need to overcome the influence of extreme conditions and unpredictable ice conditions in the Arctic Sea, Arctic adventure cruises are usually required to have good ice resistance, with small tonnage, shallow draft and fewer passengers (Wang, Zong, Lu, Zhang, & Li, Reference Wang, Zong, Lu, Zhang and Li2021). And cruise companies should carefully plan and arrange the sailing time and itineraries of cruises, so as to reduce navigation risks (Zhang, Zhang, Zhang, Lang, & Mao, Reference Zhang, Zhang, Zhang, Lang and Mao2020) and stranding risks (Fu, Yu, Chen, Xi, & Zhang, Reference Fu, Yu, Chen, Xi and Zhang2022) in the complex polar sea area and improve the safety of cruise shipping (Khan, Khan, & Veitch, Reference Khan, Khan and Veitch2020).
Different from cruise shipping in middle and low latitudes such as the Caribbean Sea and the Mediterranean Sea, polar cruise tourism is not only influenced by cruise companies’ operating capacity (Theocharis, Pettit, Rodrigues, & Haider, Reference Theocharis, Pettit, Rodrigues and Haider2018), destination attraction (Bystrowska, Reference Bystrowska2019) and geopolitics (Tseng & Cullinane, Reference Tseng and Cullinane2018) but also influenced by regional climate and sea ice environment, showing a significant characteristic of seasonal itinerary network organisation. Bystrowska (Reference Bystrowska2019) used a hybrid approach to explore the relationship between sea ice conditions and cruise tourism activities in the Arctic Svalbard Archipelago and pointed out that cruise itineraries depended on sea ice coverage to a certain extent. The melting of glaciers and improved shipping conditions brought about by global warming had made all cruise itineraries in the Canadian Arctic region show longer shipping seasons and navigability, with the Beaufort region showing the largest increase (Mudryk et al., Reference Mudryk, Dawson, Howell, Derksen, Zagon and Brady2021). Koçak and Yercan (Reference Koçak and Yercan2021) also pointed out that melting sea ice was a major reason why Canadian Arctic shipping services nearly tripled between 2005 and 2015. The influence of global warming on the pattern of the polar cruise shipping network is also shown in the improvement of port call conditions brought by the change of port ice age, and more ports of call for cruises and even hub ports have been formed in high-latitude regions (Hermann, Lin, Lebel, & Kovalenko, Reference Hermann, Lin, Lebel and Kovalenko2022). Cruise ports including Svalbard and Greenland have become an important part of promoting the development of Arctic cruise shipping network (Zhu, Fu, Ng, Luo, & Ge, Reference Zhu, Fu, Ng, Luo and Ge2018). The integration of regional cruise ports such as Russia and Canada, to some extent, intensifies the differentiation pattern of cruise itineraries in the Arctic region (Yuan, Hsieh, & Su, Reference Yuan, Hsieh and Su2020). This requires an in-depth analysis of the spatial characteristics and organisational pattern of the Arctic cruise shipping network based on the types of polar cruise itineraries and the distribution of regional port resources, so as to reveal its new geospatial rules.
The development of cruise ports in the Arctic and their development into special cruise tourism destinations can contribute to regional economic growth, additional income and employment opportunities (Fridriksson, Wise, & Scott, Reference Fridriksson, Wise and Scott2020). However, the over-development of cruise tourism will also lead to the negative impact of human activities on the fragile ecosystem of the Arctic region (Johannsdottir, Cook, & Arruda, Reference Johannsdottir, Cook and Arruda2021), for example, ship fuel leakage (Helle, Mäkinen, Nevalainen, Afenyo, & Vanhatalo, Reference Helle, Mäkinen, Nevalainen, Afenyo and Vanhatalo2020), air and noise pollution (Chen et al., Reference Chen, Lau, Ge, Dulebenets, Kawasaki and Ng2021), plastic pollution (Bergmann et al., Reference Bergmann, Collard, Fabres, Gabrielsen, Provencher, Rochman and Tekman2022) and disturbance of marine species and wildlife caused by ship passage (Halliday et al., Reference Halliday, Le Baron, Citta, Dawson, Doniol-Valcroze, Ferguson and Insley2022). At the same time, the large number of tourists entering the polar regions will also have an impact on the daily life of the indigenous peoples in the Arctic region (Viken, Hockert, & Grimwood, Reference Viken, Höckert and Grimwood2021). In order to effectively alleviate the contradictions and conflicts between economy and environment, tourists and local residents during the development of polar cruise tourism, some scholars suggest that the regulatory authorities should implement more complete monitoring and regulation of the polar cruise industry to regulate the responsibilities of relevant parties (Lloret, Carreño, Carić, San, & Fleming, Reference Lloret, Carreño, Carić, San and Fleming2021), and intergovernmental agreements and national coordination are also essential (James, Olsen, & Karlsdottir, Reference James, Olsen and Karlsdóttir2020). Based on the port level, the key to balance the contradictions and conflicts is to consider itinerary organisation, port development and environmental bearing. Therefore, it is necessary to deeply explore the key issues such as the Arctic adventure cruise port pattern and itinerary selection, and study the organisational efficiency of cruise ports by analysing the spatial structure of regional cruise shipping network, so as to meet the expanding demand for polar cruise tourism and restrain the impact of cruise tourism development on the local natural environment.
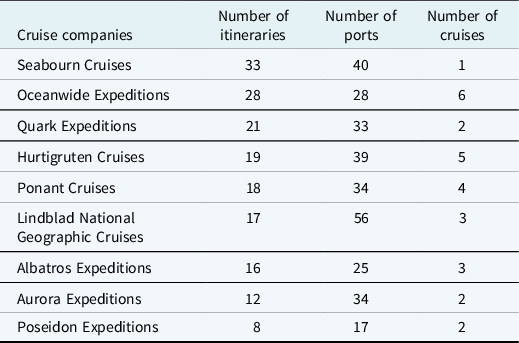
Based on this, this study selects the perspective of tourism geography and takes 172 Arctic adventure cruise itineraries from 2022 to 2023 by nine adventure cruise companies such as Seabourn Cruises and Oceanwide Expeditions as the basis to analyse the itinerary characteristics of Arctic adventure cruises (Table 1). In addition, social network analysis is used to systematically analyse the spatial structure of the Arctic adventure cruise shipping network from three aspects: port points, shipping network organisation and network system differentiation, so as to reveal the geospatial rules of the Arctic adventure cruise shipping network. This can not only enrich the research content of polar adventure cruise shipping network but also provide scientific reference for the planning and efficient operation of Arctic adventure cruise ports and itineraries.
Arctic adventure cruise companies
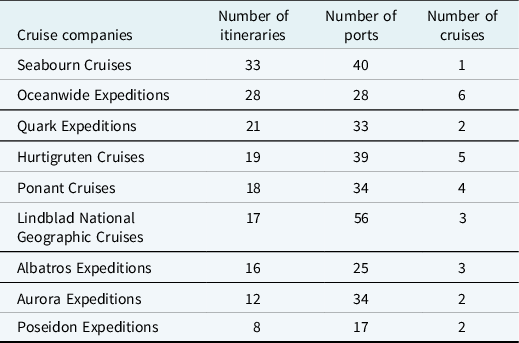
Source: Authors’ elaboration based on official websites of cruise companies and third-party cruise travel booking websites.
Methods
Network analysis can find the internal links between different factors, the contradictions between stakeholders, the spatial structure of regional points and the characteristics of the network structure of tourism flows (Tidbury et al., Reference Tidbury, Taylor, van der Molen, Garcia, Posen, Gill and Hyder2020). This study mainly uses this method to explore the cruise shipping network ports and their relationships. Through describing the relationship model between ports, this study analyses the structural characteristics and their effects on each port and the entire cluster. The following describes the main statistical indicators of the social network analysis used in this study.
-
(1) Point Degree
In the cruise shipping network, points represent ports, and the connections between points are edges. As the cruise itinerary setting is directional, the cruise shipping network is a directional graph (Sun & Lin, Reference Sun and Lin2020). Point degree refers to the number of edges connected by each port in the cruise shipping network, reflecting the importance of a port in the overall shipping network. The higher the degree value, the more important the position of the port in the shipping network (Esteve-Pérez & del Río-González, Reference Esteve-Pérez and del Río-González2022). The calculation formula is:
 $${d_o} = \sum_{p = 1}^n {b_{op} } $$
where
 $n$
is the number of ports in the cruise shipping network;
 $\mathop b_{op} $
refers to whether there is a connection between ports
 $o$
and
 $p$
. If there is a connection, it is assigned a value of one; if there is no connection, it is assigned a value of zero.
The overall average degree of the cruise shipping network is the average point degree of all ports. The higher the value, the more the average number of itineraries per port (Esteve-Pérez & del Río-González, Reference Esteve-Pérez and del Río-González2022). The calculation formula is:
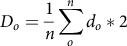 $${D_o} = {1 \over n}\sum_o^n {{d_o}} *2$$
-
(2) Network Centrality
Network centrality is mainly used to measure the status and “power” of a single port in the cruise shipping network structure. Degree centrality refers to the number of other ports directly connected to a port. The more connections, the higher the degree centrality, indicating that the port is more in the centre of the shipping network (Rodriguez, Park, Kim, & Yeo, Reference Rodriguez, Park, Kim and Yeo2021). The calculation formula is:
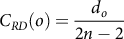 $${C_{RD}}\left( o \right) = {{{d_o}} \over {2n - 2}}$$
Betweenness centrality reflects the port’s ability to control communication between other ports. The higher the betweenness centrality, the more likely the port is to occupy the key position of itinerary setting (Rodriguez et al., Reference Rodriguez, Park, Kim and Yeo2021). The calculation formula is:
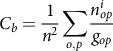 $${C_b} = {1 \over {{n^2}}}\sum\limits_{o,p} {{{n_{op}^i} \over {{g_{op}}}}} $$
where
 $\mathop g_{op} $
is the number of shortest paths from ports
 $o$
and
 $p$
, and
 $\mathop n_{op}^i $
is the number of times that all the shortest paths from port
 $o$
to port
 $p$
pass through
 $i$
.
-
(3) Network Density
Network density reflects the closeness of the relationship between ports in the cruise shipping network. The higher the network density is, the closer the relationship between ports is (Kanrak, Lau, Zhou, Ge, & Traiyarach, Reference Kanrak, Lau, Zhou, Ge and Traiyarach2023). The calculation formula is:
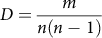 $$D = {m \over {n\left( {n - 1} \right)}}$$
where
 $n{\rm{ }}\left( {{\rm{ }}n{\rm{ }} - {\rm{ }}1} \right)$
represents the maximum number of possible relationships between ports, and
 $m$
represents the number of relationships actually included in the shipping network.
-
(4) Network Diameter and Average Path Length
Network diameter refers to the maximum value of the shortest path between any two ports in the cruise shipping network. The larger the network diameter is, the more ports the itinerary has (Ito, Hanaoka, & Sugishita, Reference Ito, Hanaoka and Sugishita2022). The calculation formula is:
 $$D_r = ma{x_{o,p}}{d_{op}}$$
where
 ${d_{op}}$
is the distance between two ports
 $o$
and
 $p$
.
The average path length is the average value of the distance between any two ports, which reflects the cohesion index of the cruise shipping network. The smaller the value, the less the average number of ports on the cruise itinerary (Kanrak et al., Reference Kanrak, Lau, Zhou, Ge and Traiyarach2023). The calculation formula is:
 $$L = {1 \over {{n^2}}}\sum\limits_{o = p} {{l_{op}}} $$
where
 $\mathop l_{op} $
is the average distance between two ports
 $o$
and
 $p$
.
-
(5) Clustering Coefficient
The clustering coefficient reflects the correlation between ports in the cruise shipping network (Kanrak et al., Reference Kanrak, Lau, Zhou, Ge and Traiyarach2023). The calculation formula is:
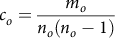 $${c_o} = {{{m_o}} \over {{n_o}\left( {{n_o} - 1} \right)}}$$
where
 ${n_o}$
is the number of ports associated with port
 $o$
, and
 ${m_o}$
is the actual number of adjacent edges of port
 $o$
.
The average clustering coefficient of the cruise shipping network as a whole is the average clustering coefficient of all ports (Kanrak et al., Reference Kanrak, Lau, Zhou, Ge and Traiyarach2023). The calculation formula is:
 $${C_o} = {1 \over n}\sum\limits_o^n {{c_o}} $$
-
(6) Modularity
Modularity identifies the effect of module division by measuring the difference between cruise shipping network and random network under certain community division. The value of modularity is generally between 0.3 and 0.7. The larger the value, the clearer the group structure (Zhang, Shang, & Jiao, Reference Zhang, Shang and Jiao2023). The calculation formula is:
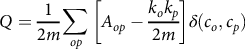 $$Q = {1 \over {2m}}\sum\limits_{op} {\left[ {{A_{op}} - {{{k_o}{k_p}} \over {2m}}} \right]} \delta ({c_o},{c_p})$$
where
 $m$
is the connection between ports.
 $\mathop k_o $
is the degree of port
 $o$
.
 $\mathop A_{op} $
refers to whether port
 $o$
is directly connected with port
 $p$
. If so, the value is assigned as one; otherwise, the value is assigned as zero.
 $\delta (\mathop c_o ,\mathop c_p )$
is used to judge whether ports
 $o$
and
 $p$
are in the same module. If they are in the same module,
 $\delta (\mathop c_o ,\mathop c_p )$
= 1, otherwise,
 $\delta (\mathop c_o ,\mathop c_p )$
= 0.
Itinerary characteristics of arctic adventure cruises
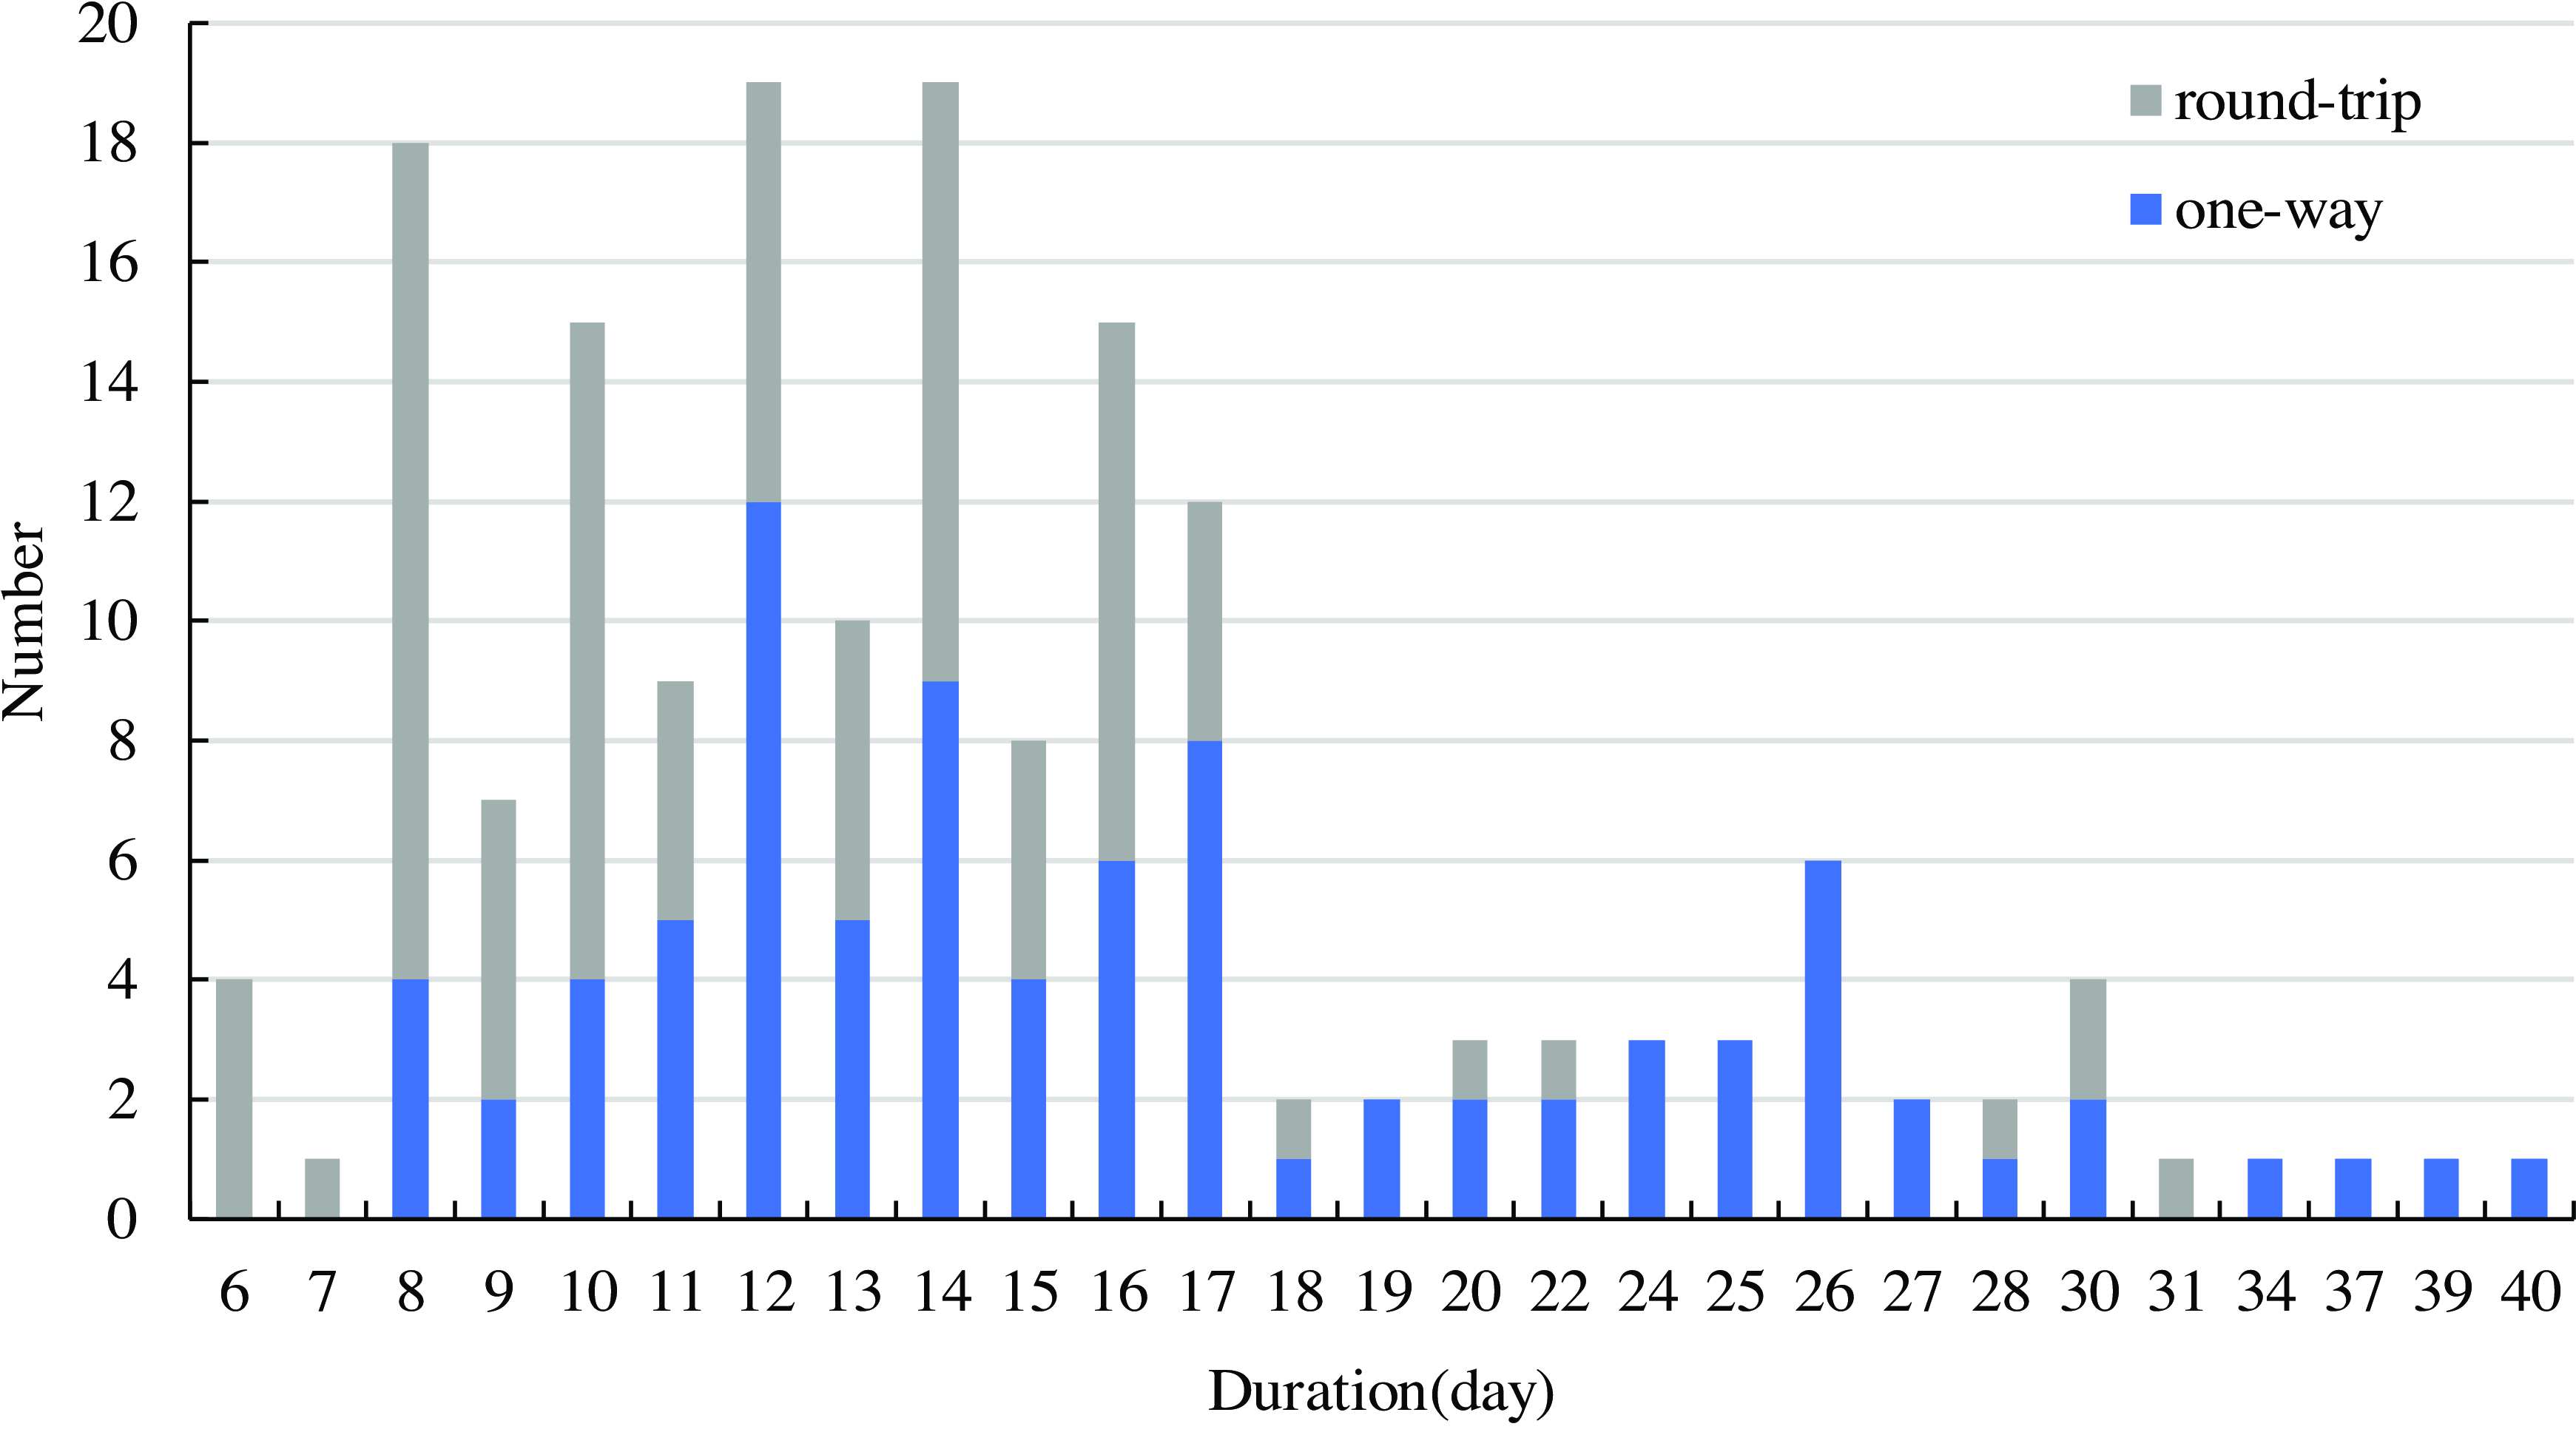
Voyage time is a key element of cruise itinerary planning (Alves & Santos, Reference Alves and Santos2022). With regard to the itinerary duration distribution, there are currently 27 types of adventure cruise itineraries with different durations in the Arctic, ranging from 6 to 40 days with a wide span (Fig. 1).
Durations of Arctic adventure cruise itineraries.
Source: Authors’ elaboration based on the cruise shipping data.
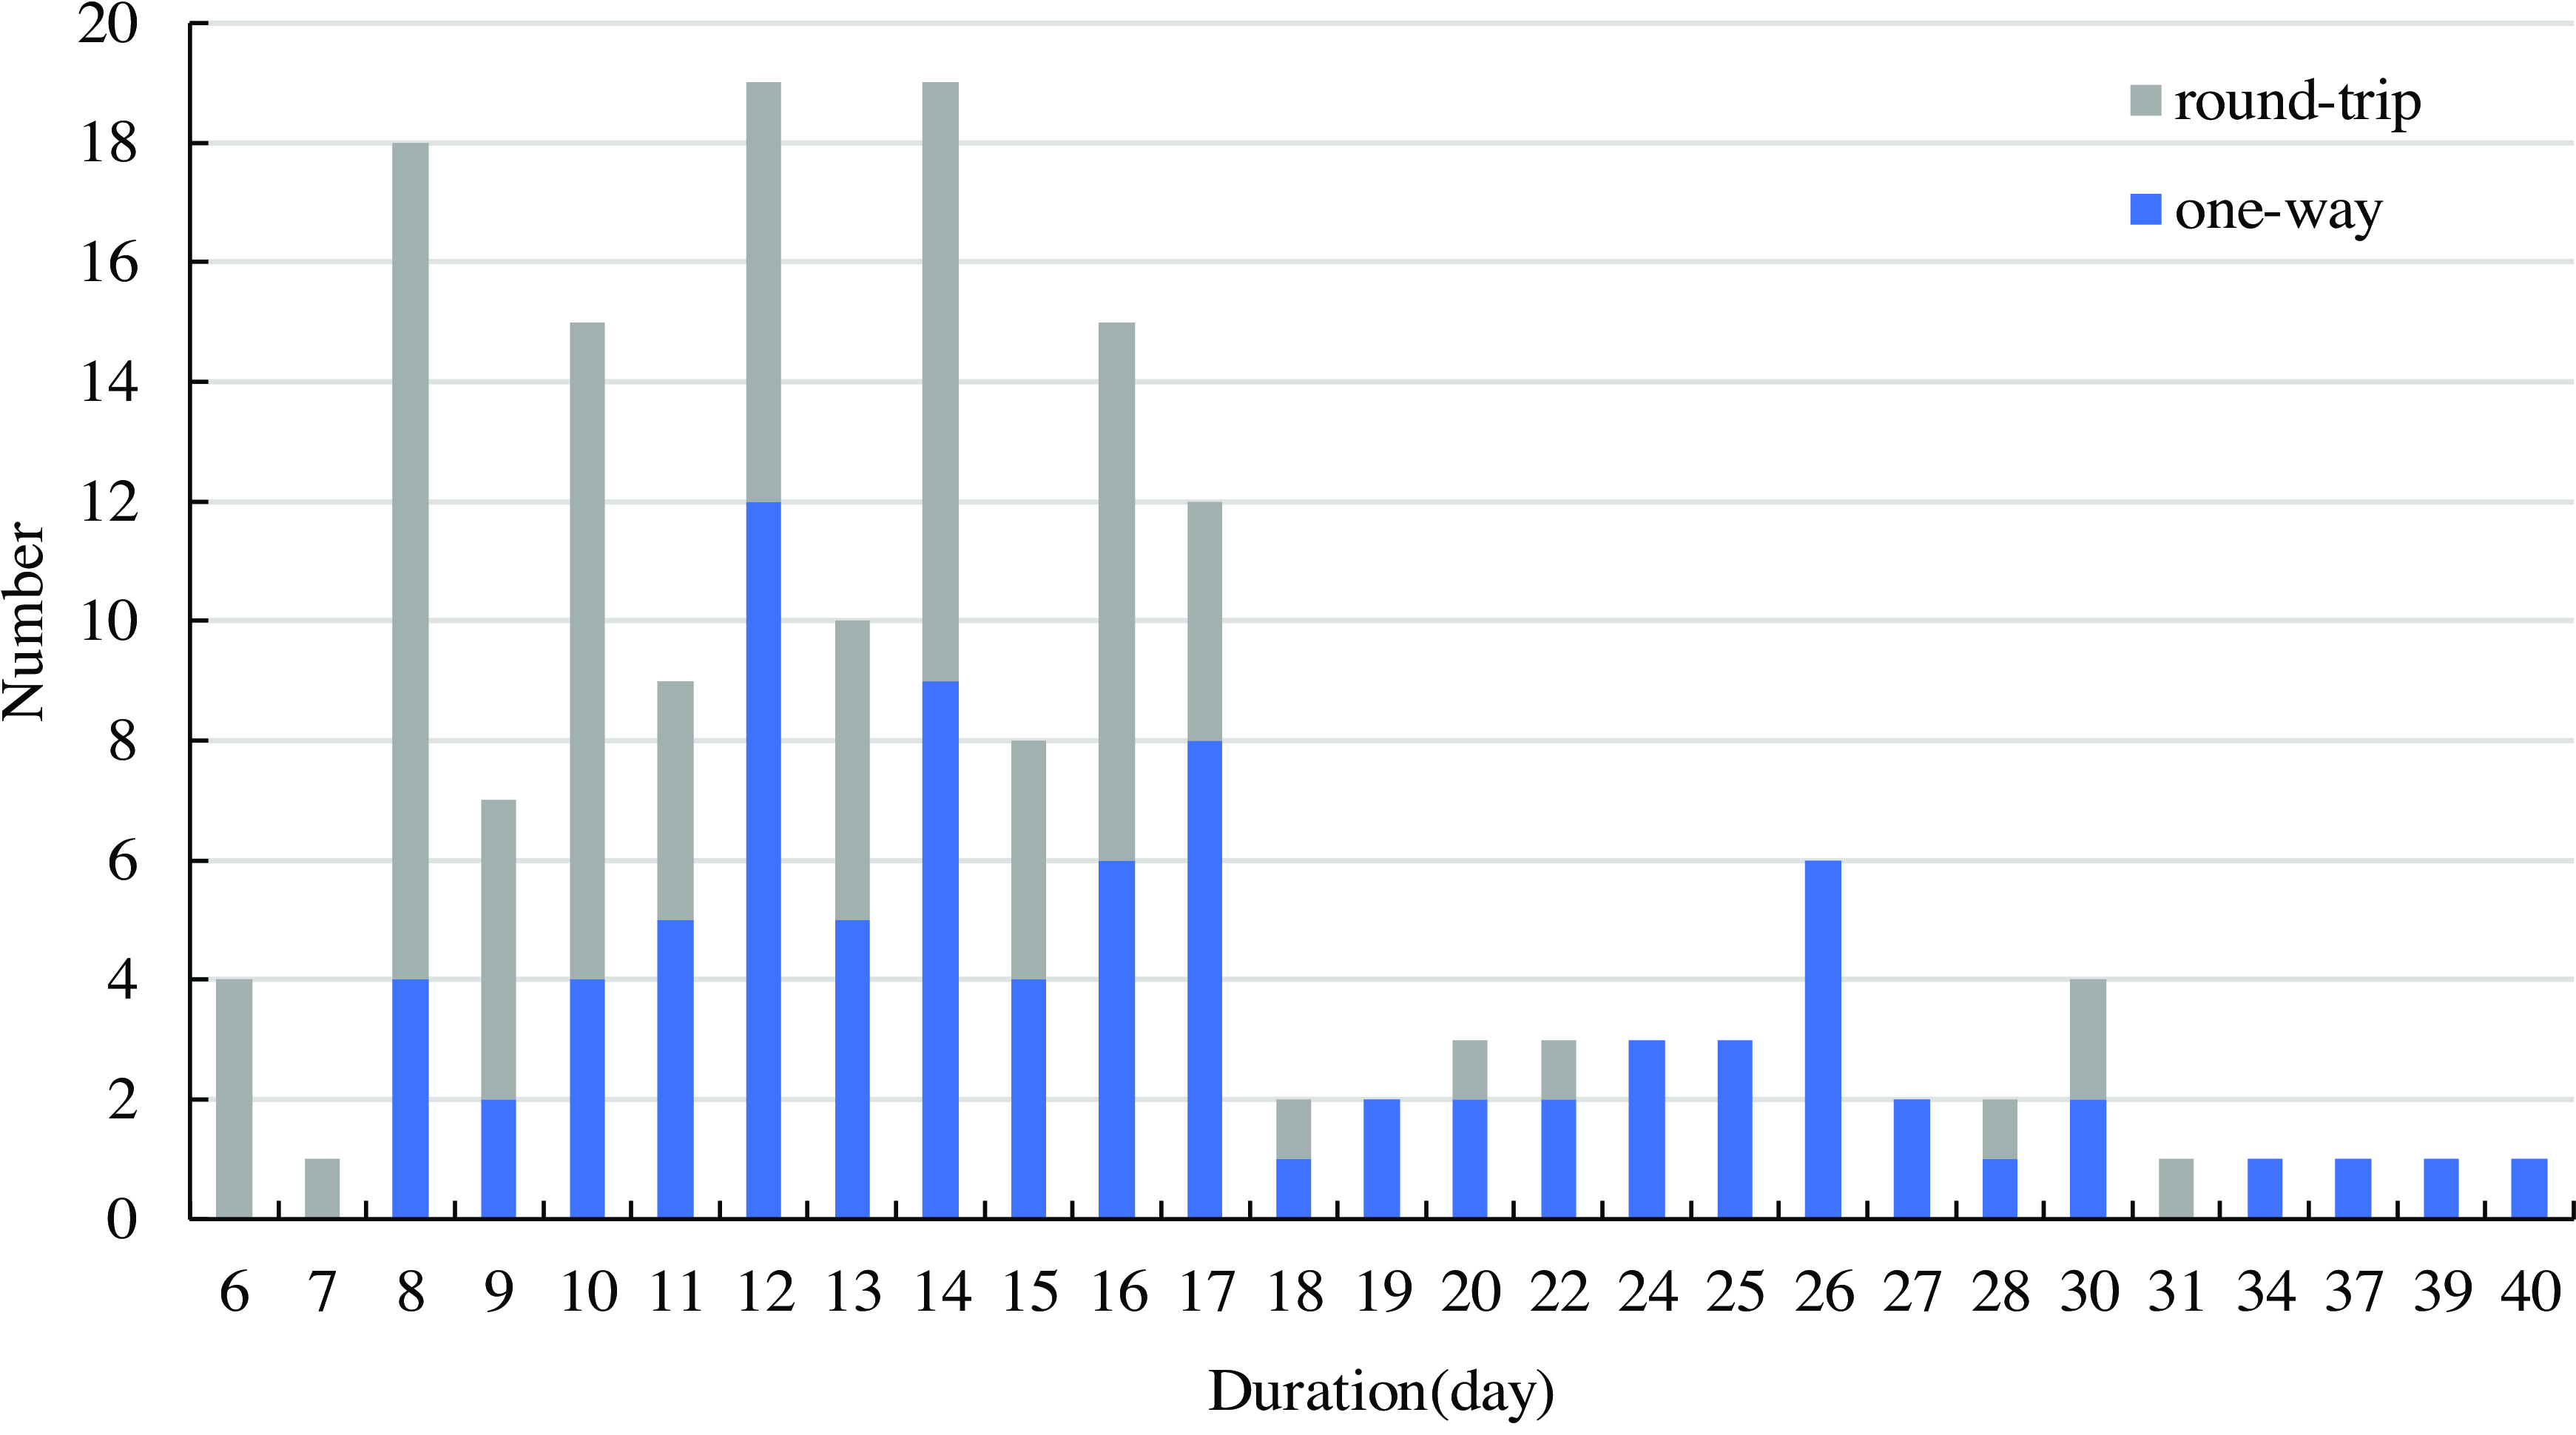
Among cruise itineraries of different durations, there are 87 one-way itineraries with different ports of departure and destination, and 85 round-trip itineraries with the same ports of departure and destination, with a quantity ratio of about 1:1. Among them, air-cruise itineraries, which combine aircraft and cruise (Ahmed et al., Reference Ahmed, Bertsch, Angel, Bibby, Bivins, Dierens and Mueller2020), account for 70.3% of the total itineraries in the Arctic. The main reason that air-cruise itinerary plays a dominant role in the Arctic adventure cruise itinerary is that the special geographical and climatic environment makes the transportation of most Arctic ports inconvenient. Cruise companies work with airlines to ensure that tourists can arrive at Arctic cruise departure ports and departure at destination ports by air. For all the durations of the voyage, there are 114 itineraries with a pair number, accounting for 66.3% of all Arctic cruise itineraries. Cruise companies take maximisation of corporate profits and itinerary attraction as the principle, and most one-way itineraries designed around the world are of singular duration, while round-trip itineraries are of even duration (Wang, Wang, Zhen, & Qu, Reference Wang, Wang, Zhen and Qu2017). However, one-way itineraries in the Arctic include 71.3% of air-cruise itineraries. As the main way for tourists to travel to or from the Arctic cruise destinations, the aircraft adds a day’s voyage time for the Arctic adventure cruise itineraries.
Cruise itineraries are mainly concentrated in the medium itineraries of 8 to 17 days, with 132 itineraries in total, accounting for 76.7% of all itineraries in the Arctic. There are 19 itineraries in 12 and 14 days, respectively, accounting for about 14.4% of medium itineraries; the duration of 18 cruise itineraries is 8 days, accounting for about 13.6%. Among the medium itineraries of 8–17 days, 59 are one-way itineraries, accounting for 67.8% of all one-way itineraries in the Arctic; 73 are round-trip itineraries, accounting for 88.2% of all round-trip itineraries. Other adventure cruise itineraries are scattered over 6–7 days and 18–40 days. Among the short itineraries of 6–7 days, there are only five round-trip itineraries, no one-way itineraries and only one 7-day itinerary. The long itineraries of 18 to 40 days are mainly one-way itineraries. The number of one-way itineraries is 28, and the number of round-trip itineraries is seven, with a quantity ratio of 4:1. Among them, there are four types of duration with only one itinerary and all are one-way itineraries, which are 34, 37, 39 and 40 days, respectively. In addition to the above four types of duration, five duration types of cruise itineraries with 19, 24, 25, 26 and 27 days are also one-way itineraries. Among the long itineraries, the duration types of only one-way itineraries account for 33.3% of the total duration types of Arctic itineraries.
To sum up, Arctic adventure cruise itineraries are mainly medium itineraries (8–17 days) with one-way and round-trip itineraries concentrated, while only few short round-trip itineraries (6–7 days) and a few long itineraries (18–40 days) with mainly one-way itineraries. Compared with the 7-day short itineraries dominated by middle and low-latitude cruise itineraries (Sun & Lin, Reference Sun and Lin2020), it shows a great difference.
Spatial structure of arctic adventure cruise shipping network
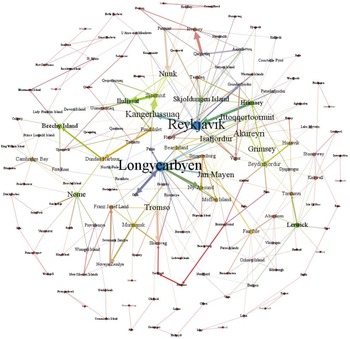
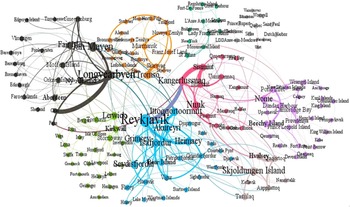
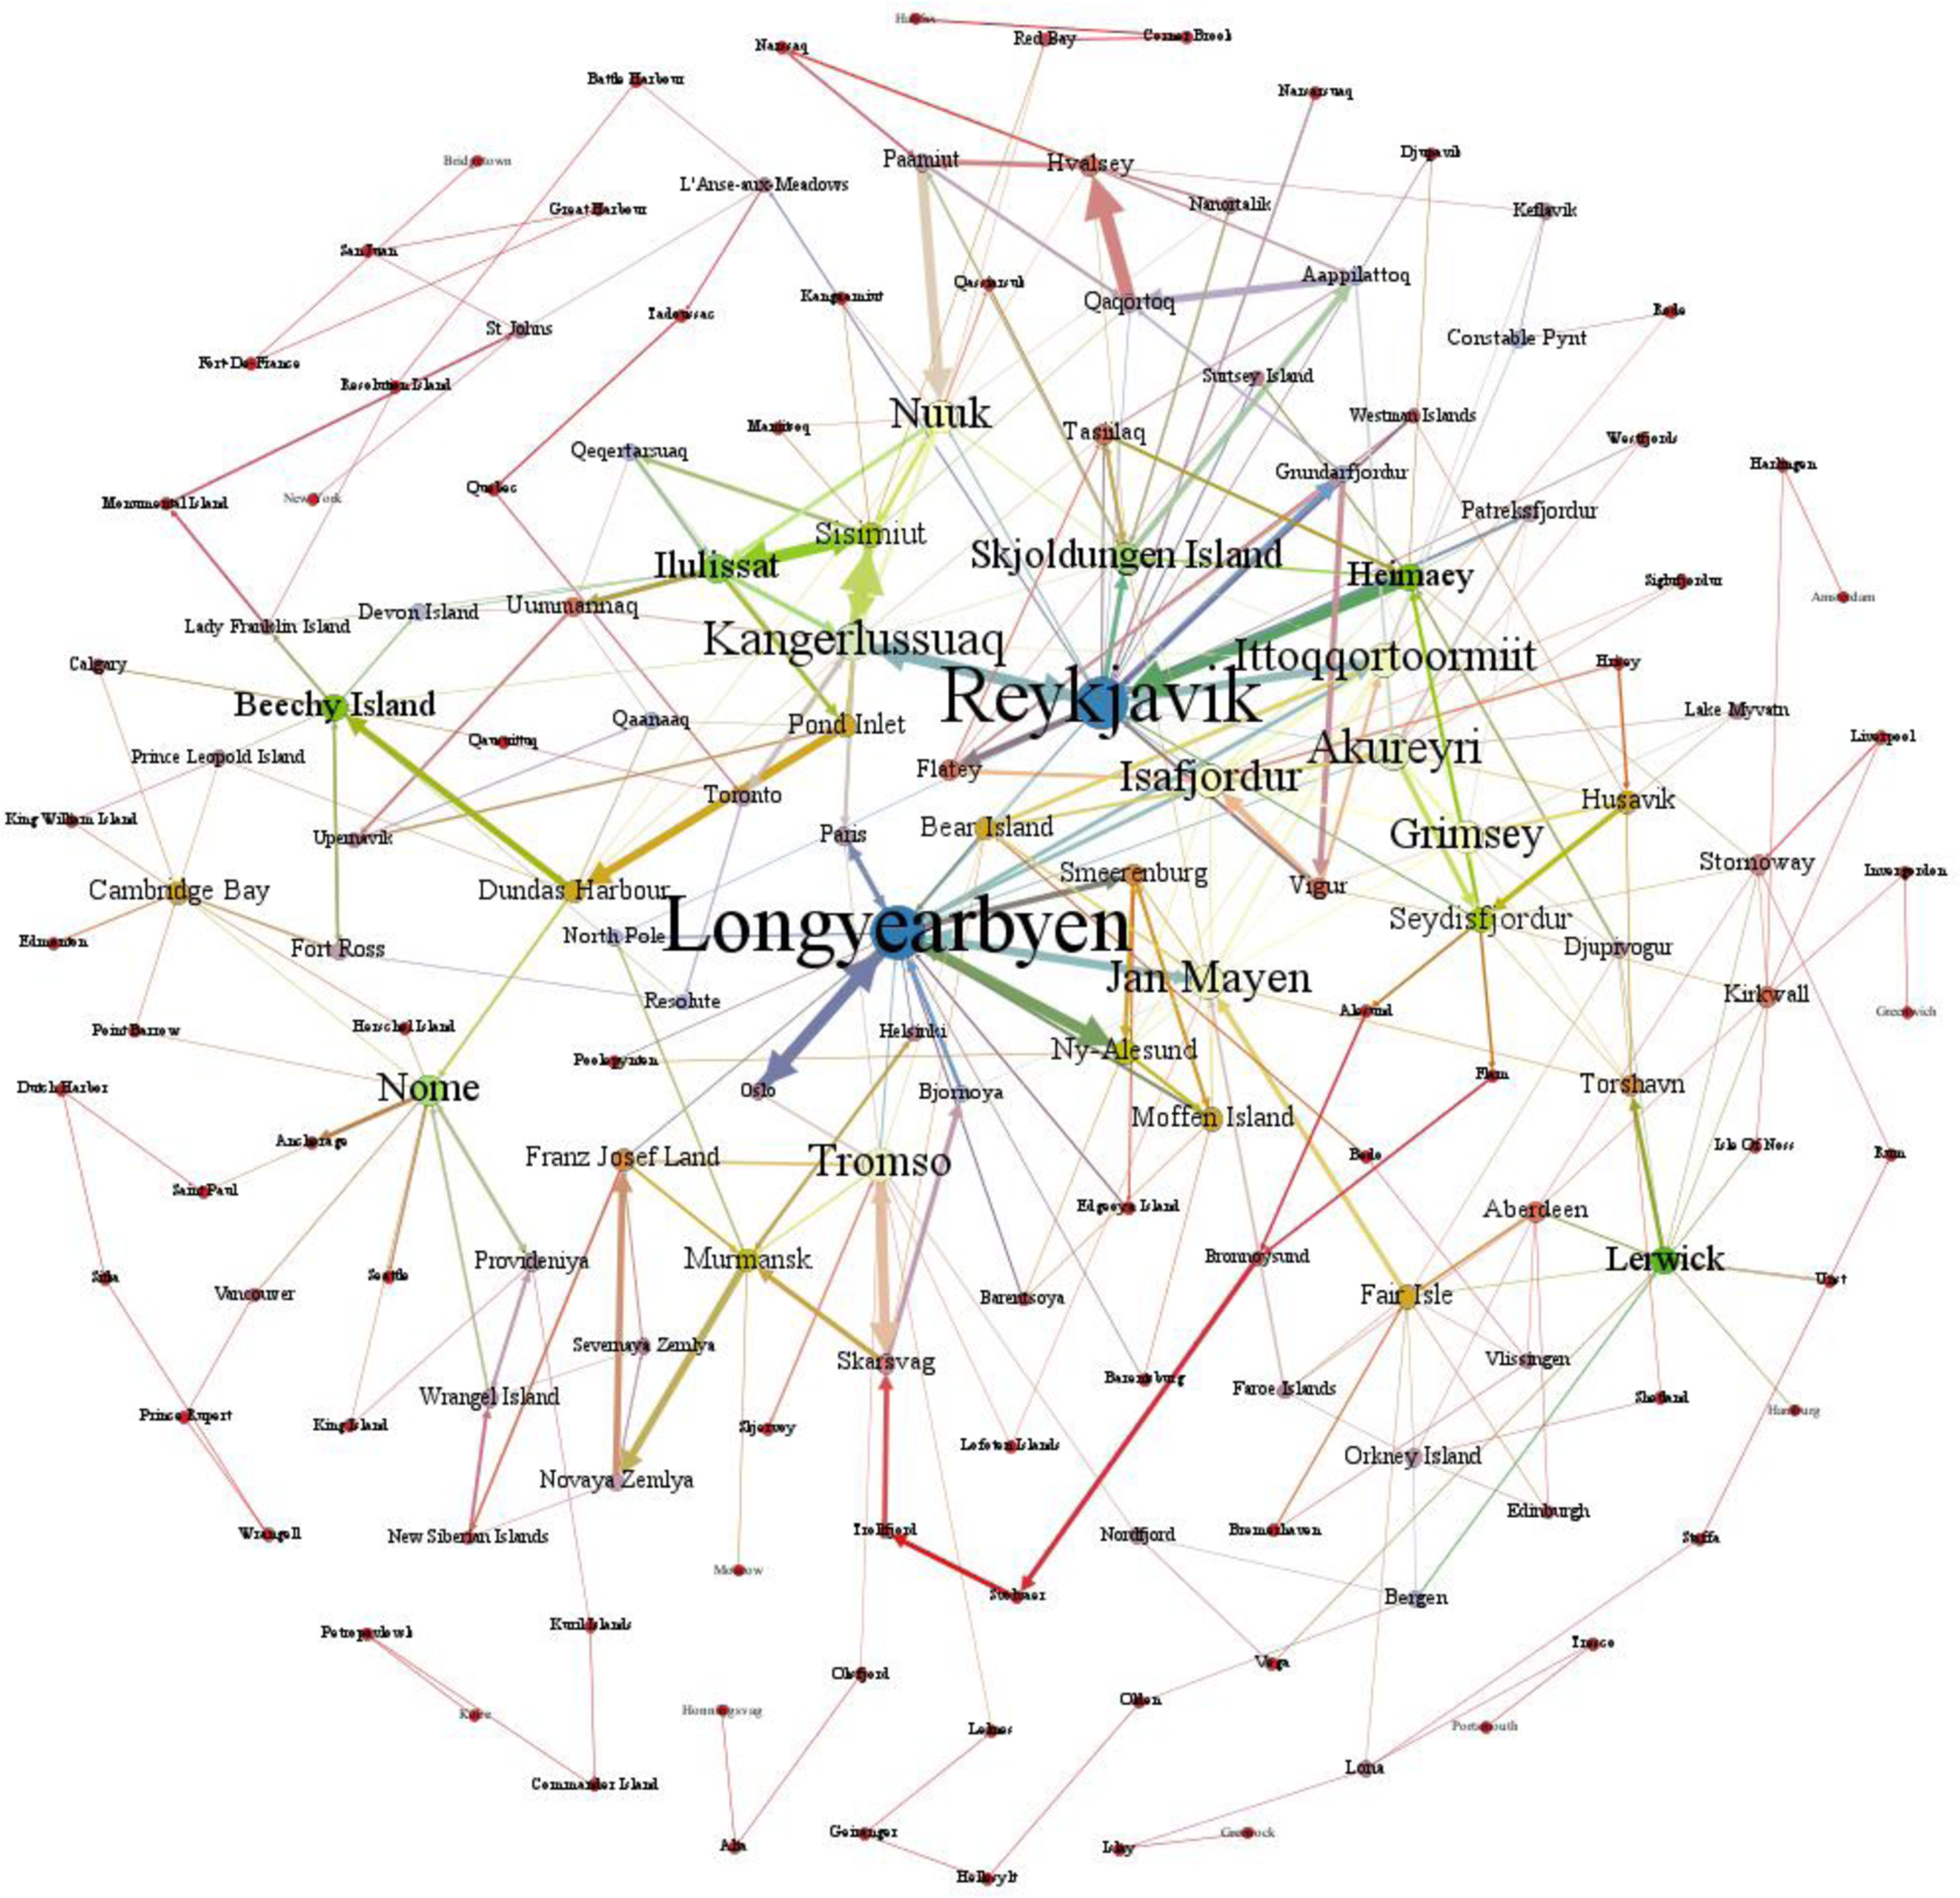
The cruise itinerary is a chain that starts from the departure port and stops at multiple ports of call (Alves & Santos, Reference Alves and Santos2022). In order to deeply discuss the structural characteristics of the Arctic adventure cruise shipping network, this study uses Gephi software as the analysis tool (Wajahat et al., Reference Wajahat, Nazir, Akhtar, Qureshi, Razaque and Shakeel2020) and uses the Fruchterman-Reingold algorithm to build and analyse the Arctic adventure cruise shipping network (Jacomy, Venturini, Heymann, & Bastian, Reference Jacomy, Venturini, Heymann and Bastian2014). The point size is distinguished by the point degree value, and the point map of the Arctic adventure cruise itinerary ports is obtained (Fig. 2). The Arctic adventure cruise shipping network has formed a spatial network structure with Reykjavík and Longyearbyen as the dual cores and Kangerlussuaq as the sub-core.
Point map of Arctic adventure cruise itinerary ports.
Source: Authors’ elaboration based on cruise shipping network data.
Centrality analysis of port points
Using the statistical function of Gephi 0.9.7 degree and betweenness centrality, this study analyses 39 departure ports and 119 ports of call of the Arctic adventure cruise shipping network and identifies the core points of the Arctic adventure cruise shipping network.
According to the analysis of degree centrality, the degree centrality value of each port is between 0 and 0.12. Longyearbyen and Reykjavík have a high degree centrality, with values of 0.111 and 0.11, respectively, which are far higher than the third port, Kangerlussuaq (0.07), and are at the centre of the Arctic adventure cruise shipping network. This can be attributed to that Longyearbyen and Reykjavík are, respectively, the departure ports of Svalbard and Iceland with convenient transportation and unique tourism resources, which can attract other ports to establish direct itinerary links with them. The degree centrality value of 15.8% of ports is between 0.03 and 0.07, including six departure ports such as Kangerlussuaq and Tromsø (0.06) and 19 ports of call such as Ittoqqortoormiit (0.06) and Jan Mayen (0.06). These ports have relative advantages in geographical location, between the centre and the edge of the Arctic adventure cruise shipping network. For example, as the departure port and main transportation hub of Greenland, Kangerlussuaq has become the preferred port for Arctic adventure cruises. Ittoqqortoormiit is close to Northeast Greenland National Park and is a vital port of call for Greenland navigation. The number of ports with the degree centrality value less than 0.03 is the largest, including 31 departure ports such as Aberdeen (0.025) and Paris (0.02), and 100 ports of call such as Franz Josef Land (0.029) and Tórshavn (0.029), accounting for 82.9% of the total number of Arctic ports. Among them, about 62.6% of ports' degree centrality is less than 0.01. The departure ports of the degree centrality less than 0.01 account for 56.4% of all Arctic departure ports. Due to the restriction of port conditions, these ports are located at the edge of the network structure, and most of them are only connected to important ports in the network. The reason why most of the departure ports are at the edge is that they have low latitude, few adventure cruise itineraries and few ports directly connected.
From the perspective of betweenness centrality, Reykjavík (0.2), Kangerlussuaq (0.18) and Longyearbyen (0.16) are in the forefront and occupy key position in itinerary setting. Among 125 ports with betweenness centrality value greater than zero, there are only eight ports with betweenness centrality value greater than 0.1, and the number of departure ports is up to 87.5%. In addition to Reykjavík, Kangerlussuaq and Longyearbyen, it includes four departure ports of Nome (0.13), Nuuk (0.13), Tromsø (0.12), Akureyri (0.11), and port of call, Ittoqqortoormiit (0.11). Nuuk, Nome, Tromsø and Akureyri have high betweenness centrality because they play a key role in the Arctic adventure cruise shipping network as important departure ports in the Arctic; as a port of call of Greenland navigation, Ittoqqortoormiit shows a strong transit function. Although the absolute difference of betweenness centrality among ports is small, the relative difference is still obvious. The first port, Reykjavík, is 1.11 times more than Kangerlussuaq, 1.33 times more than Longyearbyen and 1.54 times more than Nuuk, reflecting the important connection position and control ability of Reykjavík in the network.
Under the joint constraint of ports’ degree and betweenness centrality, the Arctic adventure cruise shipping network has formed a spatial structure with Reykjavík and Longyearbyen as the dual-core ports and Kangerlussuaq as the sub-core port.
Analysis of shipping network contact strength
In order to describe the overall structural characteristics of the Arctic adventure cruise shipping network, the relevant indicators of 431 edges of the Arctic shipping directional network are calculated using the statistical function of Gephi 0.9.7. According to the analysis, the contact strength of the Arctic adventure cruise shipping network is low.
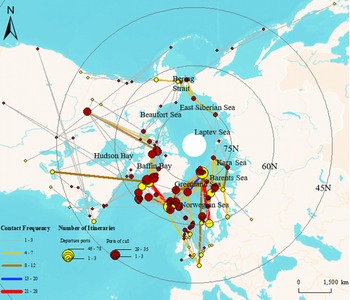
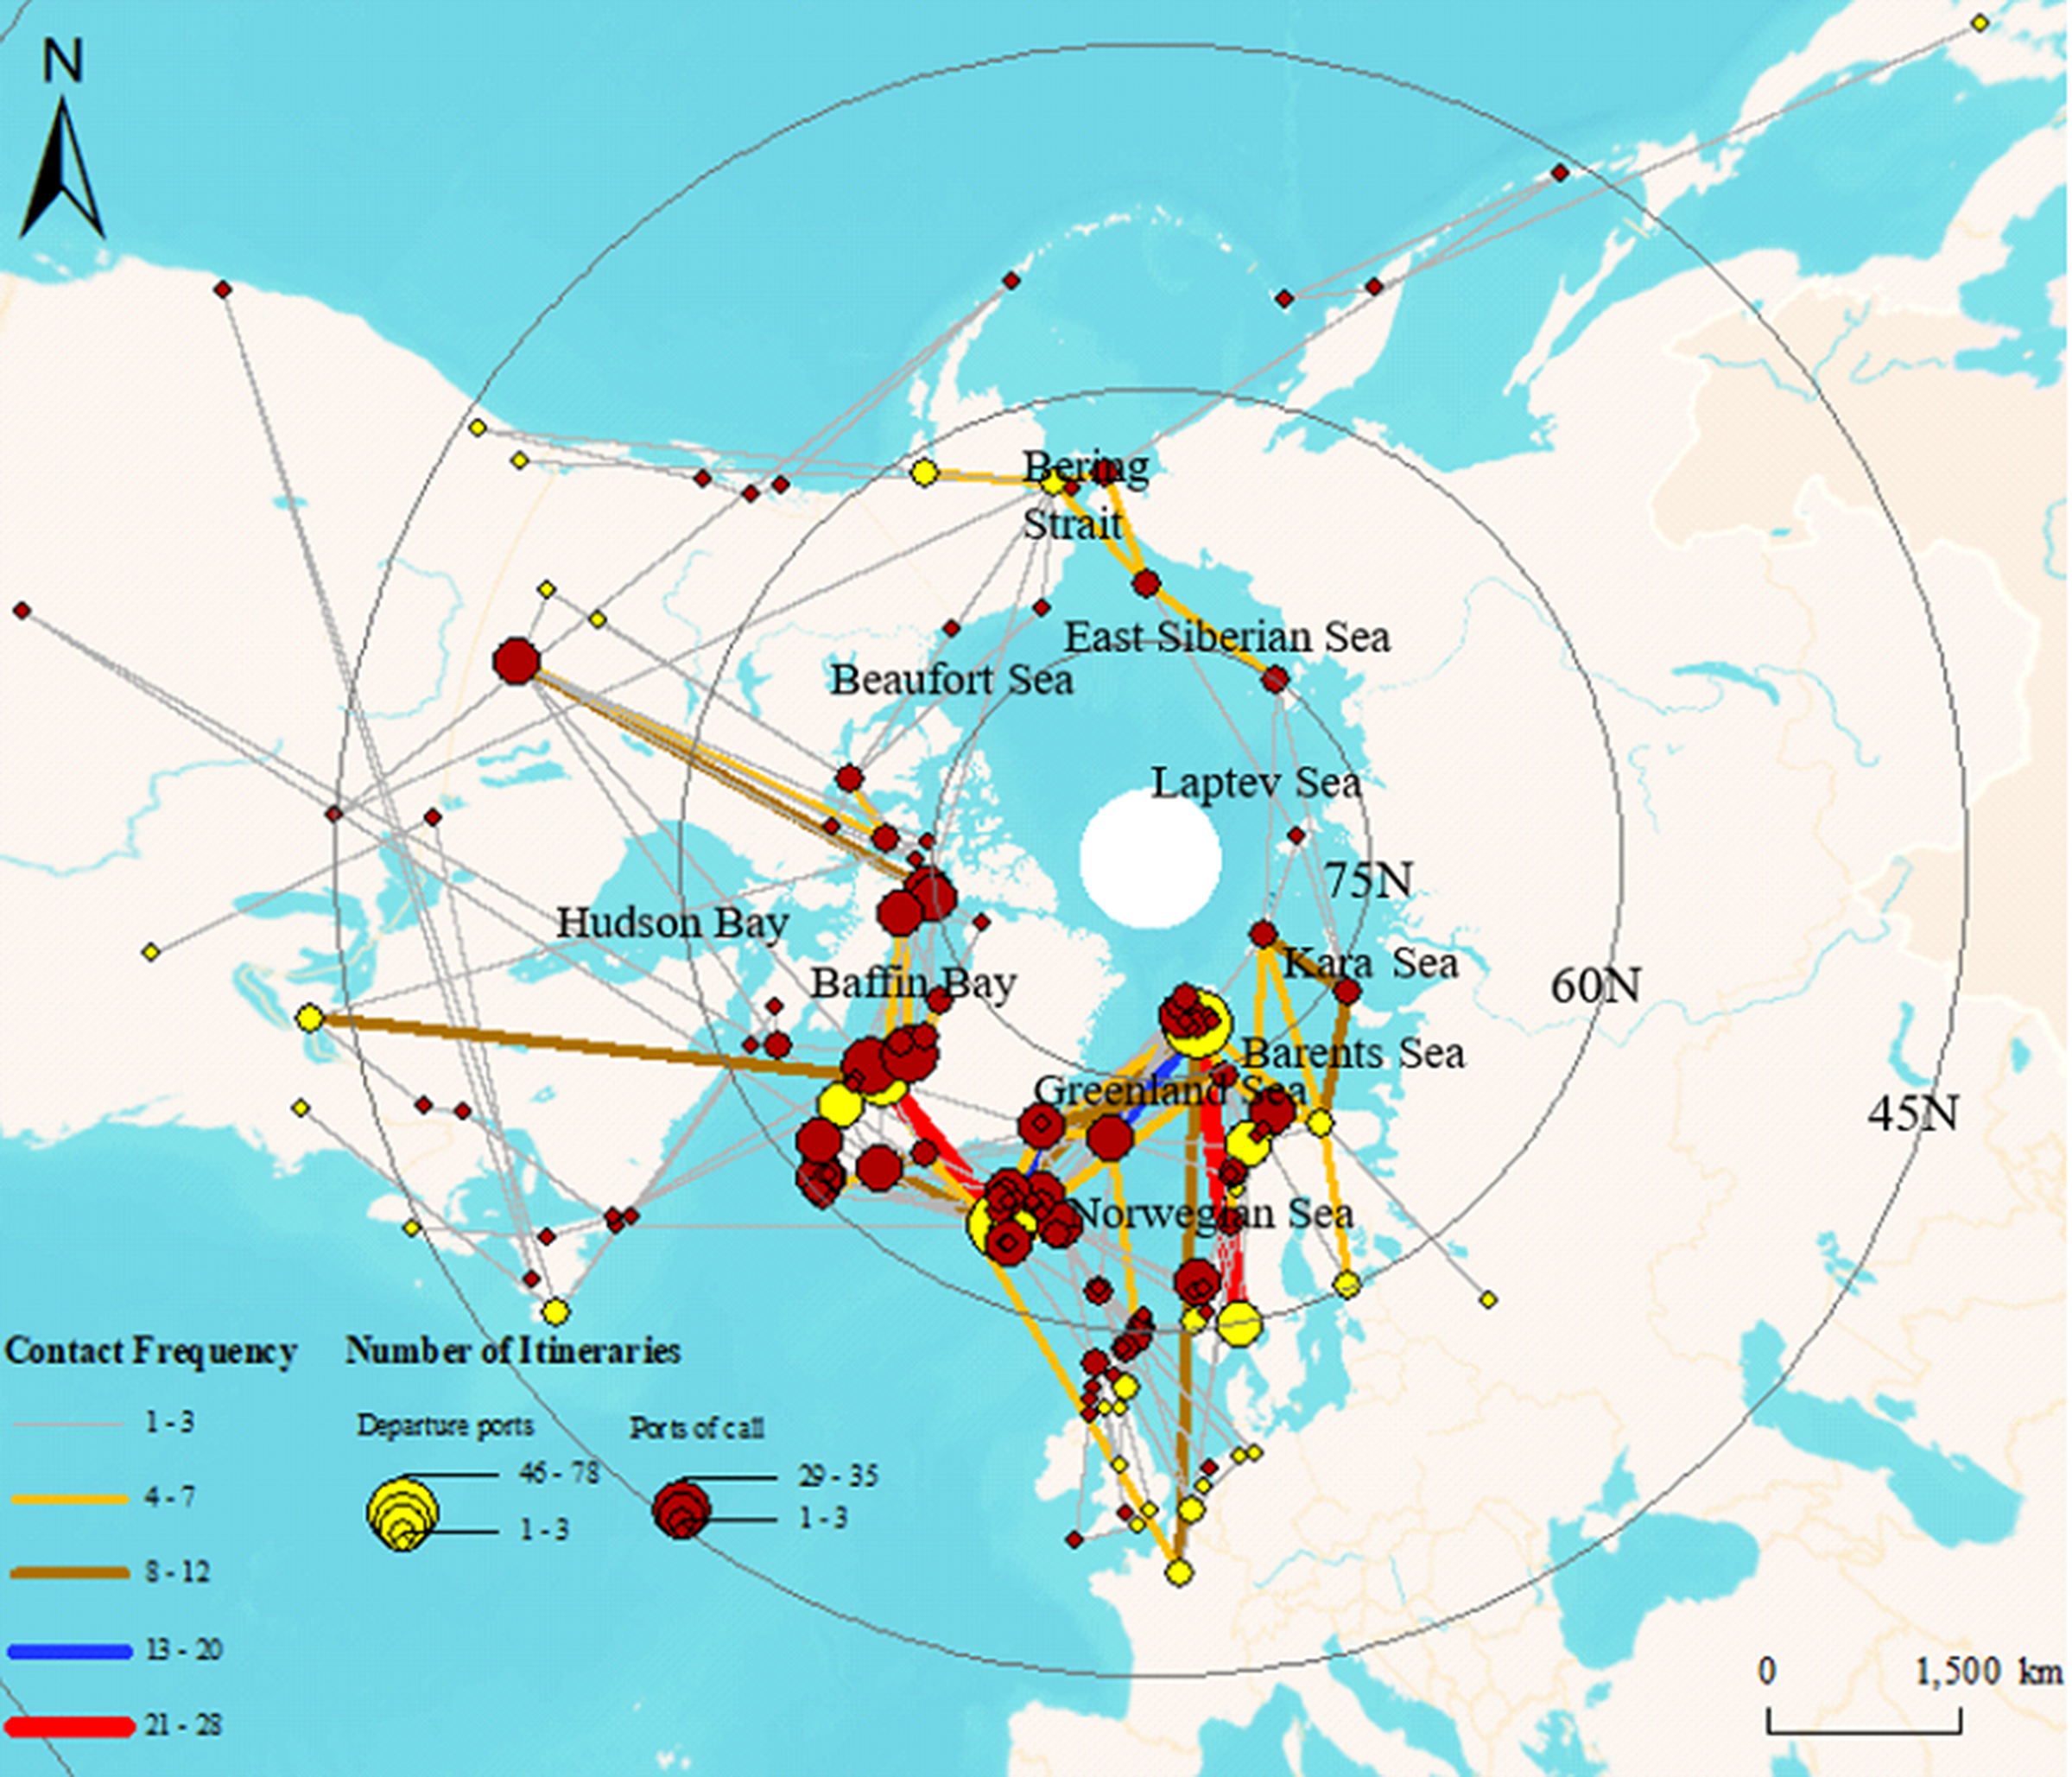
According to Arc-GIS natural breaks method, the number of itineraries at the departure ports is divided into five levels, and the number of itineraries at the ports of call is divided into four levels based on the number of itineraries at the departure ports (Fig. 3). According to the analysis, nearly 56.3% of ports have 1–3 itineraries, of which the departure ports accounts for 56.4% of all the departure ports. In particular, the number of itineraries of 42 ports of call such as Point Barrow and Oksfjord and 11 departure ports represented by Olden and Amsterdam is only one. In total, 26.6% of ports have between 4 and 14 itineraries, including 10 departure ports such as Nome (14) and Paris (13) and 32 ports of call such as Franz Josef Land (12) and Smeerenburg (12). A total of 17.3% of ports with more than 14 itineraries have nearly 71.5% of itineraries in the Arctic, and the departure ports account for 23.5% (Table 2). Among them, Reykjavík and Longyearbyen, the two core ports, have the largest number of itineraries, with 78 and 70 itineraries, respectively, followed by the sub-core port of Kangerlussuaq, with 45 itineraries. This is closely related to their geographical location, hinterland economy, tourism resources and other factors. To sum up, the itineraries of Arctic adventure cruise ports are unevenly distributed, and most ports have a small number of connecting itineraries, mainly one to three. Through calculation, the average degree of each port is 2.706, that is, the average number of itineraries for each port is about three. Compared with the middle- and low-latitude regions, the average degree of Arctic ports is relatively small, and the average itineraries of ports are few (Sun & Lin, Reference Sun and Lin2020).
Distribution of ports and itineraries in the shipping network.
Source: Authors’ elaboration based on cruise shipping network data.
Statistical indicators of shipping network contact strength

Source: Authors’ elaboration based on cruise shipping network data.
In order to explore the contact strength of the Arctic adventure cruise shipping network, the weight of 338 edges of the Arctic shipping undirected network is calculated by using the statistical function of Gephi 0.9.7. According to ArcGIS natural breaks method, the weights are divided into five levels (Fig. 3). The contact frequency of 74.9% of port pairs is between one and three. In total, 21.9% of port pairs have 4–12 connections. Only 11 port pairs have established contact frequency no less than 15 times (Table 2), of which four port pairs have contact frequency between 24 and 28, and that of Kangerlussuaq and Sisimiut is the highest, 28 times. Therefore, the main ports in the Arctic adventure cruise shipping network are in low contact frequency, with the number of contacts concentrated 1–3 times.
Using the network diameter statistical function of Gephi 0.9.7, it is calculated that the network diameter of the Arctic adventure cruise shipping network is 18, that is, the maximum value of the shortest path between any two ports is 18, which is lower than the middle and low latitudes (Sun & Lin, Reference Sun and Lin2020), indicating that there are fewer ports for Arctic adventure cruise itineraries. Specifically, there are 101 itineraries attached to 3–7 ports in the Arctic adventure cruise shipping network, accounting for 58.7% of all itineraries. Among them, the medium itineraries of 8–17 days account for 90.1%, and the number ratio of round-trip and one-way itineraries in the medium itineraries is about 1.2:1. About 34.9% of adventure cruise itineraries have between 8 and 22 ports, and only one 28-day one-way itinerary has 22 ports, of which about 51.7% are medium itineraries, and the number of round-trip and one-way itineraries in the medium itineraries is the same. There are only 11 itineraries with two ports, accounting for 6.4% of all itineraries in the Arctic, of which the medium itineraries account for 90.9%, and the number ratio of round-trip and one-way itineraries in the medium itineraries is 4.5:1 (Table 2). To sum up, under the influence of the special geographical environment of the Arctic, there are few ports for adventure cruise itineraries, mainly 3–7.
Using the statistical function of average path length and average clustering coefficient of Gephi 0.9.7, the average path length of Arctic adventure cruise shipping network is 5.427, which indicates that the connection between the departure port and the destination port of any itinerary needs to be completed through about five segments. The average path length is slightly small, and the average number of ports on the itineraries is small, showing that the Arctic adventure cruise ports have higher accessibility and lower degree of separation. However, the average clustering coefficient is 0.213, which is lower than that in the middle and low latitudes (Sun & Lin, Reference Sun and Lin2020), reflecting the poor cohesion among ports, which is consistent with the current situation that cruise ports in the Arctic are not closely connected.
With the graph density statistical function of Gephi 0.9.7, the density of the Arctic cruise shipping network is 0.017. Because there are fewer port points and fewer itineraries in the Arctic, the network density is higher than that in the middle and low latitudes (Sun & Lin, Reference Sun and Lin2020). This shows that the space of the Arctic adventure cruise shipping network is relatively complete, and the cruise ports are relatively concentrated in the region.
In general, the Arctic adventure cruise shipping network is characterised by fewer average itineraries on ports, low contact frequency between port pairs, fewer ports on the itineraries, high accessibility but poor cohesion between ports and complete network space.
System differentiation of regional network
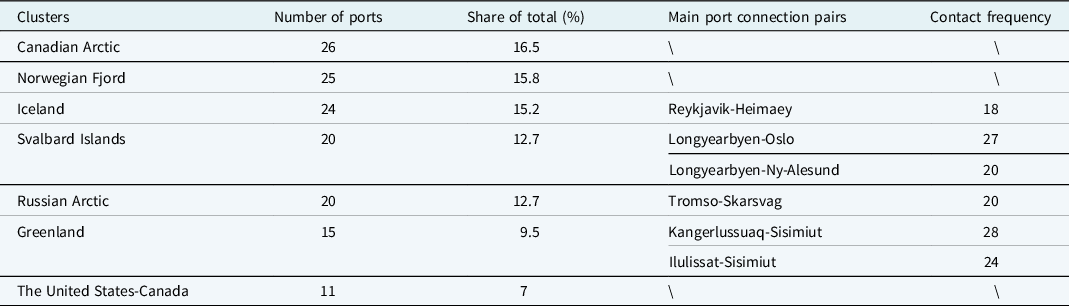
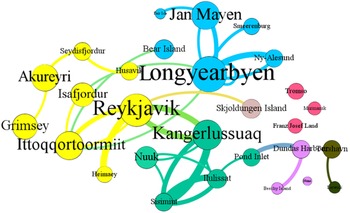
In order to further study the spatial structure of the shipping network, the edge table data is imported into Gephi to obtain a preliminary Arctic adventure cruise shipping network structure. Based on the OpenOrd algorithm in Gephi (Jacomy et al., Reference Jacomy, Venturini, Heymann and Bastian2014), the network is modularised, and the submodules are identified. Different modules are marked with different colours, and the point size and line thickness are divided according to point degree value and itinerary contact frequency (Fig. 4). The value of modularity of the Arctic adventure cruise shipping network reaches 0.624, indicating that the social network analysis has a good effect on the community division of the Arctic shipping network, and the cluster structure in the network is clear. The Arctic adventure cruise shipping network has formed seven clusters: Iceland, Svalbard Islands, Greenland, Canadian Arctic, Russian Arctic, Norwegian Fjord and the United States-Canada.
Structure of Arctic adventure cruise shipping network.
Source: Authors’ elaboration based on cruise shipping network data.
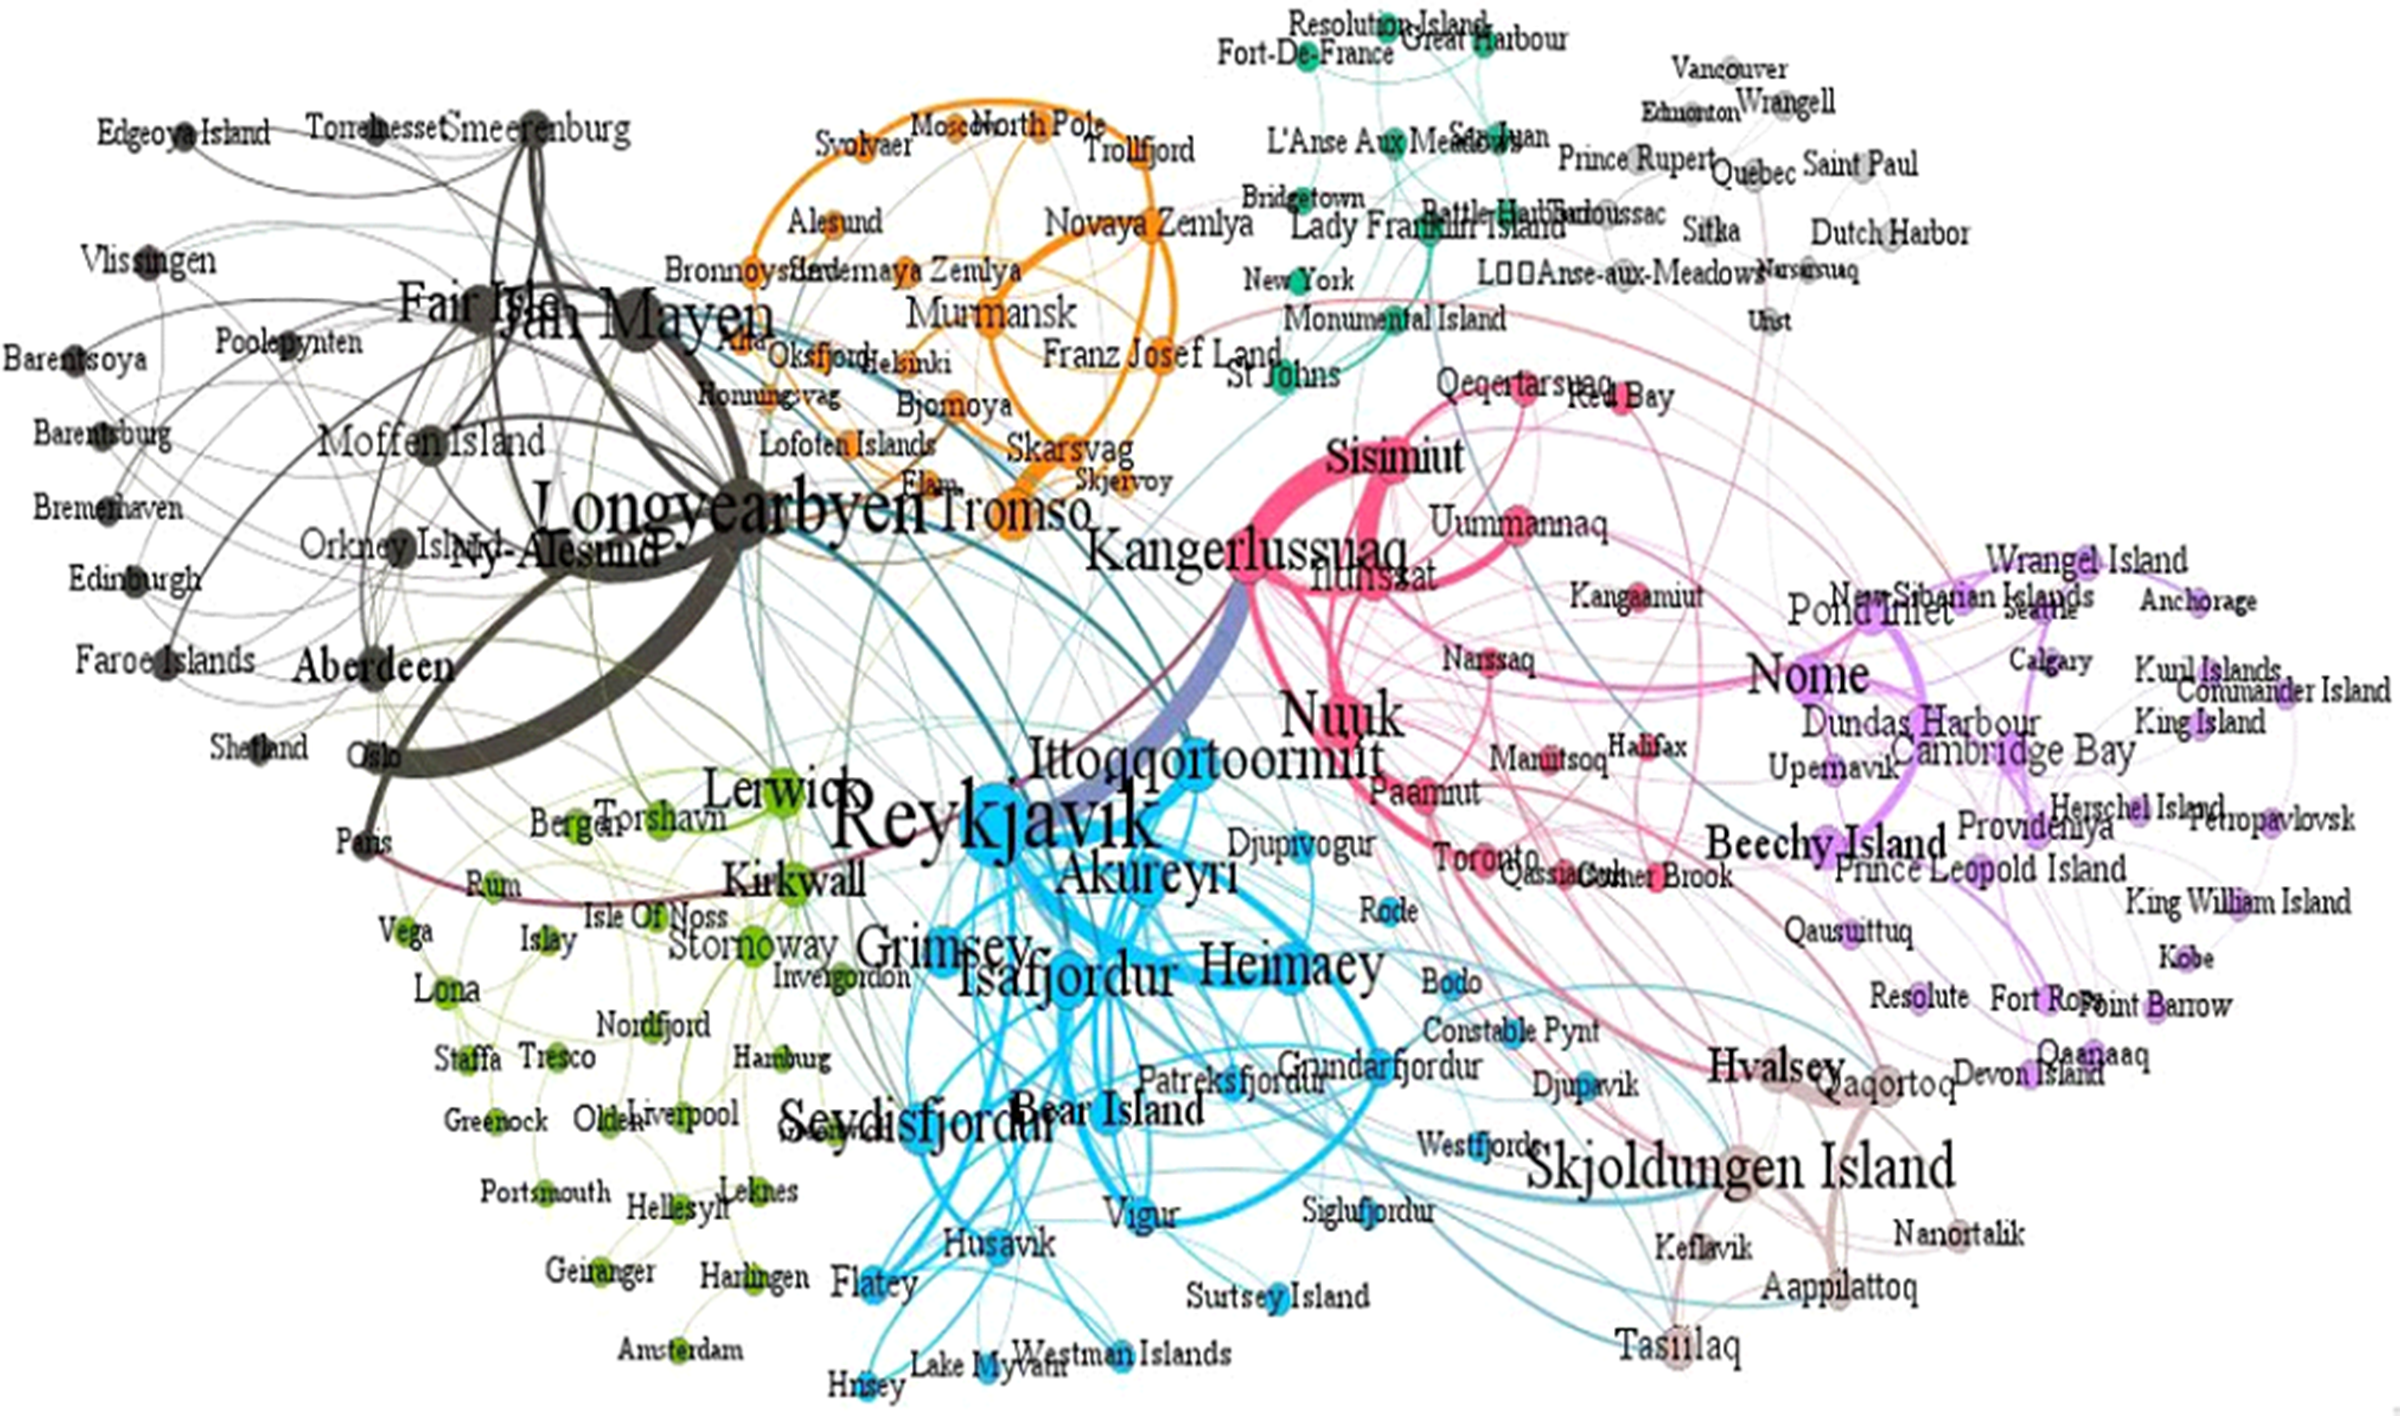
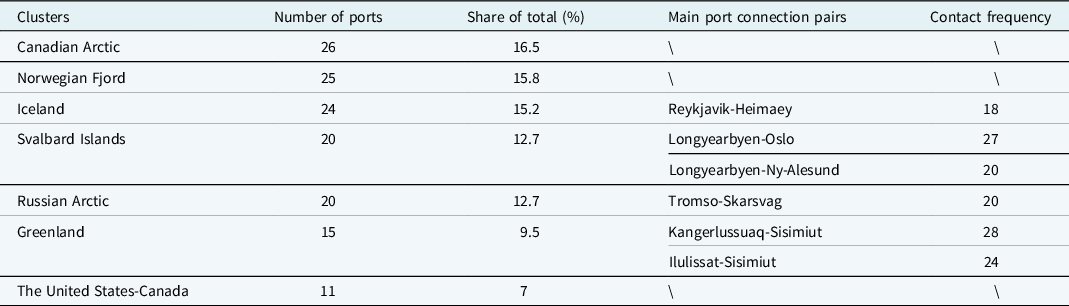
The Iceland cluster is centred on Reykjavík, with a total of 24 ports, accounting for about 15.2% of all ports in the Arctic, including three departure ports of Bodø, Reykjavík and Akureyri. The ports in the cluster are more closely connected, especially Reykjavík-Heimaey (18 times).
The Svalbard cluster takes Longyearbyen as the core port, with internal ports accounting for 12.7% of the total, including seven departure ports such as Longyearbyen and Oslo, accounting for 21.2% of all departure ports. Although the internal connection of the cluster is not as dense as that of Iceland, it is still very dense, with Longyearbyen-Oslo (27 times) and Longyearbyen-Ny-Ålesund (20 times) as the main connections. It is worth noting that Paris and Oslo are not ports in the Svalbard Archipelago, but as important ports to enter Svalbard, they have become important departure ports in the Arctic. Under the joint influence of port level and itinerary connection, these two clusters are the core clusters of the Arctic adventure cruise shipping network.
The number of ports in the Greenland cluster with Kangerlussuaq as the centre is small, accounting for only 9.5% of the total. There are four departure ports, including Kangerlussuaq and Nuuk. The ports in the cluster are closely connected, especially with Kangerlussuaq-Sisimiut as the absolute leader. The itinerary contact frequency between the two ports is the largest, 28 times. In addition, the contact frequency between Ilulissat-Sisimiut is 24, which is the main connection of Greenland cluster. As Kangerlussuaq is a sub-core port, and the itinerary contact frequency of Greenland group is high, it is divided into the sub-core cluster of Arctic adventure cruise shipping network.
In addition to the above clusters, the Canadian Arctic Cluster with Nome as the centre has also formed, including 26 ports, accounting for 16.5% of all Arctic ports. Norwegian fjord cluster with Lerwick as the centre accounts for 15.8%. Russian Arctic Cluster with 20 ports centred on Tromso accounts for 12.7%. The United States-Canada cluster centred on St Johns only accounts for 7% of the total. Most of the ports in these four clusters are located at the edge of the Arctic adventure cruise shipping network and have not played a strong role in the entire network structure. In addition to the port pair, Tromso-Skarsvag in the Russian Arctic cluster has 20 itinerary connections, and the internal connections in the cluster are relatively dense, the other three clusters are all in extremely low contact frequency (Table 3). The number of connections is concentrated one to three times, and there are no obvious port pairs. Therefore, they are divided into marginal clusters of the Arctic adventure cruise shipping network.
Modular structure distribution and itinerary connection statistics of Arctic adventure cruise itinerary layout
Source: Authors’ elaboration based on cruise shipping network data.
The external contact frequency is generally less than that of internal contacts in the cluster, and the characteristics of external contact in the clusters are relatively different. In the shipping network of linking Iceland and Greenland, port contact pairs with high itinerary contact frequency, such as Reykjavík-Kangerlussuaq, have 26 itinerary contacts. The clusters of Iceland and Svalbard Islands are connected across regions mainly through Reykjavík and Ittoqqortoormiit, and their itinerary connection value is 15 times. However, there is little contact between the Svalbard and Greenland clusters, and there is no obvious main port connection pair.
In order to identify the core system of the Arctic adventure cruise shipping network, K-core filtering method is adopted to retain points with point degree of no less than nine and edges with itinerary contact frequency of no less than five (Wang, He, Wang, Feng, & Chua, Reference Wang, He, Wang, Feng and Chua2019). Finally, 28 points and 32 edges are obtained (Fig. 5). It can be clearly seen that Iceland (represented by Reykjavík) and Svalbard Islands (represented by Longyearbyen) are the dual-core clusters, and Greenland (represented by Kangerlussuaq) is the sub-core cluster, which together form the core system of the Arctic shipping network.
Core system of Arctic adventure cruise shipping network.
Source: Authors’ elaboration based on cruise shipping network data.
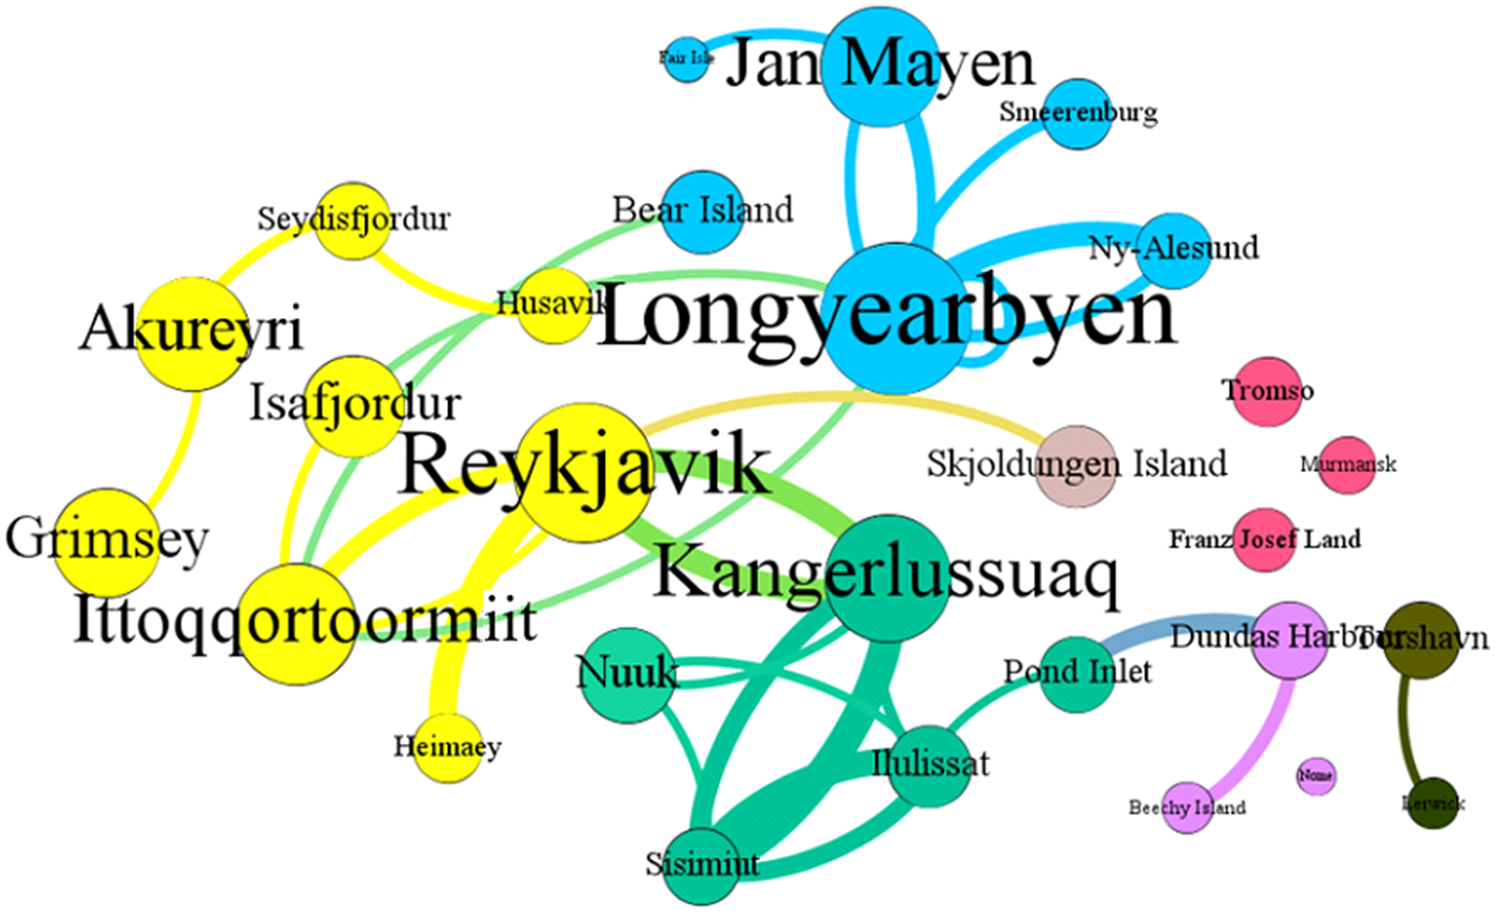
There are eight port points in the Iceland cluster, accounting for 28.6% of the total filtered points, of which three port pairs have six contacts, and three port pairs have contact frequencies between 15 and 20. The Svalbard Islands cluster includes six ports, accounting for 21.4%. There are three port pairs with 6–10 itineraries, and the contact frequency of the two port pairs is 16 and 20, respectively. Greenland cluster has five ports, accounting for only 17.9%, of which five port pairs have contact frequencies between 6 and 10, and two port pairs have contact frequencies of 24 and 28, respectively.
To sum up, the Arctic adventure cruise shipping network has formed two core ports of Reykjavík and Longyearbyen, and a sub-core port of Kangerlussuaq, which has a relatively low contact strength of the shipping network. From the perspective of the centrality of the port points and the contact strength of the shipping network, it is found that the Arctic shipping network has formed dual-core clusters of Iceland and Svalbard Islands and a sub-core cluster of Greenland.
Discussion and conclusion
Because of its special landscape, the Arctic has become a tourist attraction with strong attraction and a unique cruise shipping network. The study finds that most Arctic adventure cruise itineraries are medium itineraries of 8–17 days, which are significantly different from the short itineraries of 7 days dominated by mid- and low-latitude cruise itineraries. The ratio of one-way itineraries to round-trip itineraries is about 1:1, and it is concentrated in medium itineraries. The Arctic adventure cruise shipping network has formed a spatial pattern with Longyearbyen and Reykjavík as the dual-core ports and Kangerlussuaq as the sub-core port, with significant differences in the degree and betweenness centrality of ports. By using the statistical function of Gephi 0.9.7, it is analysed that the contact strength of the Arctic adventure cruise shipping network is relatively low, the port itineraries are mainly concentrated 1–3 and the contact frequency between ports is low, ranging from 1 to 3 times, and the number of ports connected to the itineraries is small, mostly 3–7. The accessibility between ports is high, but the cohesion is poor, and the network space is relatively complete, which is significantly different from the middle- and low-latitude regions. According to Gephi’s modular analysis, the Arctic adventure cruise shipping network is divided into seven clusters, including the Iceland cluster and the Svalbard Islands cluster. The Iceland and Svalbard clusters are the dual-core clusters of the shipping network, and the port centrality within the clusters and the contact strength between ports are generally high. As the sub-core cluster of the shipping network, the Greenland cluster has relatively high centrality and contact strength of internal ports. The connection density between the three core clusters is large and larger than that outside the clusters, while the port centrality of the other four edge clusters is low and the regional distribution and internal connection are relatively scattered.
Based on the Arctic adventure cruises, this study deeply reveals the spatial organisation characteristics and rules of the Arctic cruise shipping network through the systematic analysis of the Arctic cruise port differentiation, itinerary structure and shipping network system, which is helpful for scientific research and judgement of the development pattern of cruise shipping in the Arctic region. With the rapid development of polar adventure cruises and the change in regional physical and geographical environment, the Arctic adventure cruise shipping network will further evolve. Through the analysis of cruise ports, shipping networks and other aspects, it can provide scientific reference for the future development of Arctic cruise destinations and port management to a certain extent.
-
(1) Iceland and Svalbard Islands, with Reykjavík and Longyearbyen as the core departure ports, respectively, are the core clusters of Arctic adventure cruise shipping network and have formed obvious competitiveness. In the future, with the increasing number of Arctic adventure cruise companies and cruises, the network scale and network density of these core clusters will be further improved, as well as the flight organisation scale and regional centrality value of Reykjavík and Longyearbyen ports. Although the expanded scale of cruise tourism can significantly improve the economic benefits of tourist destinations, the development of cruise economy should not be at the expense of ecological environment. The current economic development of Arctic cruises has resulted in increasing environmental pressures such as greenhouse gas emissions and natural resource consumption, which have had a negative impact on local wildlife and residents’ lives (Saviolidis, Cook, Davíðsdóttir, Jóhannsdóttir, & Ólafsson, Reference Saviolidis, Cook, Davíðsdóttir, Jóhannsdóttir and Ólafsson2021). To this end, the Icelandic Government has proposed strict regulations to effectively ban the use of heavy fuel oil (ships of all kinds, including cruises) in Icelandic territorial waters by 2020 (Saviolidis et al., Reference Saviolidis, Cook, Davíðsdóttir, Jóhannsdóttir and Ólafsson2021). The Svalbard community has also developed a tourism master plan aimed at limiting the impact of tourism on the fragile Arctic environment and Longyearbyen. Therefore, we believe that the future expansion of the cruise shipping network should be limited and fully respect the protection of local natural environment. These regions can develop higher-end Arctic cruise itinerary products, even raise the cruise operation barriers constrained by environmental factors, and actively achieve the balance between economy and environment through regional cooperation (Shijin et al., Reference Shijin, Yaqiong, Xueyan and Jia2020).
-
(2) For the Greenland sub-core cluster with Kangerlussuaq port as its core departure port, cruise tourism has brought considerable economic income and employment opportunities to the local area (Cook & Johannsdottir, Reference Cook and Jóhannsdóttir2021). But Kangerlussuaq port itself does not have a large land source market, and the organisation of its original itinerary benefits from the design of the “air-cruise itinerary.” Therefore, on the premise of ensuring environmental protection, the government authorities unilaterally expand the investment in cruise port infrastructure and improve the port service capacity, which is difficult to create more economic income. Instead, attention should be paid to the improvement of the service capacity of the airport of port city, so as to meet the demand of transporting more cruise passengers to the departure ports through air passenger transport in the future. Therefore, the cruise strategy in this region should be the coordinated development of air passenger transport and cruise ports.
-
(3) The Russian Arctic and the Canadian Arctic are currently located at the edge of the Arctic adventure cruise shipping network. The relative competitiveness of the two regions remains low in the short term. Therefore, local governments and communities need to be cautious in their efforts to improve the level of modern port services and increase the attractiveness of port and itinerary choices for cruise companies (Dawson, Johnston, & Stewart, Reference Dawson, Johnston and Stewart2017). Blind port expansion is likely to cause idle port facilities and waste port resources (Goldstein, Lynch, Yan, Veland, & Talleri, Reference Goldstein, Lynch, Yan, Veland and Talleri2022). But in the long run, competition from existing popular Arctic adventure cruise itineraries such as Kangerlussuaq-Sisimiut, Longyearbyen-Oslo and Ilulissat-Sisimiut will intensify as flight density gradually reaches saturation due to significant seasonality and the entry of new cruise companies. This will encourage cruise companies to actively explore new ports to open up new polar adventure cruise itineraries. As a result, the size of the flight organisation, including the departure ports of Nome, Nuuk and Tromso, is likely to be increased and gradually upgraded to become the regional core organisation ports for the new polar cruise itineraries. To some extent, this will promote the evolution of the Arctic adventure cruise shipping network pattern and form a new regional network structure and space cluster.