1. Introduction
The study of aerodynamic acoustics originated from the noise issues encountered in aviation. Attention has increasingly been directed towards the complex noise phenomena generated by the airflow around aircraft. With the continuous development of the aviation sector and the sharp increase in air traffic, aviation noise has become one of the primary concerns in the industry’s growth. Over the past few decades, the emerging field of aeroacoustics has become highly active, guided by acoustic analogy theory. Computational aeroacoustics has been developed to calculate the far-field characteristics of acoustic waves in complex flow fields and has been widely used in engineering. Aeroacoustics has made significant achievements in acoustic far-field prediction, but for decades the identification of noise sources has remained unsatisfactory. To date, many theories related to aeroacoustics still cannot fully answer the question of ‘who the sound source is’. In addition, the intrinsic physical mechanisms of how the formation, evolution and interaction of complex turbulent structures affect the generation, propagation, and radiation characteristics of sound waves are still not fully understood. This is an urgent issue to be addressed in the field of aeroacoustics.
Since the late 1940s, the prediction and suppression of jet engine noise have become urgent technological challenges. Several theories emerged, with Lighthill’s work being the most iconic. Lighthill (Reference Lighthill1952) pioneered the ‘acoustic analogy’ theory. Lighthill’s theory is derived from the decomposition and reorganisation of the continuity equation and momentum equation in conservation form, establishing a non-homogeneous wave equation to describe the generation of sound waves, and introducing the Lighthill stress tensor as an equivalent source term for the quadrupole source. Curle (Reference Curle1955) derived a complete integral solution to the Lighthill equation for noise radiation in a flow field over a stationary solid surface. It indicates that under low-Reynolds-number flow, the contribution of the dipole to the total noise significantly exceeds that of the quadrupole, which dominates in low-speed flow noise analysis. Ffowcs Williams & Hawkings (Reference Ffowcs Williams and Hawkings1969) studied the influence of arbitrarily moving solid surfaces on the sound field and proposed the Ffowcs Williams and Hawkings equation, which extended the Lighthill theory to the case of moving solid walls and showed that the sound field originates from quadrupole sources, dipole sources on the solid surface and monopole sources caused by displacement. In the context of the urgent need to address the jet noise problem, the acoustic analogy theory provides a means for quickly finding ways to control aerodynamic noise. These theories also quickly attracted the attention of both academic and engineering circles. However, the difficulty with the acoustic analogy framework is that it is impossible to provide a precise theoretical definition of the sound source, leading to the recognition that a better theory is needed.
The development of acoustic analogy theory has led to the study of improving and simplifying the Lighthill tensor on the right. Powell (Reference Powell1964) introduced the concept of vortex sound, transformed
 ${\partial }{i}{\partial }{j}{T}_{ij}$
into the divergence of the Lamb vector and proposed that unsteady vortex motion is the source of aeroacoustic noise. Powell’s vortex sound theory only predicts the far-field acoustic characteristics of unsteady vortex motion. Building on this, Howe (Reference Howe1975, Reference Howe1998, Reference Howe2003) derived a vortex sound equation that is valid for both the far and near fields. This theory deepened the understanding of the mechanism behind vortex sound generation. Kambe (Reference Kambe1986) made theoretical predictions and experimental tests on the vortex sound mechanism by studying the head-on collision of two vortex rings. The vortex sound theory is widely accepted because the motion of the vortex structure represented by the source term is much more intuitive, leading to a better understanding of the physics of the sound source. In addition, for the study of sound propagation and sound sources, Pridmore-Brown (Reference Pridmore-Brown1958) explored the refraction of linear sound waves in unidirectional shear flow. By superimposing minor disturbances on the shear flow
 $\boldsymbol{U}=U(\textit{y}){\boldsymbol{e}}_{x}$
and linearising it, the third-order Pridmore-Brown equation is derived, revealing that sound waves are distorted during propagation due to uneven fluid velocity. Phillips (Reference Phillips1960) broke away from the framework of acoustic analogy and argued that the theory needed to be rederived from the ground up. Based on the D-form Navier–Stokes (NS) equation, he derived the Phillips equation, which is valid across the entire flow field. The source terms of this equation include
 ${\textrm{tr}}({\boldsymbol{A}}^{2})$
and the entropy source. Lilley (Reference Lilley1974) referred to Pridmore-Brown’s idea and added the material derivative operator D to both sides of the Phillips equation, transforming it into a third-order flow wave equation, namely the Lilly equation. At this point, the source term on the right-hand side changed from
 ${\textrm{tr}}({\boldsymbol{A}}^{2})$
to
 ${\textrm{tr}}({\boldsymbol{A}}^{3})$
. Based on the direct numerical simulation results of the two-dimensional mixing layer
 $U({x}_{1},{x}_{2})$
as the basic flow, Colonius, Lele & Moin (Reference Colonius, Lele and Moin1997) substituted the disturbed velocity field into the source term of the Lilley equation and analysed it term by term, but the physical sound source could not be clearly identified. There is another perspective in the development of aeroacoustic source theory. It can be shown that, through Helmholtz decomposition, the motion of compressible fluid can be divided into two basic processes, namely the vector transversal process (VTP) characterised by vorticity
 $\boldsymbol{\omega }=\nabla \times \boldsymbol{u}$
and the scalar longitudinal process (SLP) characterised by kinematic quantity dilatation
 $\vartheta =\nabla {\,\boldsymbol\cdot\,}\boldsymbol{u}$
, along with scalars such as pressure, density, entropy and temperature. Lagerstrom, Cole & Trilling (Reference Lagerstrom, Cole and Trilling1949) first proposed the theory of splitting the linearised NS equations into transverse and longitudinal processes. Later, Wu (Reference Wu1956) added the effect of heat conduction. According to the research of Kovasznay (Reference Kovasznay1953), the VTP is called the vorticity mode, and the SLP consists of a sound mode and an entropy mode. The general theory of the VTP, namely vorticity and vortex dynamics, is well established. However, the corresponding SLP theory has not yet been unified, and the difficulties mainly arise in the sound mode. In the development of acoustic theory, the accurate identification of the physical sound source has never been fully resolved. Most theories focus on the propagation of sound in complex moving media rather than on its physical generation. Although vorticity has been found to be the main source of noise in turbulence, the coupling mechanism between the VTP and the SLP has not been explored. Therefore, Mao et al. (Reference Mao, Shi, Xuan, Su and Wu2011) began studying the full nonlinear and viscous equations of the sound mode. Mao et al. (Reference Mao, Kang, Wu, Yu, Gao, Su and Lu2020) performed source identification of the sound mode by observing the causal relationships inherent in the various dynamic equations related to the SLP and provided the equations of the SLP at two levels. This is also the theory on which this paper focuses, and the theoretical part is elaborated in detail later. Combined with vortex dynamics, aeroacoustic theory can be considered from the perspective of the SLP and VTP decomposition, allowing the mechanisms of the SLP and VTP to be observed simultaneously, and the physical principles of the acoustic process and its coupling with the transverse process to be understood.
Flow around a cylinder is a classic problem in fluid mechanics, featuring various flow structures such as the transition from laminar to turbulent flow, flow separation, shear layers and the Kármán vortex street. It is a classic flow for studying fluid flow characteristics and complex turbulent phenomena. As noise emission standards in industry become increasingly stringent, as an indispensable component in the industrial field, the identification of sound sources from a cylinder and the mechanisms behind the noise and flow have always been research hotspots in the field of aeroacoustics and fluid mechanics.
At present, the identification and analysis of sound sources are mainly based on pressure fluctuations. The sound sources are characterised by processing the pressure fluctuations in the flow field through various methods (Inoue & Hatakeyama Reference Inoue and Hatakeyama2002; Tamura & Tsutahara Reference Tamura and Tsutahara2010; Oguma, Yamagata & Fujisawa Reference Oguma, Yamagata and Fujisawa2013; Zhao Reference Zhao2018; Zhang, Moreau & Sanjosé Reference Zhang, Moreau and Sanjosé2019; Li, Rival & Wu Reference Li, Rival and Wu2021). The Lamb vector divergence of the vortex sound equation is also often used to characterise the sound source (Xu, Chen & Lu Reference Xu, Chen and Lu2010; Chen et al. Reference Chen, Yang, Chen, Tang, Ding and Weng2022a ; Feng, Chen & Dong Reference Feng, Chen and Dong2023). In addition to the identification of sound sources, many studies have also explored the physical mechanism between the sound source and various flow behaviours in the flow around a cylinder, and yielding many important conclusions. Gerrard (Reference Gerrard1955) conducted experimental research on the sound frequency and sound intensity produced by the flow around a circular cylinder and found that the vortex street shed by the wake generates sound with dipole properties. Etkin, Korbacher & Keefe (Reference Etkin, Korbacher and Keefe1957) applied the radiation sound equation to the flow around a cylinder and found that the sound field is related to the oscillating lift and drag forces acting on the cylinder. Blevins (Reference Blevins1984) reviewed studies on the acoustic generation of vortex shedding from a single cylinder and showed that most of the observed acoustic frequencies, directionality and intensity can be adequately predicted. However, little is known about the details of the fluid mechanics and the effects of sound on the fluid. Inoue & Hatakeyama (Reference Inoue and Hatakeyama2002) studied the sound source of a cylinder at low Mach numbers and showed that the sound pressure waves are mainly generated by vortex shedding from the surface of the cylinder into the wake. The vortices shed alternately from the upper and lower sides of the cylinder produce alternating negative and positive pulses, thereby generating sound pressure waves. Tamura & Tsutahara (Reference Tamura and Tsutahara2010) applied the Boltzmann method to directly simulate aerodynamic noise in the transonic flow around a cylinder. The study showed that the oscillating flow behind the cylinder is the sound source in a low-Mach-number flow. In the case of a flow with a Mach number of 0.7, in the absence of a shock wave, the interaction between the vortices produces a new sound source. When the Mach number is approximately 0.9, the interaction between the vortex and the weak shock wave produces a sound source. The experimental study of Oguma et al. (Reference Oguma, Yamagata and Fujisawa2013) showed that the sound source was found near the flow separation on both sides of the cylinder and in the near wake. Zhao (Reference Zhao2018) revealed that the sound source was mainly related to lift, and two sound sources were identified using sound source localisation technology. One was located upstream of the cylinder, while the other was located downstream, with the intensity of the upstream sound source being higher than that of the downstream one. Zhang et al. (Reference Zhang, Moreau and Sanjosé2019) identified the main source of far-field noise as vortex shedding through cross-correlation between near-field and far-field pressure fluctuations, while the area near the shear layer and the end of the shear layer transition in the wake served as an additional broadband noise source. Li et al. (Reference Li, Rival and Wu2021) used wavelet decomposition technology to separate radiated and non-radiated sound sources. The study found that in the near-field position above and upstream of the cylinder, the radiated sound component plays a dominant role. The pressure fluctuation generated on the surface of the cylinder in this area is one of the important sound sources. The oscillations in the near-wake area downstream of the cylinder are primarily composed of non-radiated pseudo-sound, with fewer radiated sound sources. Maryami & Ali (Reference Maryami and Ali2023) studied the effect of vortex shedding on near-field pressure and found that vortex shedding is the main factor affecting surface pressure fluctuations, particularly on the shoulder of the cylinder near the boundary-layer separation point. Maryami, Arcondoulis & Liu (Reference Maryami, Arcondoulis and Liu2024) studied the effect of local blowing on the noise of a cylinder. The results showed that local blowing modulated vortex shedding and the shear layer, which are the mechanisms causing wall pressure fluctuations. The research of Xu et al. (Reference Xu, Chen and Lu2010) shows that a wavy cylinder has a drag reduction effect. It also indicates that the acoustic characteristics are primarily determined by the evolution of the turbulent shear layer near the cylinder, and predicts that the wavy cylinder may play an effective role in acoustic control by adjusting the Lamb vector sound source. Chen et al. (Reference Chen, Yang, Chen, Tang, Ding and Weng2022a ) analysed the noise control mechanism of a wavy cylinder at different Reynolds numbers. The results demonstrate that the wavy cylinder reduces the interaction area of the positive and negative Lamb vector divergences, which contributes to the reduction of both drag and noise. Feng et al. (Reference Feng, Chen and Dong2023) studied the influence of porous media parameters on the wake and radiated noise of a cylinder in the subcritical flow region. The distribution of Lamb vector divergence in the wake region was analysed to reveal the control mechanism of the porous media on the wake and radiated noise. The results showed that the application of porous media altered the shear layer and vortex structures in the cylinder’s wake.
Previous studies have consistently demonstrated that the noise produced by the fluid flow around a cylinder is strongly correlated with the characteristic structures of the flow. The study of noise sources and flow mechanisms in cylindrical flows is inherently intertwined. However, although previous studies have generally highlighted some commonalities in the noise sources, significant differences remain, leading to a lack of a unified conclusion. More importantly, many aspects of the mechanisms behind vortex structures and noise sources remain unresolved. One of the primary challenges is the ongoing controversy regarding the noise generation mechanism. Some studies suggest that vortex shedding is the primary source of noise, while others emphasise the significant role of shear-layer separation in noise generation. To date, this debate has not reached a consensus, leaving the exact mechanism of noise generation unclear. Another key issue is that existing studies primarily use the Lamb vector divergence to capture sound source structures or rely on pressure fluctuations to identify sound sources. These methods fail to fully capture the material sound sources and do not explore the physical mechanisms of these sources or their interactions with the flow field in depth. This deficiency limits a comprehensive understanding of the noise generation process. Therefore, this paper takes a cylinder as a typical representative of the noise of the flow around a blunt body. We performed large-eddy simulation (LES) calculations on the widely studied flow around a circular cylinder with a Reynolds number of 3900, and used the high-quality flow-field data obtained by computational fluid dynamics to study the sound sources in the flow around the cylinder. The difficulty of acoustic analogy theory lies in the inability to provide an accurate theoretical definition of the sound source, and the data resulting from numerical simulations are difficult to apply to research objects that have not yet been accurately described. Therefore, based on the fundamental theory proposed by Mao et al. (Reference Mao, Kang, Wu, Yu, Gao, Su and Lu2020, Reference Mao, Kang, Liu and Wu2022a ,Reference Mao, Liu, Kang, Wu, Zhang and Wan b ), we developed the longitudinal and transverse process decomposition (LTD) sound source identification method and employed it as an analytical approach to study the longitudinal field and transverse field (vorticity dynamics) behaviour in the flow around a cylinder. This paper uses this method as a basis to investigate the physical mechanisms behind sound sources and turbulent structures, and to explain the physical properties of these sources, along with their effects on the generation and modulation of other flow behaviours.
This paper aims to explore the intricate connection between the noise source and flow structure in the flow around a cylinder. We aim to develop the LTD sound source identification method to analyse the sound source and flow around the cylinder, providing a new perspective for sound source identification and enhancing our understanding of the physical mechanisms behind sound generation. Simultaneously, through numerical simulation research, this paper aims to further enrich and advance the acoustic theory based on the LTD system, thereby contributing to the theoretical foundation for developing effective noise control strategies.
The paper is organised as follows. Section 2 introduces the acoustic theory based on LTD in detail. The analysis and discussion of the computational results are presented in § 3. Section 3.1 first introduces the calculation settings and verifies the validity of the flow field. The calculated flow-field data are used for subsequent analysis in the paper. Section 3.2 analyses the basic flow field of the cylinder, § 3.3 presents the distribution characteristics of the Lamb vector divergence, § 3.4 analyses the source terms of the low-order theory and § 3.5 analyses the source terms of the high-order theory, and focuses on the interaction mechanism between the longitudinal process sound source and the transverse process. In addition to the near field, we further investigate the wall sound source and explore the coupling of the longitudinal and transverse fields on the wall by analysing the wall vorticity dynamic behaviour. These aspects are introduced in § 3.6. Section 4 summarises the research work presented in this paper.
2. Theoretical basis
Based on the LTD method, this paper analyses the sound source term and flow mechanism in the flow around a cylinder. Additionally, the Lamb vector divergence, which is widely used for sound source identification, is analysed. Since the analysis in this paper is closely related to these theories, this section introduces the basic theory of SLP (Mao et al. Reference Mao, Kang, Wu, Yu, Gao, Su and Lu2020, Reference Mao, Kang, Liu and Wu2022a ,Reference Mao, Liu, Kang, Wu, Zhang and Wan b ) and part of the vorticity dynamics theory in detail, and provides the notation rules for the physical quantities used in the paper.
2.1. Vortex sound theory
The Lighthill theory artificially separates the flow field and the sound field, making it impossible to understand the interaction between them. It can be said that the Lighthill theory is a black-box theory. Later, scholars investigated the physical mechanism of sound generation by flow from various perspectives. Their work demonstrated that noise generation is closely related to vortex dynamics processes, including vortices, potential flow and near-wall flow in the fluid (Möhring et al. Reference Möhring, Müller and Obermeier1983; Goldstein Reference Goldstein2002; Howe Reference Howe2003). Among them, Powell (Reference Powell1964) derived the vortex sound theory and linked sound waves with vortex motion. This theory theoretically provided a clearer physical framework and explained certain physical phenomena, gaining widespread acceptance. The vortex sound equation derived by Powell (Reference Powell1964) is
 \begin{equation} {\nabla ^2}p - \frac {1}{{c_0^2}}\frac {{{\partial ^2}p}}{{\partial {t^2}}} = - \nabla {\,\boldsymbol\cdot\,} [\rho ({\boldsymbol{\omega }} \times {\boldsymbol{u}})], \end{equation}
where
 ${\boldsymbol{\omega }} = \nabla \times {\boldsymbol{u}}$
represents vorticity. The source term on the right-hand side of (2.1) includes the cross product of vorticity and velocity, known as the Lamb vector. Powell’s vortex sound theory indicates that, at low Mach numbers, the sound source term originates from the divergence of the Lamb vector, which is a dipole source. It proposes that unsteady vortex motion serves as the aerodynamic sound source. Powell’s vortex sound theory connects the sound source with the flow structure. The reason the vortex sound theory has attracted attention is that vortex motion is relatively intuitive.
2.2. The acoustic theory based on LTD
2.2.1. Basic concepts and basic equations
(1) Decomposition based on SLP and VTP. Mao et al. (Reference Mao, Kang, Wu, Yu, Gao, Su and Lu2020) proposed a sound source diagnosis theory based on the perspective of flow decomposition. For a vector field
 $\boldsymbol{V}$
, there exists a unique differential decomposition:
 \begin{equation} {\nabla ^2}{\boldsymbol{V}} = \nabla (\nabla {\,\boldsymbol\cdot\,} {\boldsymbol{V}}) - \nabla \times (\nabla \times {\boldsymbol{V}}), \end{equation}
where
 $\nabla {\,\boldsymbol\cdot\,} {\boldsymbol{V}}$
and
 $\nabla \times {\boldsymbol{V}}$
represent the divergence and curl of
 $\boldsymbol{V}$
, respectively,
 $\nabla (\nabla {\,\boldsymbol\cdot\,} {\boldsymbol{V}})$
represents the divergence and irrotational part of
 $\boldsymbol{V}$
and
 $\nabla \times (\nabla \times {\boldsymbol{V}})$
represents the rotational and irdivergence part of
 $\boldsymbol{V}$
. This process is also called Helmholtz decomposition. Any continuous and smooth vector field can be decomposed into the sum of an irrotational field and an irdivergence field. The vector field with divergence but no rotation is referred to as the longitudinal field, while the vector field with rotation but no divergence is called the transverse field.
In the fluid, the vector field is regarded as the velocity field
 $\boldsymbol{u}$
. According to (2.2), we have
 \begin{equation} {\nabla ^2}{\boldsymbol{u}} = \nabla (\nabla {\,\boldsymbol\cdot\,} {\boldsymbol{u}}) - \nabla \times (\nabla \times {\boldsymbol{u}}), \end{equation}
where
 $\nabla {\,\boldsymbol\cdot\,} {\boldsymbol{u}}$
is the divergence of velocity, called dilatation, and
 $\nabla \times {\boldsymbol{u}}$
is the vorticity, which correspond to the SLP and the VTP in the fluid, respectively. The object decomposed in this manner represents a physical and natural entity before and after the decomposition. Sound waves and vortices are two key aspects in fluid mechanics, with sound waves belonging to SLP (acoustic theory), while shear and vortices are derived from VTP (vorticity and vortex dynamics). Decomposition based on SLP and VTP is a linear mathematical operation. However, when applied to a nonlinear vector field, it cannot achieve a complete decomposition. The NS equation is a strongly nonlinear problem, and thus, in addition to the inherent nonlinearity of SLP and VTP, there will also be a coupling effect between them. This coupling is the cause of the complexity of the flow. From the perspective of decomposition based on SLP and VTP, we can observe how different processes are coupled. This offers a new perspective for exploring flow complexity and the interaction between waves and vortices.
(2) Causality. Through the method outlined above, SLP and VTP in the flow can be distinguished, allowing for the analysis of their respective physical laws and their interactions. This only marks the beginning of diagnosing complex flow and acoustic fields. The complexity of flow arises from the various causal relationships behind it. If A causes B, then A is the cause of B, and B is the result of A. Thus, there exists a causality between A and B. The essence of the evolution and interaction of complex processes in fluids lies in the existence of various causal relationships like this. Causality encompasses the effects of time and space, which are manifested in fluids as material derivative operators, that is,
 \begin{equation} D{{R}_{es}} = {R_{ca}}, \end{equation}
where
 $D = {\partial _t} + {\boldsymbol{u}} {\,\boldsymbol\cdot\,} \nabla$
is the material derivative operator,
 ${R}_{es}$
is the result and
 $R_{ca}$
is the cause. This formula indicates that
 $R_{ca}$
leads to the space–time evolution of
 ${R}_{es}$
. This is the simplest form of an equation, while the NS equation contains various complex causal relationships like this.
(3) Fundamental equation. Based on the above two ideas, the NS equations are decomposed and reorganised to obtain the material evolution equations of the characteristic variables of SLP and VTP. This allows the causal relationship to be established, and within this causality, the source term is created out of nothing in a process. Since tracing causality is required, the D-form unit mass viscous compressible NS equation is adopted, that is,
 \begin{align}&\qquad\qquad\quad D\left ( {\ln \rho } \right ) = - \vartheta , \end{align}
 \begin{align}& D{\boldsymbol{u}} = - \frac {1}{\rho }\nabla p + ({\nu _\theta }(\nabla \vartheta ) - \nu (\nabla \times {\boldsymbol{\omega }})) , \end{align}
 \begin{align}&\qquad\qquad Ds = - \frac {{\nabla {\,\boldsymbol\cdot\,} {\boldsymbol{q}}}}{{\rho T}} + \frac {\boldsymbol{\Phi }}{{\rho T}} , \end{align}
 \begin{align}&\qquad\qquad\qquad p = \rho RT , \end{align}
where
 $\vartheta = \nabla {\,\boldsymbol\cdot\,} {\boldsymbol{u}}$
is the dilatation,
 $\nu =\mu /\rho$
,
 ${\nu }_{\theta } ={\mu }_{\theta } /\rho$
and
 $\mu$
are the viscosity coefficients and
 $\boldsymbol{\eta } = ({\nu _\theta }(\nabla \vartheta ) - \nu (\nabla \times {\boldsymbol{\omega }}))$
is the viscous force per unit mass. The viscosity term of the NS equation encompasses the effects of both the longitudinal and transverse fields; thus, they are separated. Coefficients
 $\nu$
and
 ${\nu }_{\theta }$
are referred to as the transverse and longitudinal viscosity coefficients, respectively,
 $s$
is entropy,
 $\boldsymbol{\Phi }$
is the viscous dissipation effect and
 $\boldsymbol{q}$
is the heat flux density vector, representing the heat flowing out along the normal direction of the unit area per unit time.
The relative fluctuation of thermodynamic variables is introduced, and a logarithmic dimensionless variable is employed:
 \begin{align} {\mathcal R} \equiv \ln \left ( {\frac {\rho }{\rho _0}} \right ),\quad {\mathcal P} \equiv \frac {1}{\gamma }\ln \left ( {\frac {p}{p_0}} \right ),\quad {s^ * } \equiv \frac {s - {s_0}}{c_p}, \end{align}
where
 $\gamma ={c}_{p}/{c}_{v}$
is the ratio of specific heats and
 ${c}_{p}$
and
 ${c}_{v}$
are specific heat capacities at constant volume and pressure, respectively.
The acoustic wave equations discussed in this paper are derived from the SLP equations. The equations in this section are applied to the derivation of the longitudinal field equations, allowing us to obtain the univariate SLP evolution equations.
2.2.2. Low-order theory: the acoustic equations
This section introduces the low-order equations of SLP. The SLP encompasses both flow and longitudinal waves, with the variables not being unique. As a result, the single-variable equation will take on multiple different forms.
Taking the divergence of the momentum (2.6) gives
 \begin{equation} D\vartheta + {\textrm {tr}}({{\boldsymbol{A}}^2}) = - {\nabla ^2}h + \nabla {\,\boldsymbol\cdot\,} (T\nabla s) + {\nu _\theta }{\nabla ^2}\vartheta ,\end{equation}
where
 ${\boldsymbol{A}} = \nabla {\boldsymbol{u}}$
is the velocity gradient tensor (VGT) and
 $h$
is enthalpy. There are two longitudinal field variables,
 $\vartheta$
and
 $h$
, in (2.10), which do not represent the evolution of a single longitudinal field variable. To obtain the acoustic mode equation in SLP, the kinematic quantity is eliminated, resulting in an acoustic equation where thermodynamic quantities serve as the characteristic variables. This thermodynamic quantity can be chosen as
 $\mathcal R$
or
 $\mathcal P$
. When
 $\mathcal R$
is selected as the characteristic variable, (2.10) becomes
 \begin{equation} {D^2}{\mathcal R} - \nabla {\,\boldsymbol\cdot\,} ({c^2}\nabla {\mathcal R}) - {\nu _\theta }{\nabla ^2}D{\mathcal R}={\textrm{tr}}({{\boldsymbol{A}}^2}) + \nabla {\,\boldsymbol\cdot\,} ({c^2}\nabla {s^ * }), \end{equation}
where
 $c$
is the speed of sound. If
 $\mathcal P$
is selected as the characteristic variable, the thermodynamic relationship can be used to convert
 $\mathcal R$
into
 $\mathcal P$
, and we get
 \begin{equation} {D^{\textrm {2}}}{\mathcal P} - \nabla {\,\boldsymbol\cdot\,} ({c^2}\nabla {\mathcal P}) - {\nu _\theta }{\nabla ^2}D{\mathcal P} = {\textrm{tr}}({{\boldsymbol{A}}^2}) + {D^2}{s^*} .\end{equation}
In this way, the single-variable evolution equations of the density fluctuations and pressure fluctuations are obtained. At this time, (2.12) is actually the Phillips equation. The right-hand sides of (2.11) and (2.12),
 ${\textrm{tr}}({{\boldsymbol{A}}^2})$
,
 $\nabla {\,\boldsymbol\cdot\,} ({c^2}\nabla {s^ * })$
and
 ${D^2}{s^*}$
, are the nominal source terms that cause the evolution of the characteristic variables. However, Mao et al. (Reference Mao, Kang, Wu, Yu, Gao, Su and Lu2020) noticed that the term
 ${\textrm{tr}}({{\boldsymbol{A}}^2})$
also includes the effect of the acoustic mode, so it is not a physical source yet and needs to be simplified further.
Note that
 $\beta = {\vartheta ^2} - {\textrm{tr}}({{\boldsymbol{A}}^2})$
, and substitute it into (2.11) and (2.12). It is worth noting that for the low-Mach-number flow studied in this paper, the entropy effect is very limited, so this paper ignores the entropy source. Finally, the equations of primary concern are
 \begin{align}&\,\,\, {D^2}{\mathcal R} - \nabla {\,\boldsymbol\cdot\,} ({c^2}\nabla {\mathcal R}) - {\nu _\theta }{\nabla ^2}D{\mathcal R} - {(D{\mathcal R})^2} = - \beta , \end{align}
 \begin{align}& {D^2}{\mathcal P} - \nabla {\,\boldsymbol\cdot\,} ({c^2}\nabla {\mathcal P}) - {\nu _\theta }{\nabla ^2}(D{\mathcal P}) - {(D{\mathcal P})^2} = - \beta . \end{align}
Equation (2.13) is called the
 $\mathcal R$
equation and (2.14) is called the
 $\mathcal P$
equation, also known as the improved Phillips equation. They are low-order theories of the SLP equation. Equations (2.13) and (2.14) show that the sound source mainly comes from the vortex source
 $\beta$
, which is composed of the velocity gradient.
One calculates the material derivative of the momentum equation and eliminates the thermodynamic quantity
 $h$
using the gradient of the continuity equation. The velocity vector equation can then be obtained:
 \begin{align} & {D^2}{\boldsymbol{u}} + \nabla {\boldsymbol{u}} {\,\boldsymbol\cdot\,} D{\boldsymbol{u}} - \nabla ({c^2}\nabla {\,\boldsymbol\cdot\,} {\boldsymbol{u}}) = (D{\boldsymbol{I}} + {\boldsymbol{A}}) {\,\boldsymbol\cdot\,} (\eta + T\nabla s) - \gamma \nabla (TDs) = {v_\theta }\nabla (D\vartheta ) \nonumber \\ &\quad - v\nabla \times (D{\boldsymbol{\omega }}) + DT\nabla s - \nabla TDs - (\gamma - 1)\nabla (TDs) - {\boldsymbol{A}} {\,\boldsymbol\cdot\,} T\nabla s .\end{align}
This is the equation governing the flow, with source terms arising from the viscous effect and entropy effect.
2.2.3. High-order theory: the dilatation equation
The source term
 $-\beta$
is the kinematic product of the exchange order of the nonlinear operator D and the Hamiltonian operator
 $\nabla$
, and does not involve the causal dynamics of
 $\boldsymbol{F} = m\boldsymbol{a}$
. This physical source is referred to as a kinematic source. If the source term arises from the kinetic–thermodynamic coupling of each process, it can be termed a kinetic source.
The source term
 $-\beta$
in the low-order SLP (2.13) and (2.14) is a kinematic source resulting from operator nonlinearity. Additionally, the evolution process of the low-order equation is almost entirely confined within SLP, with the coupling to VTP being too weak. We aim to identify which kinetic effects and couplings within the flow generate noise, effects that cannot be captured by low-order theories. Furthermore, this limitation is inherent in all low-order thermodynamic variable acoustic equations. The way to overcome this limitation is by increasing the order of the equation, thus entering the high-order theory of SLP.
Thermodynamic variables
 $\mathcal P$
,
 $\mathcal R$
and velocity
 $\boldsymbol{u}$
will intersect in the dilatation
 $\vartheta$
after raising the order, so the high-order theory becomes the dilatation equation with dilatation as the characteristic variable. The dilatation equation can characterise sound because the dilatation wave also contains sound waves, and dilatation itself is the cause of the characteristic variables in the sound equation. The dilatation equation can characterise both longitudinal waves and flow.
Taking the divergence of the velocity vector (2.15), we obtain the higher-order dilatation equation. Since the source term is too complicated, the viscosity effect, non-isentropic effect and non-isoentropic effect are omitted in this paper. We finally get the dilatation equation on which this paper focuses:
 \begin{equation} {D^2}\vartheta + {\boldsymbol{a}} {\,\boldsymbol\cdot\,} \nabla \vartheta - {\nabla ^2}({c^2}\vartheta ) +2(D{\vartheta ^2} + 3{\vartheta ^3}) - 6\beta \vartheta = 2D\beta + 2{tr}({{\boldsymbol{B}}^3}) + {\boldsymbol{a}} {\,\boldsymbol\cdot\,} (\nabla \times {\boldsymbol{\omega }}) ,\end{equation}
where
 ${\boldsymbol{a}} = D{\boldsymbol{u}}$
is the acceleration. Tensor
 $\boldsymbol{B}$
is the surface deformation tensor, and its relationship with the VGT is
 \begin{equation} {\boldsymbol{B}} = \vartheta {\boldsymbol{I}} - {{\boldsymbol{A}}^T}, \end{equation}
where
 $\boldsymbol{I}$
is the unit tensor. In (2.16), the main source terms of the equation are the evolution effect
 $2D\beta$
, the surface deformation effect
 $2{\textrm{tr}}({{\boldsymbol{B}}^3})$
and the VTP effect
 ${\boldsymbol{a}} {\,\boldsymbol\cdot\,} (\nabla \times {\boldsymbol{\omega }})$
. In high-order theories, the main variables of the acoustic field are transferred from thermodynamic variables to dilatation. Using dilatation to characterise sound waves allows the flow to be integrated into the analysis of the acoustic process, and the source term also generates kinetic effects.
2.2.4. Boundary acoustics theory: wall sound sources
For the flow around the cylinder studied in this paper, the wall is one of the reasons why the uniform free flow changes into a complex flow. Whether for flow or noise, the wall is undoubtedly an important object of attention. Mao et al. (Reference Mao, Liu, Kang, Wu, Zhang and Wan2022b
) focused on the coupling of SLP and VTP on the wall. For the stationary wall studied in this paper, the normal flux of
 $\mathcal P$
on the wall is
 \begin{equation} {\partial _n}{\mathcal P} = \frac {1}{{{c^2}}}[{\nu _\theta }{\partial _n}\vartheta - \nu ({\boldsymbol{n}} \times \nabla ) {\,\boldsymbol\cdot\,} {\boldsymbol{\omega }}], \end{equation}
where
 $\boldsymbol{n}$
is the unit normal vector and the subscript
 $n$
represents the normal component. This is the boundary generation mechanism of
 $\mathcal P$
. It is the
 $\mathcal P$
generated on the wall through (2.18) that then generates the sound wave propagating at the speed of sound through (2.14). We take the normal derivative of the continuity equation and apply it on the wall to obtain the expression for the normal gradient of the dilatation,
 ${\partial _n}\vartheta$
, on the wall. Term
 ${\partial _n}\vartheta$
is called the boundary dilatation flux (BDF). Mao et al. approximated it using the singular perturbation method and omitted the small-order terms by applying the boundary-layer approximation, obtaining the expression for the BDF:
 \begin{equation} {\partial _n}\vartheta = [({\partial _t} + \vartheta ){\partial _n} + ({\boldsymbol{\omega }} \times {\boldsymbol{n}}) {\,\boldsymbol\cdot\,} {\nabla _\pi }]{s^ * } - \frac {{\gamma \nu }}{{{c^2}}}{\partial _n}{\varOmega }, \end{equation}
where the subscript
 $\pi$
represents the tangential component and
 $\varOmega ={\boldsymbol{\omega }}^{2}/2$
is the enstrophy. Equation (2.19) shows that the BDF has two sources: one is from the temperature field and the other is from the vorticity field. This effect is reflected as the boundary enstrophy flux (BEF). Recently, Chen et al. (Reference Chen, Wu, Liu and Salazar2024) derived a new formulation of the BDF by introducing the explicit expression of the BEF, which reveals that the BDF is primarily governed by the coupling between the transverse field and the surface pressure gradient. This offers a new physical perspective on the underlying mechanism of the BDF. This shows that the SLP source on the solid boundary has a VTP effect, and mutual modulation occurs between the sound wave and the vorticity field.
2.3. Vorticity dynamics theory
In the study of aeroacoustics, the physical mechanism of wave–vortex interaction is an important focus. The interaction between the sound waves of SLP and the vorticity of VTP is reflected in the SLP theory in § 2.2. The sound source term of the SLP has the characteristics of VTP such as
 $\boldsymbol{a} {\,\boldsymbol\cdot\,} (\nabla \times {\boldsymbol{\omega }})$
and
 $\nu {\partial }_{n}\varOmega$
, which shows that there is an interactive coupling relationship between SLP and VTP. Therefore, while studying SLP, it is also necessary to analyse VTP. This section supplements the necessary vorticity dynamics theory (Wu et al. Reference Wu, Ma and Zhou2007, Reference Wu, Ma and Zhou2015) with the SLP and VTP coupling effect reflected in the SLP theory, which helps to provide a more comprehensive understanding of the relationship between flow and sound waves.
2.3.1. Evolution of vorticity and enstrophy
The curl of velocity is vorticity, which can characterise the rotation of fluid elements. Enstrophy is a physical quantity that indicates whether the flow in a certain area has rotation and the intensity of rotation. Its value is half of the square of the vorticity value, recorded as
 $\varOmega ={\boldsymbol{\omega }}^{2}/2$
. Its status is equivalent to kinetic energy, which is the expression of vorticity from the perspective of energy. The existence and value of enstrophy in a region respectively characterise the rotation and the intensity of rotation of the flow in the region. The definition of acceleration is
 \begin{equation} {\boldsymbol{a}} = D{\boldsymbol{u}} .\end{equation}
By calculating the curl of (2.20), the vorticity evolution equation can be obtained:
 \begin{equation} \frac {{D{\boldsymbol{\omega }}}}{{Dt}} = \nabla \times \boldsymbol{a} + {\boldsymbol{\omega }} {\,\boldsymbol\cdot\,} \nabla {\boldsymbol{u}} - \vartheta {\boldsymbol{\omega }}. \end{equation}
The dot product of (2.21) and
 $\omega$
gives the enstrophy evolution equation:
 \begin{equation} \frac {{D\varOmega }}{{Dt}} = {\boldsymbol{\omega }} {\,\boldsymbol\cdot\,} (\nabla \times \boldsymbol{a}{\textrm {)}} + 2\alpha \varOmega, \end{equation}
where
 \begin{equation} \alpha = {\boldsymbol{t}} {\,\boldsymbol\cdot\,} ({\boldsymbol{D}} - \vartheta {\boldsymbol{I}}) {\,\boldsymbol\cdot\,} {\boldsymbol{t}}, \end{equation}
in which
 $\boldsymbol{t}$
is the unit vector along the vortex line direction and
 $\alpha$
represents the stretching rate of a single vorticity line (infinitely thin vortex tube).
2.3.2. Boundary generation of vorticity field
The complexity of the flow is closely related to the vorticity. For the condition studied in this paper, the vorticity is generated from the wall and diffuses into the flow field. Since the wall is very important for both flow and noise, the characteristics of SLP on the wall have been discussed in § 2.2. The theory introduced in this section mainly focuses on VTP behaviour at the wall boundary.
Taking the tangential component of (2.6):
 \begin{equation} {\boldsymbol{n}} \times {\boldsymbol{a}} = - {\boldsymbol{n}} \times \frac {1}{\rho }\nabla p + {\nu _\theta }{\boldsymbol{n}} \times (\nabla \vartheta ) - \nu ({\boldsymbol{n}} \times \nabla ) \times {\boldsymbol{\omega }} + \nu {\boldsymbol{n}} {\,\boldsymbol\cdot\,} \nabla {\boldsymbol{\omega }}. \end{equation}
We apply (2.24) to the wall. Since the wall is stationary in this study,
 ${\boldsymbol{n}} \times {\boldsymbol{a}}=0$
. Definition:
 \begin{align}&\quad\,\, \nu {\boldsymbol{n}} {\,\boldsymbol\cdot\,} \nabla {\boldsymbol{\omega }} = {\boldsymbol{\sigma }}, \end{align}
 \begin{align}&\quad {\boldsymbol{n}} \times \frac {1}{\rho }\nabla p = {{\boldsymbol{\sigma }}_p}, \end{align}
 \begin{align}&\,\, {\nu _\theta }{\boldsymbol{n}} \times (\nabla \vartheta ) = {{\boldsymbol{\sigma }}_{{\textrm {vis1}}}}, \end{align}
 \begin{align}& \nu ({\boldsymbol{n}} \times \nabla ) \times {\boldsymbol{\omega }} = {{\boldsymbol{\sigma }}_{vis2}}. \end{align}
Then we have the equation
 \begin{equation} {\boldsymbol{\sigma }} = {{\boldsymbol{\sigma }}_p}{\textrm { + }}{{\boldsymbol{\sigma }}_{vis2}} - {{\boldsymbol{\sigma }}_{{\textrm {vis1}}}}, \end{equation}
where
 $\boldsymbol{\sigma }$
is called the boundary vorticity flux (BVF), which is related to the tangential pressure gradient effect
 ${\boldsymbol{\sigma }}_p$
and the viscous effect of the boundary vorticity and boundary dilatation
 ${\boldsymbol{\sigma }}_{vis1}$
and
 ${\boldsymbol{\sigma }}_{vis2}$
. The BVF characterises the behaviour of vorticity generated on the solid boundary and diffused into the fluid in the viscous compressible flow. The dot product of BVF and
 $\boldsymbol{\omega }$
can afford the BEF, which is expressed as
 \begin{equation} \eta = v{\partial _n}\frac {{{{\boldsymbol{\omega }}^2}}}{2} = {\boldsymbol{\omega }} {\,\boldsymbol\cdot\,} {\boldsymbol{\sigma }} = {\eta _p} + {\eta _{vis2}} - {\eta _{vis1}}, \end{equation}
where
 $\eta$
is the BEF, and the BEF is also related to the TGP effect, the viscous effect of the boundary vorticity and boundary dilatation. If
 $\eta \gt 0$
, it means that the new vorticity strengthens the original vorticity; on the contrary, if
 $\eta \lt 0$
, the new vorticity weakens the original vorticity. The BEF is also reflected as a ‘vortex sound’ source in the wall (2.19) of SLP, which is a manifestation of the mutual modulation of the coupling of SLP and VTP.
3. Results and discussion
3.1. Calculation cases and validity verification
In this paper, the flow around an equal straight circular cylinder is numerically simulated under the conditions of
 $Ma=0.2$
and
 $Re=3900$
. This Reynolds number is within the subcritical flow range, which is characterised by the laminar boundary layer on the cylinder wall, the flow separation on the upper and lower sides of the cylinder and the transition to turbulence in the separated shear layer. In order to obtain detailed flow-field results and avoid the high computational cost of direct numerical simulation, LES is used to obtain flow-field data in this paper. The WALE model (Nicoud & Ducros Reference Nicoud and Ducros1999) is designed to minimise the influence of the model when calculating the laminar boundary layer, which is very important for flows that contain both laminar and turbulent flows, as it ensures accurate prediction of the boundary layer. As a result, the WALE model is selected for the working conditions studied in this paper. In this paper, the spatial discretisation of the convective terms is performed using the HLLC scheme, while the viscous terms are discretised using the DDG scheme. The time discretisation is based on an implicit Runge–Kutta method.
Diagram of the computational domain.

Figure 1 shows a diagram of the computational domain, where
 $D$
is the diameter of the cylinder and the origin of the coordinates is located at the centre of the cylinder. The spanwise length of the cylinder is selected as
 $\pi D$
. The upstream and downstream boundaries are
 $12D$
and
 $24D$
away from the centre of the cylinder, and the top and bottom boundaries are both
 $12D$
away from the centre of the cylinder. The wall is subject to a no-slip condition and is applied as a periodic boundary condition in the spanwise direction. The remaining surfaces of the computational domain are set to far-field boundary conditions.
Comparison of capturing the Q-criterion structure on the XOZ plane with different grid numbers. From (a–e), the cases are ordered from CASE1 to CASE5.

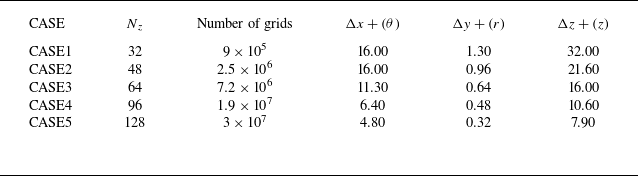
Since the sound source term mainly originates from the gradient in the flow field, the accuracy of capturing the gradient will directly determine the precision of capturing the sound source structure. Figure 2 shows a comparison of the capture of flow structures under different grid numbers, and table 1 lists the parameters for each grid set-up. The term
 $0.5({\left |\boldsymbol{\varOmega }\right |}_{F}+{\left |\boldsymbol{D}\right |}_{F})$
is employed to visualise the flow-field structure, where
 $\boldsymbol{D}$
is the symmetric tensor obtained from the Cauchy–Stokes decomposition of the velocity tensor
 $\boldsymbol{A}$
,
 $\boldsymbol{\varOmega }$
is the antisymmetric tensor resulting from the same decomposition and
 ${ |\dots |}_{F}$
denotes the Frobenius norm. This is the definition of the
 $Q$
criterion (Jeong & Hussain Reference Jeong and Hussain1995). Its expression encompasses the nonlinear effects of each term of the velocity gradient, making it suitable for representing the capture of the gradient. From the results, it is evident that there is a significant difference in the ability of different grids to capture flow structures. Given the need for precise capture of the sound source and flow structure, this paper ultimately adopts the finest grid, namely CASE5.
Specific parameters of different sets of grids, where
 $\theta$
is the coordinate in the circumferential direction,
 $r$
is the coordinate in the radial direction and
 $z$
is the coordinate in the spanwise direction.

Figure 3 shows a schematic diagram of the computational grid distribution. The grid is structured using hexahedral elements. Based on the areas of focus in this study, the grid distribution is highly concentrated near the cylindrical surface and in the near wake. In view of the mesh resolution requirements near the wall, the boundary-layer mesh was refined to resolve the viscous sublayer near the wall, ensuring that the wall
 $y+$
is less than 1. The finer mesh improves spatial resolution and can capture finer-scale turbulent structures. To meet the requirements of LES, the time step must be adjusted to accommodate the evolution and convection of these finer structures. To ensure temporal resolution, the dimensionless time step of this simulation is
 $\Delta {t}^{\ast }=0.00069$
. Flow sampling begins after the flow reaches periodic stability, and a result is extracted every one time step. The sampling time is 0.1 s, corresponding to approximately 140 vortex-shedding cycles.
Computational grid diagram. (a) Diagram of the XYplane grid near the cylindrical wall. (b) Diagram of the spanwise grid on the cylindrical wall surface.

Comparison of main flow quantities. Here
 $St={f}_{vs}D/U_0$
,
 ${C_d} = Dra/(0.5{\rho _0 }U_0 ^2S)$
,
 ${C_l} = Lif/(0.5{\rho _0 }U_0 ^2S)$
,
 ${f}_{vs}$
is the vortex shedding frequency,
 $D$
the cylinder diameter,
 $U_0$
the free-stream velocity,
 $\rho _0$
the density of the free stream,
 $Dra$
the drag forces,
 $Lif$
the lift forces and
 $S$
the characteristic area (Lourenco & Shih Reference Lourenco and Shih1994; Fröhlich et al. Reference Fröhlich, Rodi, Kessler, Parpais, Bertoglio and Laurence1998; Norberg Reference Norberg1998; Dong et al. Reference Dong, Karniadakis, Ekmekci and Rockwell2006; Parnaudeau et al. Reference Parnaudeau, Carlier, Heitz and Lamballais2008; Kahil Reference Kahil2011; Aguedal et al. Reference Aguedal, Semmar, Berrouk, Azzi and Oualli2018).

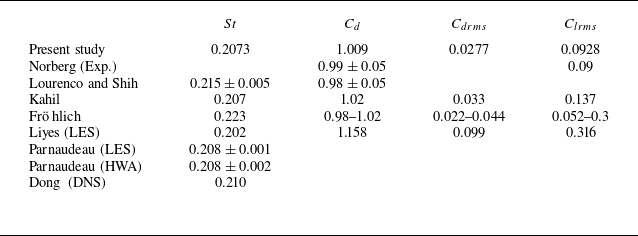
In order to verify the validity of the numerical simulation flow results, we use experiments and other simulation results as benchmarks for numerical verification. First, the force characteristics of the cylinder and the Strouhal number are quantitatively compared. Table 2 shows the comparison of the time-averaged and fluctuating root-mean-square (RMS) values of the aerodynamic forces obtained in this paper with the experimental and other numerical studies. The average drag coefficient in this paper is 1.009, which is within the range of experimental results. Previous numerical studies have shown that the RMS values of the lift coefficient and the drag coefficient are very sensitive to the turbulence model and the grid resolution. In the simulation of this paper, the RMS values of the drag coefficient and the lift coefficient are 0.0277 and 0.0928, respectively, which are slightly different from the results of other studies, but within a reasonable range. The Strouhal number of the numerical simulation in this paper is 0.2073, which is in good agreement with the experimental and numerical results.
Figure 4 shows the time-averaged pressure coefficient (
 ${C}{p}$
) distribution along the cylinder surface compared with experimental and other LES results (Norberg Reference Norberg1998; Aguedal et al. Reference Aguedal, Semmar, Berrouk, Azzi and Oualli2018), where
 ${C}{p}=(p-{p}_{0})/(0.5{\rho }_{0}{{U}_{0}}^{2})$
and
 ${p}_{0}$
is the pressure of the free flow. The results are in good agreement with the experimental data, and although there are slight discrepancies, they are within a reasonable range.
The comparison of time-averaged pressure coefficients on the cylindrical wall.

Figure 5(a) shows the time-averaged flow velocity profile at different downstream locations (
 $X/D = 1.06, 1.54, 2.02$
) compared with experimental and numerical results (Lourenco & Shih Reference Lourenco and Shih1994; Ma, Karamanos & Karniadakis Reference Ma, Karamanos and Karniadakis2000; Parnaudeau et al. Reference Parnaudeau, Carlier, Heitz and Lamballais2008). Figure 5(b) shows the time-averaged normal velocity profile at different downstream locations (
 $X/D = 1.06, 1.54, 2.02$
) compared with experimental and numerical results. The simulated flow velocity is in good agreement with the previous experimental data.
The comparison of time-averaged velocity at different downstream locations. (a) Time-averaged streamwise velocity. (b) Time-averaged normal velocity.

In addition, the unsteady results of the numerical simulation are verified through comparison. Figure 6 shows the variance of the streamwise velocity fluctuation and the normal velocity fluctuation at different positions in the wake, compared with experimental and numerical results. In general, the numerical simulation results in this paper are highly consistent with the results of experiments and other numerical studies. When
 $X/D=1.06$
, figure 6(a) captures two obvious peaks, which are primarily caused by the shear layer. As the distance from the cylinder increases, there is a slight difference in capturing the peaks, which is attributed to the sparse grid in the downstream direction.
The comparison of velocity fluctuations at different downstream locations. (a) Variance of the streamwise velocity fluctuations. (b) Variance of the normal velocity fluctuations.

3.2. Basic flow field
In order to study the sound source mechanism of the flow around the cylinder, this section first analyses the basic flow structure within the flow field.
(a) The time-averaged Mach number. (b) The time-averaged vorticity distribution.

Figures 7(a) and 7(b) show the time-averaged Mach number and time-averaged vorticity distribution, respectively. It can be seen that after the incoming flow contacts the cylinder, the fluid is separated on the upper and lower sides and accelerated. An obvious shear-layer structure forms on the upper and lower sides of the cylinder (marked by the blue dashed box), but as it evolves downstream, this distinct structure is gradually destroyed (marked by the red dashed box). Figures 8(a) and 8(b) show the distribution of the time-averaged
 $X$
velocity component and
 $Y$
velocity component at different positions in the wake region, respectively. It can be seen that there is an obvious low-speed recirculation area behind the cylinder, which forms a large velocity gradient with the incoming flow velocity. The area with large velocity changes can be clearly captured in figure 8(a), which is also the area where the shear layer is formed. As it develops downstream, the velocity difference between the recirculation area and the outside gradually decreases, the velocity gradient that maintains the shear-layer structure diminishes and the shear layer begins to break apart.
The distribution of the (a) time-averaged X velocity component (b) time-averaged Y velocity component at different downstream locations. The time-averaged streamline diagram is shown in the inset, in which the grey area represents the cylinder.

Spatial evolution of velocity fluctuation (
 $\langle {u}^{\prime } {u}^{\prime } \rangle$
,
 $\langle {v}^{\prime } {v}^{\prime }\rangle$
,
 $\langle {w}^{\prime } {w}^{\prime }\rangle$
) along the flow direction in the shear layer.

Figure 9 shows the spatial evolution of velocity fluctuations along the flow direction on the shear layer, with the spatial span encompassing the entire shear layer. It can be seen that as the shear-layer structure develops downstream, the fluctuation gradually increases, the stable structure becomes increasingly unstable and eventually breaks into a chaotic vortex zone, where the fluctuation of physical quantities becomes significant. Figure 10 shows the near-field vortex structure generated by the flow around a cylinder. The vortex structure is captured using the
 $Q$
criterion, with the
 $Q$
value made dimensionless by
 ${({c}_{0}/D)}^{2}$
, at values of 0.08 (figure 10
a) and 0.5 (figure 10
b). It can be observed in the figure that the vortex forms near the cylinder and then dissipates, gradually diffusing as it moves. The source of this process originates from the shear layer formed by the interaction between the incoming flow and the wall, which then breaks into many small and chaotic vortex structures with the backflow. Another part forms a wake-shedding vortex that evolves into the far field. The vortex shedding at a Reynolds number of 3900 differs from the paired, alternating, antisymmetric vortices with opposite rotation directions typically generated at low Reynolds numbers. Instead, multiple vortices of different sizes are shed, with each vortex generation and shedding process being distinct. This process is random and also exhibits a significant three-dimensional effect.
Vortex structure generated by the flow around a cylinder. Vortex structure captured by the Q criterion: Q = 0.08 (a) and Q = 0.5 (b), coloured by Mach number.

The results show that several important flow structures or regions exist in the wake of the cylinder. For ease of description, the flow field can be divided into several regions as shown in figure 11. Region I is the shear layer formed on the upper and lower sides of the cylinder, referred to as the shear layer; region II is the recirculation area near the cylinder, where the vortex is more turbulent, known as the recirculation flow; region III is the wake vortex area where the shed vortex enters the wake and extends to the far field, called the wake vortex. The wall facing the incoming flow in front of the cylinder is called the leading edge, while the wall on the opposite side, which contacts the recirculation zone, is called the leeward side.
Diagram of the division of different areas.

The complex flow in the cylinder wake originates from the flow separation on the upper and lower sides of the cylinder. The wall behaviour of the flow separation phenomenon is analysed, and figure 12 shows the limiting streamline of the cylinder. It can be observed that the fluid boundary layer, initially adhering closely to the wall, begins to separate from the wall at a certain point and no longer stays attached. This point is referred to as the separation point. A turbulent recirculation area appears after the separation point. Figure 13 shows the surface friction coefficient (
 ${c}_{f}$
) along the surface of the cylinder. The
 ${c}_{f}$
is related to the shear stress between the fluid and the solid surface, and it characterises the interaction between the fluid and the solid wall due to viscosity. The
 ${c}_{f}$
is close to 0, indicating that the boundary layer at this position is no longer attached to the wall, and the interaction between the fluid and the wall is weak. To a certain extent, it can characterise the location where the flow separation occurs. The separation point calculated in this paper is about
 ${87}^{\circ }$
, which is close to the experimental results of Parnaudeau et al. (Reference Parnaudeau, Carlier, Heitz and Lamballais2008) (
 ${88}^{\circ }$
) and the LES results of Breuer (Reference Breuer1998) (
 ${87}^{\circ }$
). Separation is an important flow phenomenon on the cylindrical wall, and the separation point is one of the sources of flow complexity. The subsequent analysis of VTP and SLP on the wall is inseparable from separation, as separation on the wall is closely related to noise.
The distribution of limiting streamlines on the cylindrical surface. The inset shows the
 $XY$
plane streamlines near the separation point in the near-wall region. The streamlines are coloured by velocity.

Surface friction coefficient
 ${C}_{f}$
along the surface of the cylinder. The point where
 ${C}_{f}$
is close to 0 is marked as separation point.

Distribution of the RMS of pressure fluctuations in the wake of a circular cylinder.

(a) Distribution of pressure fluctuations along the Ydirection at different downstream positions in the wake of a circular cylinder. The vertical axis represents the RMS value of pressure fluctuations. (b) Distribution of pressure fluctuations along the Xdirection on the centreline downstream of the circular cylinder. The vertical axis represents the RMS value of pressure fluctuations.

Figure 14 illustrates the concentrated regions of pressure fluctuations in the wake, while figure 15 quantifies the distribution of the RMS of pressure fluctuations. It is evident that the RMS of pressure fluctuations exhibits a pronounced high-value band downstream of the cylinder trailing edge, with peak values concentrated near the recirculation zone following shear-layer breakdown. Along the streamwise direction, the pressure fluctuations reach their maximum between
 $X=2D$
and
 $X=4D$
, after which they gradually decay further downstream. This indicates that the energy of the pressure fluctuations is primarily derived from the complex vortex generation process within the recirculation zone. Furthermore, the pressure fluctuations display a symmetric distribution along the Y axis, with two distinct local peaks in the concentrated regions. This symmetry arises from the periodic pressure fluctuations induced by alternating vortex shedding from the upper and lower shear layers near the wall. The regions of concentrated pressure fluctuations reflect the intensity of local pressure disturbances in the flow field; however, their essence lies in being the final outcome of acoustic variables resulting from the evolution of flow structures such as vortex shedding. In the flow around a circular cylinder, wall pressure fluctuations serve as an important indicator of the interaction between the flow and the cylinder surface. Their distribution characteristics reflect the dynamic effects of key flow structures, such as the separated shear layer, vortex shedding and wake region. Figure 16 shows the distribution of the RMS of pressure fluctuations on the unwrapped cylinder wall. It can be observed that in the leading-edge region, where complex flow structures are absent, the pressure fluctuations are comparatively small. From the leading edge to the upper and lower sides of the cylinder, the pressure fluctuations exhibit a well-organised increasing trend. In contrast, in the trailing-edge region, the pressure fluctuations decrease from their peak values and display a more disordered distribution statistically.
Figure 17 presents the circumferential distribution of the RMS of pressure fluctuations on the cylinder wall. The results reveal that the RMS of pressure fluctuations reaches its peak near the separation point, which is induced by the instability of the separated shear layer. Compared with the region near the leading edge, where flow separation does not occur, the pressure fluctuations on the leeward side of the cylinder also show significant magnitudes, indicating strong flow–wall interactions in these areas.
Distribution of the RMS of pressure fluctuations on the cylinder wall. The two-dimensional plane represents the angle–Z plane, obtained by unwrapping the cylinder wall with the Zaxis as the fixed axis.

Circumferential distribution of the RMS of pressure fluctuations on the cylinder wall. Here SP denotes the separation point, and the black dashed line marks the corresponding horizontal coordinate position of the separation point.

3.3. Vortex sound theory: Lamb vector divergence source
Before analysing the sound source based on LTD, this section first discusses the Lamb vector divergence, which is widely used for sound source identification, as a comparison. Compared with the Lighthill source, the Lamb vector divergence, which is more physical and intuitive in relation to vortex motion, is the focus of this section. This section primarily studies the distribution of Lamb vector divergence sound sources in the flow around a cylinder and further explores the physical meaning of Lamb vector divergence under decomposition.
Distribution of Lamb vector divergence at the wake of a cylinder. The three XY planes shown are at
 $Z = 0.5D$
,
 $Z = {\pi }D/2$
and
 $Z = (\pi - 0.5)D$
, respectively. The cylinder is transparent.

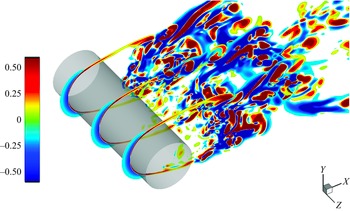
Figure 18 shows the distribution of Lamb vector divergence in the wake of the cylinder. The figure illustrates that the Lamb vector divergence is associated with the shear layer, vortex shedding and swirling flow near the wall induced by backflow–wall interaction. Under the action of the shear flow formed by flow separation, the Lamb vector divergence near the upper and lower shear layers of the cylinder exhibits a strong and stable positive–negative structure. This structure begins to break down as it moves away from the cylinder, and the larger-scale Lamb vector divergence structure gradually becomes discrete into smaller-scale structures. In the recirculation flow, due to secondary backflow–wall interaction, the Lamb vector divergence presents a small and turbulent strip-like structure. The Lamb vector divergence is mathematically a purely kinematic quantity composed of velocity gradients, so the spatial distribution pattern of the Lamb vector divergence is related to the spatial gradient distribution of the physical quantity. Figure 19 shows the distribution of the time-averaged Lamb vector divergence along the
 $Y$
direction at different downstream locations, made dimensionless using
 ${({c}_{0}/D)}^{2}$
. It can be observed that the Lamb vector divergence exhibits a positive and a negative peak distribution at the shear layer, where the streamwise velocity gradient along the
 $Y$
direction reaches a local maximum. As the flow moves away from the cylinder, the peaks gradually flatten, and the shear layer begins to break down.
The distribution of the time-averaged Lamb vector divergence along the Y direction at different downstream locations. The black dashed line shows the distribution of
 $\partial u/\partial y$
. The time-averaged velocity distribution and time-averaged streamlines are shown in the inset.

Next, we discuss the mathematical properties and physical interpretation of Lamb vector divergence. Hamman, Klewicki & Kirby (Reference Hamman, Klewicki and Kirby2008) decomposed the Lamb vector divergence as shown in (2.15), indicating that the Lamb vector divergence can be decomposed into two terms, namely the flexion production
 ${\boldsymbol{u}} {\,\boldsymbol\cdot\,} (\nabla \times {\boldsymbol{\omega }})$
and enstrophy
 ${\boldsymbol{\omega }} {\,\boldsymbol\cdot\,} {\boldsymbol{\omega }}$
, where the enstrophy term is non-negative. For any vortex flow, the contribution of the enstrophy term to the Lamb vector divergence is always negative. Figures 20(a) and 20(b) show the spatial distribution of
 ${\boldsymbol{u}} {\,\boldsymbol\cdot\,} (\nabla \times {\boldsymbol{\omega }})$
and
 ${\boldsymbol{\omega }} {\,\boldsymbol\cdot\,} {\boldsymbol{\omega }}$
, respectively. It can be observed that the alternating positive and negative characteristics of the Lamb vector divergence are only contributed by
 ${\boldsymbol{u}}{\,\boldsymbol\cdot\,} (\nabla \times {\boldsymbol{\omega }})$
. Figures 21(a) and 21(b) show the spatial distribution of each term of (3.1), respectively, and use
 ${({c}_{0}/D)}^{2}$
to make them dimensionless. It can be observed that the contributions of
 ${\boldsymbol{u}} {\,\boldsymbol\cdot\,} (\nabla \times {\boldsymbol{\omega }})$
and
 ${\boldsymbol{\omega }} {\,\boldsymbol\cdot\,} {\boldsymbol{\omega }}$
are of the same magnitude, and neither term can be neglected. Enstrophy
 ${\boldsymbol{\omega }} {\,\boldsymbol\cdot\,} {\boldsymbol{\omega }}$
often contributes less when
 ${\boldsymbol{u}} {\,\boldsymbol\cdot\,} (\nabla \times {\boldsymbol{\omega }})$
reaches the maximum positive value. At this point, the positive value of the Lamb vector divergence is primarily dominated by
 ${\boldsymbol{u}} {\,\boldsymbol\cdot\,} (\nabla \times {\boldsymbol{\omega }})$
; however, when
 ${\boldsymbol{u}} {\,\boldsymbol\cdot\,} (\nabla \times {\boldsymbol{\omega }})$
produces a negative value, the negative contribution from
 ${\boldsymbol{\omega }} {\,\boldsymbol\cdot\,} {\boldsymbol{\omega }}$
increases, which together leads to the negative value of the Lamb vector divergence:
 \begin{equation} \nabla {\,\boldsymbol\cdot\,} ({\boldsymbol{\omega }} \times {\boldsymbol{u}}) = {\boldsymbol{u}} {\,\boldsymbol\cdot\,} \nabla \times {\boldsymbol{\omega }} - {\boldsymbol{\omega }} {\,\boldsymbol\cdot\,} {\boldsymbol{\omega }}. \end{equation}
The spatial instantaneous distribution of (a)
 ${\boldsymbol{\omega }} {\,\boldsymbol\cdot\,} {\boldsymbol{\omega }}$
and (b)
 ${\boldsymbol{u}} {\,\boldsymbol\cdot\,} (\nabla \times {\boldsymbol{\omega }})$
. The red region represents positive values and the blue region represents negative values.

(a,b) The spatial instantaneous distribution of
 $\nabla {\,\boldsymbol\cdot\,} ( {{\boldsymbol{\omega }} \times {\boldsymbol{u}}} )$
,
 ${\boldsymbol{\omega }} {\,\boldsymbol\cdot\,} {\boldsymbol{\omega }}$
and
 ${\boldsymbol{u}} {\,\boldsymbol\cdot\,} (\nabla \times {\boldsymbol{\omega }})$
.

The
 ${\boldsymbol{\omega }} {\,\boldsymbol\cdot\,} {\boldsymbol{\omega }}$
characterises the presence and intensity of rotation within a certain region and can be considered as the accumulation of regional rotational intensity. The positive area of the Lamb vector divergence represents the accumulation of these rotational intensities. Figure 22 shows the effects of
 $-{\boldsymbol{\omega }} {\,\boldsymbol\cdot\,} {\boldsymbol{\omega }}$
,
 ${\boldsymbol{u}} {\,\boldsymbol\cdot\,} (\nabla \times {\boldsymbol{\omega }})$
and
 $\nabla {\,\boldsymbol\cdot\,} ( {{\boldsymbol{\omega }} \times {\boldsymbol{u}}} )$
. Red represents the accumulation effect of rotational intensity
 ${\boldsymbol{\omega }} {\,\boldsymbol\cdot\,} {\boldsymbol{\omega }}$
, while blue represents the consumption effect of rotational intensity due to
 ${\boldsymbol{u}} {\,\boldsymbol\cdot\,} (\nabla \times {\boldsymbol{\omega }})$
. The physical characteristic of the Lamb vector divergence is the effect of the rotational strength stored in the flow after it has been consumed by flexion production.
Schematic diagram of the effects of
 $\nabla {\,\boldsymbol\cdot\,} ({\boldsymbol{\omega }} \times {\boldsymbol{u}})$
,
 ${\boldsymbol{\omega }} {\,\boldsymbol\cdot\,} {\boldsymbol{\omega }}$
and
 ${\boldsymbol{u}} {\,\boldsymbol\cdot\,} (\nabla \times {\boldsymbol{\omega }})$
.

On further decomposition of
 ${\boldsymbol{u}} {\,\boldsymbol\cdot\,} (\nabla \times {\boldsymbol{\omega }})$
, one can obtain
 \begin{equation} {\boldsymbol{u}} {\,\boldsymbol\cdot\,} (\nabla \times {\boldsymbol{\omega }}) = {\boldsymbol{u}} {\,\boldsymbol\cdot\,} (\nabla \vartheta ) - {\boldsymbol{u}} {\,\boldsymbol\cdot\,} {\nabla ^2}{\boldsymbol{u}}, \end{equation}
where
 ${\boldsymbol{u}} {\,\boldsymbol\cdot\,} (\nabla \vartheta )$
is related to the compressibility effect and
 ${\boldsymbol{u}} {\,\boldsymbol\cdot\,} {\nabla ^2}{\boldsymbol{u}}$
can be written as
 \begin{eqnarray} {\boldsymbol{u}} {\,\boldsymbol\cdot\,} {\nabla ^2}{\boldsymbol{u}} = {u_i}{u_{i,jj}} = {({u_i}{u_{i,j}})_{,j}} - {u_{i,j}}{u_{i,j}} = {\nabla ^2}\left(\frac {1}{2}{q^2}\right) - {\boldsymbol{A}}:{({\boldsymbol{A}})^T}, \end{eqnarray}
where
 $q^2$
means
 ${u_i}{u_i}$
. Then the Lamb vector divergence can also be expressed as
 \begin{equation} \nabla {\,\boldsymbol\cdot\,} ({\boldsymbol{\omega }} \times {\boldsymbol{u}}) = {\boldsymbol{u}} {\,\boldsymbol\cdot\,} (\nabla \vartheta ) - {\nabla ^2}\left(\frac {1}{2}{q^2}\right) + {\boldsymbol{A}}:{({\boldsymbol{A}})^T} - {\boldsymbol{\omega }} {\,\boldsymbol\cdot\,} {\boldsymbol{\omega }}. \end{equation}
This shows that
 ${\boldsymbol{u}} {\,\boldsymbol\cdot\,} (\nabla \times {\boldsymbol{\omega }})$
includes compressibility effects, spatial diffusion of kinetic energy and nonlinearity of velocity gradients. The positive contribution to the Lamb vector divergence can only be generated by
 ${\boldsymbol{u}} {\,\boldsymbol\cdot\,} (\nabla \times {\boldsymbol{\omega }})$
. The physical process associated with this motion appears to be the unwinding of rotation, which converts the angular momentum stored in rotational motion into linear momentum. It should be noted that the negative effect of
 ${\boldsymbol{\omega }} {\,\boldsymbol\cdot\,} {\boldsymbol{\omega }}$
is not equivalent to vortex motion, and the positive effect of
 ${\boldsymbol{u}} {\,\boldsymbol\cdot\,} (\nabla \times {\boldsymbol{\omega }})$
is not equivalent to the unwinding of the vortex. This is because strong
 ${\boldsymbol{\omega }} {\,\boldsymbol\cdot\,} {\boldsymbol{\omega }}$
can also be generated in areas such as the shear layer in turbulence. Vector
 ${\boldsymbol{\omega }} \times {\boldsymbol{u}}$
is a nonlinear vector that exhibits both rotation and divergence, and it plays an important role in both SLP and VTP. However, the limitation of Lamb vector divergence is that it does not originate from the causal source of a specific physical process, nor is it the source encountered during the motion of a fluid element. It is just a field source arising from the nonlinearity observed in a fixed space. The following section focuses on sound source identification within the LTD system and studies the physical mechanism of the sound source from a new perspective.
3.4. Low-order theory:
 $\beta$
sound source

This section first explores the low-order acoustic equations in the theory of the LTD method. From (2.13) and (2.14), it can be seen that the low-order theory and vortex sound theory are of the same order, which corresponds to a traditional acoustic equation involving thermodynamic variables. The physical quantity focused on in this section is the source term
 $\beta$
.
Distribution of
 $\beta$
at the wake of a cylinder. The three
 $XY$
planes shown are at
 $Z=0.5D$
,
 $Z ={\pi }D/2$
and
 $Z=(\pi - 0.5)D$
, respectively. The cylinder is transparent.

Instantaneous distribution of
 $\beta$
at the (a) leading edge, (b) recirculation flow, (c) shear layer and (d) wake region on the XY plane.

Spatial integral average of the absolute values of
 $\langle \beta \rangle$
at different regions.

Figure 23 shows the spatial distribution of the
 $\beta$
sound source in the flow around a cylinder. It can be seen that the noise source
 $\beta$
presents a discrete vortex-like structure compared with the Lamb vector divergence. Figure 24 shows several distribution areas of the sound source
 $\beta$
in the flow around a cylinder, showing the
 $\beta$
term concentrated at the leading edge of the cylinder, the recirculation flow, the shear layer and the wake vortex. Figure 25 shows the spatial integral average of the absolute values of
 $\langle \beta \rangle$
in these areas, made dimensionless using
 ${({c}_{0}/D)}^{2}$
, considering both the upper and lower shear layers. We can observe that the source
 $\beta$
is more concentrated at the leading edge of the cylinder and the upper–lower shear layers, while the recirculation area and the wake shedding area are relatively smaller. However, all four areas are of the same order of magnitude. This indicates that the sound source is generated in these four areas, where
 $\beta$
influences
 $\mathcal P$
and
 $\mathcal R$
through (2.13) and (2.14). The spatial layout of
 $\beta$
is similar to that of the Lamb vector divergence. What is more notable is that the
 $\beta$
source term captures the sound source located at the leading edge of the cylinder. Figure 26 shows the distribution of the RMS of
 $\beta$
along the centreline at the wake. This detection line does not reflect the contribution of the shear layer. As seen in figure 26, in addition to being concentrated in the recirculation flow region,
 $\beta$
also shows a peak at the leading edge of the cylinder, indicating the existence of a sound source at the leading edge. There are not many studies suggesting the existence of a sound source at the upstream leading edge of the cylinder. However, the research by Zhao (Reference Zhao2018) and Li et al. (Reference Li, Rival and Wu2021) has also shown that a sound source appears upstream of the cylinder. Since the leading edge exhibits a large velocity gradient distribution, the nonlinear effects between the velocity gradients lead to the peak in
 $\beta$
. From the perspective of strict (2.13) and (2.14), the gradient generated at the leading edge contributes to
 $\beta$
, which is also the cause of the evolution of the acoustic characteristic quantities
 $\mathcal P$
and
 $\mathcal R$
. In addition, the
 $\beta$
source term gradually dissipates as it moves away from the cylinder, so research on
 $\beta$
is primarily focused on the near-field region of the cylinder.
Distribution of the RMS of
 $\beta$
along the centreline in the wake. The different flow regions are indicated, with the cylinder marked by red lines.

Some positions were selected to quantitatively observe the intensity of the kinematic source
 $\beta$
. Figure 27 shows the distribution of
 $\beta$
at different downstream flow positions, with
 $\beta$
normalised by
 ${({c}_{0}/D)}^{2}$
. The results show that the
 $\beta$
source has larger values in the recirculation region and the shear layer. As the flow develops downstream, the peak value of
 $\beta$
in the shear layer decreases, with the peak gradually shrinking and converging. This process is related to the instability and fragmentation of the shear layer. As the flow continues to develop downstream, the
 $\beta$
source gradually dissipates after moving away from the cylinder.
Distribution of
 $\beta$
at different downstream flow positions: (a–f) gradually moving downstream away from the cylinder. The cylinder is marked with red lines.

The results show that there is an important structure of the
 $\beta$
source term in the shear layer. This paper detects the time evolution of
 $\beta$
at different positions in the shear layer. Figure 28 shows the spectrum of
 $\beta$
at three detection points, with
 $\beta$
normalised by
 ${({c}_{0}/D)}^{2}$
. Points P1 to P3 are located at
 $x=0.516D$
,
 $x=0.86D$
and
 $x=1.211D$
, respectively. Points P1 to P3 progressively move away from the cylindrical wall, with P3 located at the position where the shear layer becomes unstable and is damaged. As the shear layer gradually breaks down, the intensity of
 $\beta$
in the shear layer gradually increases, reaching its maximum after the damage. This is because, when the shear layer is stable, the nonlinear effect of the gradient inside it is small. However, as the shear layer becomes unstable and is damaged, the chaotic vortex structure generates a new velocity gradient, and the nonlinear effect between the velocity gradients in the region intensifies, which leads to the gradual increase in
 $\beta$
. This shows that changes and damage to the flow structure may lead to local peaks in
 $\beta$
. Mao et al. (Reference Mao, Kang, Wu, Yu, Gao, Su and Lu2020) described the physics of
 $\beta$
in detail. Source term
 $\beta$
can be expressed as
 \begin{equation} \beta = {\boldsymbol{B}}:{{\boldsymbol{A}}^{\textrm {T}}} = \nabla {\,\boldsymbol\cdot\,} ({\boldsymbol{B}} {\,\boldsymbol\cdot\,} {\boldsymbol{u}}) = \mathop {\lim }\limits _{\nu \to 0} \left ( {\frac {1}{V}\mathop \smallint \limits _{\partial \nu } \boldsymbol{n} {\,\boldsymbol\cdot\,} \boldsymbol{B} {\,\boldsymbol\cdot\,} \boldsymbol{u}\,{\textrm {d}}S} \right ). \end{equation}
Source term
 $\beta$
represents the virtual work done by the directional surface element of the material element surface when it bends or expands/contracts. It actively deforms to add energy to the fluid or passively absorbs energy from the fluid through surface deformation. Therefore, the low-order theory (2.13)–(2.14) can explain that any deformation of the surface of the material element inside the fluid can produce noise. The sound source captured by the flow structure in the wake and leading edge of the cylinder is attributed to the deformation of the fluid element surface here.
The spectrum of
 $\beta$
at three detection points in the shear layer, normalised by
 ${({c}_{0}/D)}^{2}$
.

The instantaneous distribution of
 $\beta$
within
 $1T$
on the
 $XZ$
plane. (a–d) Four instants, each instant separated by
 $T$
/4.

Figure 29 shows the time evolution of the
 $XZ$
plane during
 $T$
, where
 $T=1/{f}_{vs}$
, with
 ${f}_{vs}$
the vortex shedding period. It is worth noting that these
 $\beta$
source structures in the wake region are scattered, which seems to be related to the vortex structure in the flow field. This paper will explain the close connection between the scattered distribution of these
 $\beta$
sources and the ‘vortex’.
Attention is paid to the currently most widely used Q-criterion vortex identification method. The definition of the Q criterion is based on the relationship between the rotational and shear characteristics of the local flow field, expressed as
 \begin{equation} Q = \frac {1}{2}({\varOmega _{ij}}{\varOmega _{ij}} - {S_{ij}}{S_{ij}}), \end{equation}
where
 \begin{equation} \nabla {\boldsymbol{u}} = {\varOmega _{ij}} + {S_{ij}} .\end{equation}
This is a Cauchy–Stokes decomposition of the velocity gradient matrix
 $\nabla {\boldsymbol{u}}$
, and the Frobenius norm of two matrices is used to characterise its effect, where the Frobenius norm of the symmetric tensor
 $S_{ij}$
represents the deformation effect and the Frobenius norm of the antisymmetric tensor
 $\varOmega _{ij}$
represents the rotation effect. Using the Q criterion, a purely kinematic quantity, to represent complex vortex structures in flow is clearly problematic and controversial. However, the Q criterion remains the most convenient and commonly used method for vortex identification. A positive value of the Q criterion indicates that the rotational effect of the antisymmetric tensor overcomes the deformation effect of the symmetric tensor, denoted as rotation-dominant
 ${E}_{rot}$
. Conversely,
 ${E}_{def}$
indicates that deformation shear plays a dominant role. We studied the relationship between the
 $\beta$
source and rotational-deformation shear effects in fluids. Figure 30 shows the fitting curves of the correlation between the positive and negative values of
 $\beta$
and
 ${E}_{rot}$
and
 ${E}_{def}$
. The results indicate that the positive value of
 $\beta$
is strongly correlated with the vortex core region dominated by rotational effects, while the negative value of
 $\beta$
is strongly correlated with the region dominated by deformation shear. The following explains this rule. In fact, in the process of deriving
 $\beta$
, the definition of
 $\beta$
comes from the second fundamental invariant of
 $\nabla {\boldsymbol{u}}$
. The only difference between the definition of the Q criterion and
 $\beta$
is the compressibility effect term. There is a relationship between Q and
 $\beta$
:
 \begin{equation} \beta = 2{Q} + {\vartheta ^2}. \end{equation}
Fitting curves of the correlation between (a) positive values of
 $\beta$
and
 $E_{rot}$
and (b) negative values of
 $\beta$
and
 $E_{def}$
.

The magnitude of
 $\vartheta ^2$
is very small compared with the Q criterion and
 $\beta$
, and has almost no effect on the distribution law. This results in the Q criterion and
 $\beta$
having almost the same distribution, with only a multiplicative relationship in value. It should be noted that although the two have the same distribution, the Q criterion comes from the Cauchy–Stokes decomposition of the VGT, which is a prescribed kinematic description that does not involve control equations or flow effects. In contrast,
 $\beta$
is a source term strictly derived from the D-form NS equations, and its source and physical interpretation are more explicit. Although the Q criterion and
 $\beta$
share the same distribution, they originate from different perspectives of fluid mechanics research and thus have distinct meanings.
Figure 31 shows the distribution of
 $\beta$
in the
 $XZ$
plane, where red represents positive values and blue represents negative values. It can be observed that the distribution characteristics of
 $\beta$
in the flow field are generally centred around the rotation-dominated region (positive value), with the surrounding deformation shear-dominated region (negative value).
Distribution of
 $\beta$
in the
 $XZ$
plane. The red area represents positive values and the blue area represents negative values.

3.5. High-order theory: dilatation equation sound source and vorticity dynamics
As discussed in § 2, compared with the low-order equations addressed in § 3.3, the higher-order dilatation equation incorporates information about various physical processes, with its source terms representing kinetic sources derived from actual physical phenomena. This paper further investigates the distribution of the source terms in the higher-order dilatation equation within the flow around a cylinder in the LTD method. More importantly, we explore its coupling mechanism with other physical processes, such as the transverse field, extending the analysis of the sound source to encompass the observation of additional physical phenomena. According to (2.16), we focus on studying the distribution of the three sound source terms, namely
 $2D\beta$
,
 ${\boldsymbol{a}} {\,\boldsymbol\cdot\,} (\nabla \times {\boldsymbol{\omega }})$
and
 ${\textrm {2}}{tr}({{\boldsymbol{B}}^3})$
, in the flow around a cylinder. We refer to
 $2D\beta$
as the evolution process of
 $\beta$
(denoted as
 $\beta$
EP),
 ${\boldsymbol{a}} {\,\boldsymbol\cdot\,} (\nabla \times {\boldsymbol{\omega }})$
as the transverse process (TP) and
 ${\textrm {2}}{\textrm{tr}}({{\boldsymbol{B}}^3})$
as the surface deformation process (SDP). Figure 32 shows the spatial distribution of
 $\beta$
EP, TP and SDP.
Distribution of (a)
 ${\beta }$
EP, (b) TP and (c) SDP at the wake of a cylinder. The three XY planes shown are at
 $Z=0.5D$
,
 $Z = {\pi }D/2$
and
 $Z = (\pi - 0.5)D$
, respectively.

Figure 33 shows the distribution of the three effects along the X direction, normalised by
 ${({c}_{0}/D)}^{3}$
. The distribution is small within
 $1D$
on the leeward side of the cylinder, and then increases as it reaches the vortex turbulence region. The complex flow here leads to strong nonlinear interactions between the velocity gradients, causing the source term to become larger. In the wake vortex shedding area, the source term gradually dissipates as it moves away from the cylinder.
Distribution of the (a) time average
 ${\beta }$
EP, TP and SDP and (b) RMS
 ${\beta }$
EP, TP and SDP along the centreline at the wake, normalised by
 ${({c}_{0}/D)}^{3}$
.

Figures 34 and 35 show the distribution of the three effects along the
 $Y$
direction at different downstream positions. The shear-layer structure contributes an obvious peak characteristic to the
 $\beta$
EP sound source. After the shear layer is destroyed, a turbulent vortex region is generated. It can be seen from the RMS distribution in figure 35 that the intensity of the three sound sources does not weaken with the destruction of the shear layer, but is strengthened. This is because after the shear layer is destroyed, the gradient in certain directions of the physical quantity will be reduced, but the nonlinearity of the gradient becomes stronger due to the turbulent flow structure, and the sound source term composed of the nonlinear effect of the gradient of the physical quantity will also increase accordingly. It can be found from the above that
 $\beta$
EP, TP and SDP all provide non-negligible contributions in cylindrical flow.
Distribution of time average
 ${\beta }$
EP, TP and SDP at different downstream flow positions. (a–f) Gradually moving downstream away from the cylinder. The red dotted line represents
 ${\beta }$
EP, the blue dashed-dotted line represents TP and the green dashed line represents SDP.

Distribution of RMS
 ${\beta }$
EP, TP and SDP at different downstream flow positions. (a–f) Gradually moving downstream away from the cylinder. The red dotted line represents
 ${\beta }$
EP, the blue dashed-dotted line represents TP and the green dashed line represents SDP.

Although the source terms
 $\beta$
EP, TP and SDP lack some physical intuitiveness, they can capture the material source from the transverse process and the surface deformation process. This paper further discusses the physics of
 $\beta$
EP, TP, SDP and the relationship between the source terms and other physical processes. In the theoretical part of § 2, it can be seen that the source terms of the sound generation causal chain process represented in the dilatation equation may also be the source terms or products in the causal chain of other process evolution. Therefore, it is necessary to analyse the flow to understand the interaction mechanism between the kinetic source and the flow. Sound waves are by-products of flow, and both longitudinal waves and the flow should be discussed. First, we discuss the TP source term, which can be written as two terms:
 \begin{equation} {\boldsymbol{a}} {\,\boldsymbol\cdot\,} (\nabla \times {\boldsymbol{\omega }}) = \nabla {\,\boldsymbol\cdot\,} ({\boldsymbol{\omega }} \times {\boldsymbol{a}}) + {\boldsymbol{\omega }} {\,\boldsymbol\cdot\,} (\nabla \times {\boldsymbol{a}}). \end{equation}
The term
 ${\boldsymbol{\omega }} {\,\boldsymbol\cdot\,} (\nabla \times {\boldsymbol{a}})$
in (3.9) is worth noting first. It is in the form of the dot product of the curl of acceleration and vorticity. The curl of acceleration
 $(\nabla \times {\boldsymbol{a}})$
comes from the vorticity evolution (2.21). It represents the rotation of the inertial force, which is balanced by the curl of various forces in fluids. This term is closely related to the dynamics of the vorticity. Truesdell (Reference Truesdell2018) calls
 $(\nabla \times {\boldsymbol{a}})$
the vorticity diffusion vector. In addition, other terms appear in (2.21). The
 $\vartheta \boldsymbol{\omega }$
vector represents the modulation effect of expansion on the vorticity, which is the mechanism of coupling between SLP and VTP. Physically, it can be understood that the compression effect will cause the vorticity tube to become thinner (the vorticity will increase). For the vector term
 ${\boldsymbol{\omega }} {\,\boldsymbol\cdot\,} \nabla {\boldsymbol{u}}$
, the Cauchy–Stokes decomposition has
 \begin{equation} {\boldsymbol{\omega }} {\,\boldsymbol\cdot\,} \nabla {\boldsymbol{u}} = {\boldsymbol{\omega }} {\,\boldsymbol\cdot\,} ({\boldsymbol{\Omega }} + {\boldsymbol{D}}) = {\boldsymbol{\omega }} {\,\boldsymbol\cdot\,} {\boldsymbol{D}}. \end{equation}
Since the vorticity
 $\boldsymbol{\omega }$
is related to the dual vector of the tensor
 $\boldsymbol{\Omega }$
, this term can characterise the coupling mechanism of the symmetric and antisymmetric parts of the VGT. The combination of rotation and stretching can be related to the stretching effect of the vortex. This effect is discussed later in relation to the enstrophy evolution equation.
The dynamic effects of the TP source term come from the vorticity diffusion vector. Equation (B6) shows that the vorticity diffusion vector is related to the baroclinicity of the flow and the viscous forces within the fluid. The viscosity term represents an inherent dynamic mechanism of the shear process itself, reflecting the diffusion of vorticity induced by viscosity in the fluid motion, and is also the essential source of the vorticity diffusion vector. However, the viscosity effect term cannot generate vorticity in the original irrotational flow field. The real source of vorticity in the flow field is the diffusion of BVF, which is produced by the shear motion of the fluid relative to the solid and then diffuses into the fluid (Wu, Ma & Zhou Reference Wu, Ma and Zhou2015). This part is discussed in § 6.
If we want to express the term in the form of the dot product of the vorticity diffusion vector and vorticity in (3.9), we should consider it from the perspective of energy, specifically enstrophy. The term
 ${\boldsymbol{\omega }} {\,\boldsymbol\cdot\,} (\nabla \times {\boldsymbol{a}})$
appears in the enstrophy evolution (2.22). In addition, a noteworthy physical mechanism appears in the enstrophy evolution equation, namely the stretching rate of the infinitely thin vortex tube (vorticity line)
 $\alpha$
. Here
 $\alpha$
provides a unified description of the vorticity enhancement effect caused by the stretching and compressibility, as discussed in (2.21). Figure 36 shows the RMS distribution of
 $\alpha$
. It can be observed that
 $\alpha$
is not concentrated in the area near the cylinder or far downstream; instead, the shear layer contributes to a local peak of
 $\alpha$
. More
 $\alpha$
appears in the recirculation flow area after the shear layer is broken, where the flow structure is turbulent. The nonlinear enhancement between the gradients of physical quantities in this region leads to the aggregation of the vorticity stretching effect. In equation (2.22), the vorticity stretching effect is expressed as
 $2\alpha \varOmega$
, the modulation of
 $\alpha$
by the enstrophy is added and this term is recorded as the vorticity line stretching effect (VLSE).
Distribution of RMS
 $\alpha$
at different downstream positions. The dotted line represents the area where the cylinder is located.

Distribution of the three terms in enstrophy evolution equation at the centreline of the wake.

According to (B3), the VLSE is separated into two terms:
 ${\boldsymbol{\omega }} {\,\boldsymbol\cdot\,} {\boldsymbol{D}} {\,\boldsymbol\cdot\,} {\boldsymbol{\omega }}$
and
 ${\boldsymbol{\omega }} {\,\boldsymbol\cdot\,} \vartheta {\boldsymbol{\omega }}$
. Thus, the evolution of enstrophy in the flow field is influenced by the three terms on the right-hand side of (B3). Figure 37 shows the contributions of the three terms in (2.22) along the centreline of the wake. It can be seen that
 ${\boldsymbol{\omega }} {\,\boldsymbol\cdot\,} {\boldsymbol{D}} {\,\boldsymbol\cdot\,} {\boldsymbol{\omega }}$
has the largest magnitude, while the source term
 ${\boldsymbol{\omega }} {\,\boldsymbol\cdot\,} (\nabla \times {\boldsymbol{a}})$
and the compressible effect
 ${\boldsymbol{\omega }} {\,\boldsymbol\cdot\,} \vartheta {\boldsymbol{\omega }}$
are both smaller in magnitude. Thus, it can be concluded that VLSE is the primary factor in the evolution of enstrophy. Figure 38 shows the RMS distribution of the interaction effect of vorticity and the deformation matrix
 ${\boldsymbol{\omega }} {\,\boldsymbol\cdot\,} {\boldsymbol{D}} {\,\boldsymbol\cdot\,} {\boldsymbol{\omega }}$
at different positions, which is mainly distributed in the shear layer and recirculation flow of the cylindrical wake. Compared with
 $\alpha$
,
 ${\boldsymbol{\omega }} {\,\boldsymbol\cdot\,} {\boldsymbol{D}} {\,\boldsymbol\cdot\,} {\boldsymbol{\omega }}$
exhibits a more prominent peak in the shear layer, which reflects the strong enstrophy generated in the shear layer, while the contribution from the dilation effect is quite limited.
Distribution of the RMS
 ${\boldsymbol{\omega }} {\,\boldsymbol\cdot\,} {\boldsymbol{D}} {\,\boldsymbol\cdot\,} {\boldsymbol{\omega }}$
at different downstream positions.

Returning to the source term
 ${\boldsymbol{\omega }} {\,\boldsymbol\cdot\,} (\nabla \times {\boldsymbol{a}})$
in the dilatation equation, it can be observed that this term plays a limited role in the evolution of enstrophy. However, it can be interpreted as being related to the non-uniform diffusion dissipation of enstrophy and the stretching characteristics of the vortex. According to (3.9), in addition to the term
 ${\boldsymbol{\omega }} {\,\boldsymbol\cdot\,} (\nabla \times {\boldsymbol{a}})$
, the complete source term also includes the effect of
 $\nabla {\,\boldsymbol\cdot\,} ({\boldsymbol{\omega }} \times {\boldsymbol{a}})$
. After extracting the dominant physical process, VLSE, the remaining source term of the transverse process (or vorticity source) in the sound source is the interaction between the enstrophy evolution term
 ${\textrm {D}}{\boldsymbol{\omega }}$
and
 $\nabla {\,\boldsymbol\cdot\,} ({\boldsymbol{\omega }} \times {\boldsymbol{a}})$
. There are few studies on the physical quantity
 $\nabla {\,\boldsymbol\cdot\,} ({\boldsymbol{\omega }} \times {\boldsymbol{a}})$
, and its physical meaning remains unclear. Another source term in the dilatation equation,
 $2D\beta$
, represents the spatio-temporal evolution effect of the source term
 $\beta$
. This term is an inevitable consequence of upgrading the low-order equation. The essence of studying this term is to focus on the spatio-temporal evolution of the second fundamental invariant
 $Q$
of
 $\nabla {\boldsymbol{u}}$
. Chu & Lu (Reference Chu and Lu2013) have conducted research on this, and derived the formula
 \begin{align} \frac {{{\textrm {D}}Q}}{{{\textrm {D}}t}} &= (PQ - 3R) + (P{\textrm {tr}}(H) + S:H) + (P{\textrm {tr}}(B) + (S - W):B)\nonumber \\&\quad - (Ptr(V) + (S - W):V) = QS + QH + QB + QV, \end{align}
where
 $QS$
represents the interaction between different fundamental invariants,
 $QH$
indicates the effect of the pressure Hessian matrix,
 $QB$
arises from the baroclinic effect and
 $QV$
arises from the viscosity effect. This shows that, unlike the low-order
 $\beta$
term, which originates solely from the kinematic source caused by nonlinearity, the
 $2D\beta$
term in the dilatation equation already belongs to the dynamic material sources that incorporate fluid dynamic characteristics. The sound source obtained from the dilatation equation also includes the SDP effect, which is an inevitable nonlinear term generated by the interaction between operators during the derivation. This term has a non-negligible magnitude compared with
 $\beta$
EP and TP, and its physical origin is the surface deformation tensor.
Unlike low-order theories that can only capture the kinematic sources caused by nonlinearity, the source term in the high-order dilatation equation captures the real material source. Consequently, the sound source can no longer be generally regarded as near-field nonlinearity as it was before, but instead has a specific physical explanation related to fluid kinematics and dynamics. The acoustic process is now linked to other processes in the flow.
3.6. Wall sound source and wall vorticity dynamics
The results discussed above pertain to the near field, without considering the influence of the wall. The complex flow structure does not exist in the flow field initially; rather, it is generated at the wall and then propagates into the flow field. The wall can be considered one of the sources of flow complexity. In the case of the flow around the cylinder studied in this paper, the interaction between the incoming flow and the cylinder wall is the origin of the complex flow. Therefore, the study of the sound source must also be extended to the wall. This section primarily investigates the flow behaviour and sound source distribution on the wall.
Section 2.2 mentioned that the theory of wall sound sources also exhibits a two-level structure. The first level is the direct boundary dilatation and thermodynamic mechanism, while the second level involves the higher-order BDF mechanism. The boundary dilatation originates from the pressure fluctuation
 $\mathcal P$
on the wall, which is also the variable most commonly focused on in general acoustic research, as it is directly related to the far-field sound pressure level. From (A20), it can be observed that the source (cause) of the change in the normal flux of
 $\mathcal P$
is the wall acceleration term
 ${\boldsymbol{n}} {\,\boldsymbol\cdot\,} {{\boldsymbol{a}}_w}$
and the coupling term of viscosity–SLP–VTP. The wall acceleration of the stationary wall is not considered, so it is assumed that
 ${\partial _n}{\mathcal P}$
originates from the terms
 ${\nu _\theta }{\partial _n}\vartheta$
and
 $\nu ({\boldsymbol{n}} \times \nabla ) {\,\boldsymbol\cdot\,} {\boldsymbol{\omega }}$
. Points P1–P3 represent positions at
 $Z=\pi D/4$
,
 $Z=\pi D/2$
and
 $Z=3\pi D/4$
. Figure 39 shows the distribution of these two terms, normalised by
 $({{c}_{0}^{2}/D})$
. It can be seen that the
 ${\nu _\theta }{\partial _n}\vartheta$
term only serves as a longitudinal viscosity correction, and the normal flux of
 $\mathcal P$
is primarily dominated by
 $\nu ({\boldsymbol{n}} \times \nabla ) {\,\boldsymbol\cdot\,} {\boldsymbol{\omega }}$
.
Distribution of
 ${\nu \theta }{\partial n}\vartheta$
and
 $\nu ({\boldsymbol{n}} \times \nabla ) {\,\boldsymbol\cdot\,} {\boldsymbol{\omega }}$
at different positions along the circumference of the cylindrical surface, where P1–P3 are distributed along the spanwise direction, and the values are normalised by
 $({{c}_{0}^{2}/D})$
.

Figure 40 shows the distribution of
 ${\partial _n}{\mathcal P}$
at different positions along the circumferential surface of the cylinder. The results show that the spanwise effect of
 ${\partial _n}{\mathcal P}$
is not prominent. The peak value is observed on both sides of the cylinder, with the position located at the front end of the separation. In the leeward area,
 ${\partial _n}{\mathcal P}$
is smaller and more turbulent. This shows that
 $\mathcal P$
on the wall mainly enters the fluid before the upper and lower separation points of the cylinder, causing
 $\mathcal P$
within the flow field to be generated and begin to evolve, ultimately generating sound through (2.14). The cause of the evolution of
 $\mathcal P$
after entering the flow field is the
 $\beta$
characterised by the shear effect, while the generation of
 $\mathcal P$
on the wall is due to the coupling of the viscosity–SLP–VTP effect at the wall.
Distribution of (a) time-averaged
 ${\partial _n}{\mathcal P}$
and (b) RMS
 ${\partial _n}{\mathcal P}$
at different positions along the circumferential surface of the cylinder. Here SP represents the separation point, marked with a dashed line. The values are normalised by
 $(1/D)$
.

From (2.18), it can be seen that this causal process is a physical process within the SLP. The source term is simply the decomposition of the viscous force, and the relationship between the sound source and other flow processes is not reflected. This requires the study of (2.19), where the variable of interest is converted from
 ${\partial _n}{\mathcal P}$
to
 ${\partial _n}\vartheta$
(BDF). Figure 41 shows the BDF distribution at different positions along the circumferential surface of the cylinder. The results show that the BDF produces a peak at the upper and lower separation points of the cylinder. On the leeward side of the cylinder, there is a disordered distribution. The RMS distribution shows that the BDF on the leeward side of the cylinder also exhibits a large value.
Distribution of (a) time average
 ${\partial _n}\vartheta$
and (b) RMS
 ${\partial _n}\vartheta$
at different positions along the circumferential surface of the cylinder. Here SP represents the separation point, which is marked with a dashed line. The values are normalised by
 $({{c}_{0}}/D^{2})$
.

Both
 ${\partial _n}{\mathcal P}$
and BDF produce peaks near the separation zone and exhibit a relatively chaotic distribution on the leeward side of the cylinder, which indicates that the separation phenomenon is closely related to the sound source. This is also confirmed by the sound source near the cylindrical separation zone discovered by Oguma et al. (Reference Oguma, Yamagata and Fujisawa2013). The larger distribution characterises the extent to which the SLP variable
 $\vartheta$
generated by the wall enters the fluid. For the flow around the cylinder, the mainstream begins to move away from the wall at the flow separation point, marking the onset of complex flow structure formation. Simultaneously, the acoustic characteristic variables
 $\mathcal P$
and
 $\vartheta$
enter the fluid to the greatest extent, leading to sound wave generation. The shear layer formed by separation produces backflow and vortices after its destruction. The chaotic sound source distribution on the leeward wall is caused by the interaction between the wall and the backflow.
After studying the distribution of the sound source term, it is also essential to analyse its relationship with the wall flow field, which requires the use of the BDF equation. From (2.19), it can be observed that the BDF mainly encompasses the entropy gradient effect and the enstrophy effect. This paper does not consider the effects of temperature and entropy changes but focuses on the ‘vortex sound’ term, denoted as BEF. The definition of BEF is provided in (2.30). It represents a physical variable of the wall VTP, strictly derived from the NS equations, and plays a crucial role in wall vorticity dynamics. This facilitates the understanding of the wall sound source converted to the analysis of wall vorticity dynamics. In the study by Chen et al. (Reference Chen, Tang, Yang, Weng and Ding2021, Reference Chen, Yang, Tang, Ding and Weng2022b ) on the noise reduction mechanism of high-lift devices, BEF was also used to discuss the mechanisms affecting noise. This paper further investigates the vorticity dynamic behaviour of the wall.
Equation (2.30) shows that BEF results from the dot product of vorticity and BVF. Before analysing the distribution of BEF, this paper first examines the behaviour of BVF. The definition of BVF is provided in (2.25)–(2.28). It represents the behaviour of vorticity on the solid wall diffusing into the fluid. Figure 42 quantitatively analyses the distribution of BVF on the cylindrical surface, with values normalised by
 $({c}_{0}^{2}/D)$
. As a vector, the
 $Z$
-direction component of BVF is dominant. This distribution is mainly caused by the
 $Z$
-direction vorticity
 ${\omega }_{z}$
of the wall, which is driven by the gradient of the wall velocity in the
 $X$
and
 $Y$
directions. When the incoming flow contacts the cylinder, although the flow structure is orderly at the leading edge and no vortex is generated, a large gradient arises due to the wall boundary conditions. This increases the gradient of the physical variables related to BVF, leading to a peak value. One key point is where the physical phenomenon of flow separation occurs, and at this point the BVF reaches its maximum. It can also be considered that the extent to which the vorticity on the wall enters the flow field is greatest at this point. After separation occurs, the shear layer breaks and the backflow generates a turbulent vortex zone on the leeward side of the cylinder. The small backflow vortex interacts with the wall, causing new vorticity to flow into the flow field from the wall.
Distribution of (a) time average BVF component and (b) RMS BVF component along the circumferential surface of the cylinder.

Distribution of BEF on the cylindrical surface. The upper surface of the cylinder is unfolded on the XZ plane and the space surface to display. Values are normalised by
 $({c}_{0}^{3}/D^{2})$
.

Figure 43 shows the distribution of BEF on the cylindrical surface, with values normalised by
 $({c}_{0}^{3}/D^{2})$
. The BEF also follows a distribution dominated by the front side, indicating that the new vorticity generated on the front side enhances the vorticity in the flow field. It is worth noting that a negative value of BEF appears after the peak, indicating that the new vorticity here weakens the original vorticity. A relatively turbulent and small BEF also appears on the leeward side of the cylinder, which is caused by the interaction between the turbulent vortex structure and the wall in the recirculation zone. Figure 44 shows the distribution of BEF along the circumference of the cylindrical surface. It can be observed from the figure that the primary effect area of BEF is in the separation and pre-separation regions, with a symmetric distribution on the upper and lower sides of the cylinder. Flow separation causes the fluid to move away from the wall in this region, which increases the extent to which vorticity enters the flow field, thereby enhancing BEF. According to (2.30), this will also lead to the enhancement of the sound source BDF. It can be explained that the BEF caused by flow separation on the wall is an important reason for the complex flow of the cylinder wake and the subsequent generation of sound waves.
Distribution of (a) time average BEF and (b) RMS BEF along the circumferential surface of the cylinder.

4. Conclusion
This paper develops the LTD method by integrating vorticity dynamics. Large-eddy simulations of the flow around a cylinder at a Reynolds number of 3900 are performed, and sound sources in the flow are identified and analysed based on the LTD method. In the process of identifying the sound source, the relationship between the sound source and the flow is also explored. The analysis takes a comprehensive perspective, from the wall to the flow field, providing a new perspective for understanding near-field sound sources. The main conclusions are as follows.
We first analysed the Lamb vector divergence, which is commonly used for sound source identification, providing a reference and comparison for sound source analysis based on the LTD method. The Lamb vector divergence indicates that the sound source is primarily distributed in the shear layer separated by the cylinder, the shedding vortex at the tail and the recirculation zone. The Lamb vector divergence near the upper and lower shear layers of the cylinder exhibits a strong and stable positive–negative structure. The negative contribution arises from the enstrophy caused by shear and rotation in the fluid, while the positive contribution is solely generated by the bending product.
Compared with previous studies that primarily focus on the field source, the Lamb vector divergence, we further investigate the material sound source,
 $\beta$
, in the flow around a cylinder. The source term
 $\beta$
captures the generation of sound sources in the upper and lower shear layers, the recirculation zone and the wake-shedding zone. Additionally, the
 $\beta$
source term captures the sound source located at the leading edge of the cylinder, which arises from the large velocity gradient distribution at the leading edge. It is the
 $\beta$
in these areas that generates pressure and density fluctuations through the low-order acoustic equation. We observed a high similarity between
 $\beta$
and the Q criterion, and further explored the relationship between them through this observation. Although their distributions are similar,
 $\beta$
and the Q criterion are based on different fluid mechanics perspectives and hold distinct research significance. The distribution of
 $\beta$
in the flow field is generally characterised by a positive
 $\beta$
value (rotation-dominated) at the centre, surrounded by negative values (deformation shear-dominated), which is physically related to the surface deformation mechanism of the fluid element. By considering both vortex structures and fluid deformation, we provide a new understanding of the physical mechanisms underlying the
 $\beta$
sound source.
The high-order dilatation equation can afford the kinetic source, with source terms including
 $\beta$
EP, TP and SDP. All three sound sources provide non-negligible contributions in cylindrical flows, the contributions of
 $\beta$
EP and SDP sound sources being significant. The shear-layer structure contributes significantly to the
 $\beta$
EP sound source. After the shear layer is destroyed, the sound source term increases due to the nonlinear strengthening of the gradient in the turbulent vortex zone. The physical origin of the source term from VTP is related to the stretching effect of the vorticity and the interaction between the evolution of enstrophy and
 $\nabla {\,\boldsymbol\cdot\,} ({\boldsymbol{\omega }} \times {\boldsymbol{a}})$
. This paper discusses the relationship between sound sources and transverse processes, such as vortex stretching and enstrophy, in the flow around a cylinder. This aspect has not been thoroughly addressed in previous studies. Through this coupling analysis, we explore the connection between flow structures and sound sources, providing new insights into the noise generation mechanism.
The LTD method for analysing wall sound sources allows the flow-field sources and wall sources to be analysed as a unified system, linking the wall sources with vorticity dynamics and forming a coherent physical picture. This paper is the first to analyse the sound source distribution on the cylinder’s wall from both low-order acoustic variable and high-order dilatation perspectives. We found that in the flow around the cylinder,
 ${\partial _n}{{\mathcal P}}$
is predominantly governed by
 $\nu ({\boldsymbol{n}} \times \nabla ) {\,\boldsymbol\cdot\,} {\boldsymbol{\omega }}$
. Additionally, we observed that the normal flux of the acoustic variable
 $\mathcal P$
is maximum near the separation point on the cylinder wall. This finding indicates that the region near the separation point is where the acoustic quantity from the wall enters the flow field most strongly, making it the key location for the sound source. For the first time, we used the BDF equation to study the wall sound source, combining the analysis of wall sound sources with the transverse processes on the wall. We found that flow separation enhances the vorticity entering the wall, leading to an increase in BEF, which in turn enhances BDF. Based on the analysis of the wall sound source, we demonstrate the significant role of flow separation in the generation of wall sound sources. This study not only provides a new perspective on the analysis of wall sound sources but also further validates previous findings regarding the separation point as the primary sound source region on the wall.
The present study reveals the near-field sound source structure and the mechanisms of sound generation in the flow. However, a comprehensive understanding of the relationship between near-field turbulence, sound generation and sound propagation still requires further research and development. Forthcoming work will construct a comprehensive research framework based on the LTD method, integrating the evolution of turbulent structures, vorticity dynamics, forces in the flow and the generation and propagation of sound within a unified system. This framework will provide a holistic and novel analytical system for aeroacoustic research.
Acknowledgements
The authors are very grateful to Professor J. Z. Wu from Peking University for communication and guidance.
Funding
This work was supported by the National Key Research and Development Program of China (grant no. 2024YFB3310400), the Natural Science Foundation of China (grant no. 12372256) and the Open Project Funding for Key Laboratory of Pneumatic Noise Control (no. 2302ANCL20230101).
Declaration of interests
The authors report no conflict of interest.
Appendix A. The scalar longitudinal process theory
To clarify more details of the unified theory of longitudinal processes, more details from the theory are added in this appendix (Mao et al. Reference Mao, Shi, Xuan, Su and Wu2011, Reference Mao, Kang, Wu, Yu, Gao, Su and Lu2020, Reference Mao, Kang, Liu and Wu2022a ,Reference Mao, Liu, Kang, Wu, Zhang and Wan b ). Taking the divergence of the momentum (2.6) gives
 \begin{equation} D\vartheta + {\textrm {tr}}({{\boldsymbol{A}}^2}) = - {\nabla ^2}h + \nabla {\,\boldsymbol\cdot\,} (T\nabla s) + {\nu _\theta }{\nabla ^2}\vartheta .\end{equation}
Eliminating kinematic quantities, the acoustic equation with thermodynamic quantity as the characteristic quantity can be obtained. When
 $\mathcal R$
is selected as the characteristic variable, (A1) becomes
 \begin{equation} {D^2}{\mathcal R} - \nabla {\,\boldsymbol\cdot\,} ({c^2}\nabla {\mathcal R}) - {\nu _\theta }{\nabla ^2}D{\mathcal R}{\textrm { = tr}}({{\boldsymbol{A}}^2}) + \nabla {\,\boldsymbol\cdot\,} ({c^2}\nabla {s^ * }). \end{equation}
If
 $\mathcal P$
is selected as the characteristic variable, we get
 \begin{equation} {D^{\textrm {2}}}{\mathcal P} - \nabla {\,\boldsymbol\cdot\,} ({c^2}\nabla {\mathcal P}) - {\nu _\theta }{\nabla ^2}D{\mathcal P} = {\textrm{tr}}({{\boldsymbol{A}}^2}) + {D^2}{s^*}. \end{equation}
It can be seen that the characteristic equation of the VGT is
 \begin{equation} {\lambda ^3} + I_1(\boldsymbol{A}){\lambda ^2} + I_2(\boldsymbol{A})\lambda + I_3(\boldsymbol{A}) = 0, \end{equation}
where
 $I_1(\boldsymbol{A})$
,
 $I_2(\boldsymbol{A})$
and
 $I_3(\boldsymbol{A})$
are the basic invariants of
 $\boldsymbol{A}$
:
 \begin{align}&\qquad\qquad I_1(\boldsymbol{A}) = - {\textrm {tr}}({\boldsymbol{A}}) = - \vartheta , \end{align}
 \begin{align}& I_2(\boldsymbol{A}) = \frac {1}{2}[{P^2} - {\textrm{tr}}({{\boldsymbol{A}}^2})] = \frac {1}{2}[{\vartheta ^2} - {\textrm{tr}}({{\boldsymbol{A}}^2})], \end{align}
 \begin{align}&\qquad\qquad\quad I_3(\boldsymbol{A}) = -\det ({\boldsymbol{A}}). \end{align}
Note that
 $\beta = 2I_2(\boldsymbol{A})$
. Introducing the surface deformation tensor
 $\boldsymbol{B}$
, its relationship with the VGT is as follows:
 \begin{equation} {\boldsymbol{B}} = \vartheta {\boldsymbol{I}} - {{\boldsymbol{A}}^T}, \end{equation}
where
 $\boldsymbol{I}$
is the unit tensor.There is the following relationship:
 \begin{align}&\qquad\,\, {\textrm{tr}}({{\boldsymbol{A}}^2}) = {\vartheta ^2} - \beta , \end{align}
 \begin{align}& {\textrm{tr}}({{\boldsymbol{A}}^3}) = 3{\vartheta ^3} - 3\vartheta \beta - {\textrm {tr}}({{\boldsymbol{B}}^3}). \end{align}
We substitute (A9) into (A2) and (A3). In a low-Mach-number flow, the entropy effect is very limited. Finally, the equations of primary concern are
 \begin{align}&\,\,\, {D^2}{\mathcal R} - \nabla {\,\boldsymbol\cdot\,} ({c^2}\nabla {\mathcal R}) - {\nu _\theta }{\nabla ^2}D{\mathcal R} - {(D{\mathcal R})^2} = - \beta, \end{align}
 \begin{align}& {D^2}{\mathcal P} - \nabla {\,\boldsymbol\cdot\,} ({c^2}\nabla {\mathcal P}) - {\nu _\theta }{\nabla ^2}(D{\mathcal P}) - {(D{\mathcal P})^2} = - \beta . \end{align}
The material derivative of (2.6) is
 \begin{eqnarray} {D^2}{\boldsymbol{u}}= - \nabla Dh + {\boldsymbol{A}} {\,\boldsymbol\cdot\,} \nabla h + D(T\nabla s) + D{\boldsymbol{\eta }}. \end{eqnarray}
The gradient of (2.5) is
 \begin{eqnarray} \nabla Dh = - {c^2}\nabla \vartheta + \gamma \nabla (TDs). \end{eqnarray}
Subtracting (A14) from (A13) and simplifying it using the momentum (the purpose of this step is to eliminate the variable h in the equation) gives
 \begin{align} & {D^2}{\boldsymbol{u}} + \nabla {\boldsymbol{u}} {\,\boldsymbol\cdot\,} D{\boldsymbol{u}} - \nabla ({c^2}\nabla {\,\boldsymbol\cdot\,} {\boldsymbol{u}}) = (D{\boldsymbol{I}} + {\boldsymbol{A}}) {\,\boldsymbol\cdot\,} (\eta + T\nabla s) - \gamma \nabla (TDs) = {v_\theta }\nabla (D\vartheta )\nonumber \\ &\quad - v\nabla \times (D{\boldsymbol{\omega }}) + DT\nabla s - \nabla TDs - (\gamma - 1)\nabla (TDs) - {\boldsymbol{A}} {\,\boldsymbol\cdot\,} T\nabla s .\end{align}
This is the VV-E. Taking the divergence of the VV-E, we obtain the higher-order dilatation equation:
 \begin{align} & {D^2}\vartheta + D{\boldsymbol{u}} {\,\boldsymbol\cdot\,} \nabla \vartheta - {\nabla ^2}({c^2}\vartheta ) + \nu (\nabla \times {\boldsymbol{\omega }}) {\,\boldsymbol\cdot\,} \nabla \vartheta - {\nu _\theta }{\nabla ^2}(D\vartheta ) =- 2D{\textrm{tr}}({{\textbf{A}}^2}) \nonumber \\ &\quad - 2{\textrm{tr}}({{\boldsymbol{A}}^3}) + D{\boldsymbol{u}} {\,\boldsymbol\cdot\,} (\nabla \times {\boldsymbol{\omega }}) + \nabla {\,\boldsymbol\cdot\,} (DT\nabla s - \nabla TDs) - (\gamma - 1){\nabla ^2}(TDs)\nonumber \\ &\quad + {\boldsymbol{\omega }} {\,\boldsymbol\cdot\,} (\nabla s \times \nabla T) + 2\nu {\textbf{B}}:\nabla (\nabla \times {\boldsymbol{\omega }}) + \nu |\nabla \times {\boldsymbol{\omega }}{|^2} - \nu {\nabla ^2}{{\boldsymbol{\omega }}^2} + 2\nu \nabla {\boldsymbol{\omega }}:{(\nabla {\boldsymbol{\omega }})^T}. \end{align}
Since the source term is too complicated, the viscosity effect, non-isentropic effect and non-isoentropic effect are omitted in this paper, and (A16) is simplified to
 \begin{equation} {D^2}\vartheta + D{\boldsymbol{u}} {\,\boldsymbol\cdot\,} \nabla \vartheta - {\nabla ^2}({c^2}\vartheta ) = - 2D{\textrm{tr}}({{\boldsymbol{A}}^2}) - 2{\textrm{tr}}({{\boldsymbol{A}}^3}) + D{\boldsymbol{u}} {\,\boldsymbol\cdot\,} (\nabla \times {\boldsymbol{\omega }}). \end{equation}
Using (A9) and (A10) to modify the source term, (A17) becomes
 \begin{equation} {D^2}\vartheta + {\boldsymbol{a}} {\,\boldsymbol\cdot\,} \nabla \vartheta - {\nabla ^2}({c^2}\vartheta ) +2(D{\vartheta ^2} + 3{\vartheta ^3}) - 6\beta \vartheta = 2D\beta + 2{\textrm{tr}}({{\boldsymbol{B}}^3}) + {\boldsymbol{a}} {\,\boldsymbol\cdot\,} (\nabla \times {\boldsymbol{\omega }}). \end{equation}
In addition, the variation of SPL variables on the wall also needs to be studied, focusing on the thermodynamic flux and dilatation flux on the wall (Mao et al. Reference Mao, Liu, Kang, Wu, Zhang and Wan2022b ). Applying (2.5) to the wall:
 \begin{equation} {\vartheta _w} = - {D_w}{\mathcal R} = - {D_w}({\mathcal P} - {s^*}), \end{equation}
where the subscript
 $w$
represents the physical quantity on the wall. Equation (A19) describes the causal relationship between the dilatation on the wall and the thermodynamic variables. The boundary behaviour of the dilatation requires the study of the boundary behaviour of the pressure. From (2.9) and the momentum equation, we can obtain the normal flux of
 $\mathcal P$
on the wall:
 \begin{equation} {\partial _n}{\mathcal P} = \frac {1}{{{c^2}}}{\boldsymbol{n}} {\,\boldsymbol\cdot\,} ({{\boldsymbol{\eta }}_w} - {{\boldsymbol{a}}_w}) = \frac {1}{{{c^2}}}({\boldsymbol{n}} {\,\boldsymbol\cdot\,} {{\boldsymbol{\eta }}_w}{\boldsymbol{ - n}} {\,\boldsymbol\cdot\,} {{\boldsymbol{a}}_w}), \end{equation}
where
 $\boldsymbol{n}$
is the unit normal vector, the subscript
 $n$
represents the normal component and for the stationary wall studied in this paper,
 $\boldsymbol{n{\,\boldsymbol\cdot\,} {a}_{w}}=0$
. The final equation is
 \begin{equation} {\partial _n}{\mathcal P} = \frac {1}{{{c^2}}}[{\nu _\theta }{\partial _n}\vartheta - \nu ({\boldsymbol{n}} \times \nabla ) {\,\boldsymbol\cdot\,} {\boldsymbol{\omega }}] .\end{equation}
This is the boundary generation mechanism of
 $\mathcal P$
. We take the normal derivative of the continuity equation and apply it on the wall. The interaction operator between the normal derivative and the material derivative at the wall is
 \begin{equation} {({\partial _n}D)_w} = ({\partial _t} + \vartheta ){\partial _n} + ({\boldsymbol{\omega }} \times {\boldsymbol{n}}) {\,\boldsymbol\cdot\,} {\nabla _\pi }. \end{equation}
Applying the above operator to (2.5) yields the expression of the normal gradient of the dilatation
 ${\partial _n}\vartheta$
on the wall. Using the singular perturbation method and boundary-layer approximation method for processing (Mao et al. Reference Mao, Liu, Kang, Wu, Zhang and Wan2022b
), the final expression of BDF is obtained:
 \begin{equation} {\partial _n}\vartheta = [({\partial _t} + \vartheta ){\partial _n} + ({\boldsymbol{\omega }} \times {\boldsymbol{n}}) {\,\boldsymbol\cdot\,} {\nabla _\pi }]{s^ * } - \frac {{\gamma \nu }}{{{c^2}}}{\partial _n}{\varOmega }. \end{equation}
Appendix B. Vorticity dynamics theory
We further focus on the evolution of VTP variables (Wu et al. Reference Wu, Ma and Zhou2007, Reference Wu, Ma and Zhou2015). The definition of acceleration is
 \begin{equation} {\boldsymbol{a}} = D{\boldsymbol{u}}. \end{equation}
By taking the curl of (B1), we can obtain
 \begin{equation} \frac {{{\textrm D}{\boldsymbol{\omega }}}}{{{\textrm D}t}} = \nabla \times \boldsymbol{a} + {\boldsymbol{\omega }} {\,\boldsymbol\cdot\,} \nabla {\boldsymbol{u}} - \vartheta {\boldsymbol{\omega }}. \end{equation}
The dot product of (B2) and
 $\omega$
is
 \begin{equation} \frac {{{\textrm D}{\boldsymbol{\omega }}}}{{{\textrm D}t}} {\,\boldsymbol\cdot\,} {\boldsymbol{\omega }} = (\nabla \times a) {\,\boldsymbol\cdot\,} {\boldsymbol{\omega }} + {\boldsymbol{\omega }} {\,\boldsymbol\cdot\,} \nabla {\boldsymbol{u}} {\,\boldsymbol\cdot\,} {\boldsymbol{\omega }} - \vartheta {\boldsymbol{\omega }} {\,\boldsymbol\cdot\,} {\boldsymbol{\omega }}. \end{equation}
Equation (B3) can be written as
 \begin{equation} \frac {{{\textrm D}\varOmega }}{{{\textrm D}t}} = {\boldsymbol{\omega }} {\,\boldsymbol\cdot\,} (\nabla \times \boldsymbol{a}{\textrm {)}} + 2\alpha \varOmega, \end{equation}
where
 \begin{equation} \alpha = {\boldsymbol{t}} {\,\boldsymbol\cdot\,} ({\boldsymbol{D}} - \vartheta {\boldsymbol{I}}) {\,\boldsymbol\cdot\,} {\boldsymbol{t}}, \end{equation}
where
 $\boldsymbol{t}$
is the unit vector along the vortex line direction. Here
 $\alpha$
represents the stretching rate of a single vorticity line (infinitely thin vortex tube). For the viscous compressible fluid without external body force in this study, more dynamic characteristics of the vorticity field are contained in
 $\nabla \times \boldsymbol{a}$
. Substituting (2.6) into (B2), the vorticity evolution equation becomes
 \begin{equation} \frac {{{\textrm D}{\boldsymbol{\omega }}}}{{{\textrm D}t}} = \frac {1}{{{\rho ^2}}}\nabla \rho \times \nabla p + \nu {\nabla ^2}{\boldsymbol{\omega }} + {\boldsymbol{\omega }} {\,\boldsymbol\cdot\,} \nabla {\boldsymbol{u}} - \vartheta {\boldsymbol{\omega }}. \end{equation}
The equation reflects the baroclinic effect and viscous diffusion effect of the fluid. Similarly, the enstrophy evolution equation can be obtained in the compressible viscous flow. Substituting (2.6) into (B4):
 \begin{equation} \frac {{{\textrm D}{\varOmega }}}{{{\textrm D}t}} = \frac {1}{{{\rho ^2}}}(\nabla \rho \times \nabla p) {\,\boldsymbol\cdot\,} {\boldsymbol{\omega }} + \nu {\nabla ^2}{\boldsymbol{\omega }} {\,\boldsymbol\cdot\,} {\boldsymbol{\omega }} + 2\alpha {\varOmega }. \end{equation}
On the wall boundary, we take the tangential component of (2.6):
 \begin{equation} {\boldsymbol{n}} \times {\boldsymbol{a}} = - {\boldsymbol{n}} \times \frac {1}{\rho }\nabla p + {\nu _\theta }{\boldsymbol{n}} \times (\nabla \vartheta ) - \nu {\boldsymbol{n}} \times (\nabla \times {\boldsymbol{\omega }}). \end{equation}
Using tensor operator relations
 \begin{equation} {\boldsymbol{b}} \times (\nabla \times {\boldsymbol{c}}) = ({\boldsymbol{b}} \times \nabla ) \times {\boldsymbol{c}} + {\boldsymbol{b}}(\nabla {\,\boldsymbol\cdot\,} {\boldsymbol{c}}) - {\boldsymbol{b}} {\,\boldsymbol\cdot\,} \nabla, \end{equation}
(B8) can be written as
 \begin{equation} {\boldsymbol{n}} \times {\boldsymbol{a}} = - {\boldsymbol{n}} \times \frac {1}{\rho }\nabla p + {\nu _\theta }{\boldsymbol{n}} \times (\nabla \vartheta ) - \nu ({\boldsymbol{n}} \times \nabla ) \times {\boldsymbol{\omega }} + \nu {\boldsymbol{n}} {\,\boldsymbol\cdot\,} \nabla {\boldsymbol{\omega }}. \end{equation}
The wall is stationary in this study, so
 ${\boldsymbol{n}} \times {\boldsymbol{a}}=0$
. Definition:
 \begin{align}&\quad \nu {\boldsymbol{n}} {\,\boldsymbol\cdot\,} \nabla {\boldsymbol{\omega }} = {\boldsymbol{\sigma }}, \end{align}
 \begin{align}&\,\,\, {\boldsymbol{n}} \times \frac {1}{\rho }\nabla p = {{\boldsymbol{\sigma }}_p}, \end{align}
 \begin{align}&\, {\nu _\theta }{\boldsymbol{n}} \times (\nabla \vartheta ) = {{\boldsymbol{\sigma }}_{{ {vis1}}}}, \end{align}
 \begin{align}& \nu ({\boldsymbol{n}} \times \nabla ) \times {\boldsymbol{\omega }} = {{\boldsymbol{\sigma }}_{vis2}}. \end{align}
There exists an equation:
 \begin{equation} {\boldsymbol{\sigma }} = {{\boldsymbol{\sigma }}_p}{\textrm { + }}{{\boldsymbol{\sigma }}_{vis2}} - {{\boldsymbol{\sigma }}_{{{vis1}}}}. \end{equation}
The dot product of BVF and
 $\boldsymbol{\omega }$
affords the BEF:
 \begin{equation} \eta = v{\partial _n}\frac {{{{\boldsymbol{\omega }}^2}}}{2} = {\boldsymbol{\omega }} {\,\boldsymbol\cdot\,} {\boldsymbol{\sigma }} = {\eta _p} + {\eta _{vis2}} - {\eta _{vis1}}. \end{equation}