INTRODUCTION
The Mediterranean mussel Mytilus galloprovincialis (Lamarck, 1819) is widespread along the Mediterranean coasts, from where it is supposed to originate (Riginos & Cunningham, Reference Riginos and Cunningham2005), while outside of these regions, it also occurs at the Atlantic coasts of Western Europe hybridizing with M. edulis (Hilbish et al., Reference Hilbish, Carson, Plante, Weaver and Gilg2002; Bierne et al., Reference Bierne, Borsa, Daguin, Jollivet, Viard, Bonhomme and David2003; Kijewski et al., Reference Kijewski, Smietanka, Zbawicka, Gosling, Hummel and Wenne2011). Moreover, it has been widely translocated around the world by human activity, mainly for aquaculture purposes (Westfall & Gardner, Reference Westfall and Gardner2010; Smietanka et al., Reference Smietanka, Zbawicka, Sanko, Wenne and Burzynski2013), as mussels are nowadays one of the most popular cultured species (Karayucel et al., Reference Karayucel, Çelik, Karayücel, Ozturk and Eyuboglu2013). Italy is the predominant country in mussel culture within the Mediterranean Sea, employing more than 250 companies and reaching 123,000 tons annually (Parisi et al., Reference Parisi, Centoducati, Gasco, Gatta, Moretti, Piccolo, Roncarati, Terova and Pais2012). In Greece, the annual production in 2008 was 36,000 tons, with a continuous trend of expansion by licensing new farming sites (Theodorou et al., Reference Theodorou, Viaene, Sorgeloos and Tzovenis2011). In other coastal countries of the eastern Mediterranean, although mussel culture has not reached yet such high levels—for example, Turkey and Croatia produce around 1000 tons yr−1 (Oraic & Zrncic, Reference Oraic and Zrncic2005; Karayücel et al., Reference Karayucel, Çelik, Karayücel and Erik2010)—there is a very good potential for further development. Further, beyond their commercial interest, mussels are considered organisms of great ecological importance (Vidal et al., Reference Vidal, Penaloza, Urzua and Toro2009).
Despite the great economic and biological importance of the species, the genetic structure of Mediterranean mussel populations from the central–eastern Mediterranean Sea is essentially unknown. Yet, such information is crucial for the development of appropriate strategies for management of both cultured and wild populations. In fact, existing management models may sometimes be refined, taking into account new observations regarding the genetic composition of the species (Graves, Reference Graves1998). The few genetic studies that have been published so far have not yielded a clear outcome about the genetic status of mussel populations from the above area. The scopes of those studies were either limited to comparisons of a few local populations such as those from the north Aegean Sea using mtDNA and allozyme analyses (see Karakousis & Skibinski, Reference Karakousis and Skibinski1992; Kravva et al., Reference Kravva, Staikou and Triantaphyllidis2000), from the Venice Lagoon using allozymes (Venier et al., Reference Venier, Tallandini and Bisol2003) and from Croatian coasts using microsatellites (Stambuk et al., Reference Stambuk, Srut, Satovic, Tkalec and Klobucar2013), or yield controversial findings. For instance, while a mtDNA based typing survey found genetic homogeneity among Aegean mussel populations (Ladoukakis et al., Reference Ladoukakis, Saavedra, Magoulas and Zouros2002), a recent study based on RAPD markers (Giantsis et al., Reference Giantsis, Kravva and Apostolidis2012) revealed significant levels of genetic heterogeneity among them. However, neither of these two studies involved microsatellite markers, which are supposed to be more informative in resolving spatial genetic structures (Lougheed et al., Reference Lougheed, Gibbs, Prior and Weatherhead2000). Notably, Kijewski et al. (Reference Kijewski, Smietanka, Zbawicka, Gosling, Hummel and Wenne2011), who used nuclear and mtDNA markers to investigate the genetic structure of Mytilus species on a large European scale, did not include in their analysis samples from the Aegean, Ionian and Adriatic Seas.
Microsatellites are considered to be one of the most useful molecular markers for addressing questions in population genetics (Hauffe & Sbordoni, Reference Hauffe, Sbordoni, Bertorelle, Bruford, Hauffe, Rizzoli and Vernessi2009). Nonetheless, these markers have their own limitations, due to homoplastic alleles, allelic drop-out and null alleles (Van Oosterhout et al., Reference Van Oosterhout, Hutchinson, Willis and Shipley2004; Pompanon et al., Reference Pompanon, Bonin, Bellemain and Taberlet2005). A null allele can be defined as any allele that fails to be amplified during the polymerase chain reaction (PCR) by a given pair of primers (Dakin & Avise, Reference Dakin and Avise2004). Microsatellite null alleles have been detected in a variety of species, but they occur with unusual high frequencies in some groups, particularly in molluscs (Carlsson et al., Reference Carlsson2008; Lemer et al., Reference Lemer, Rochel and Planes2011). Highly frequent null alleles may be caused by frequent single nucleotide polymorphisms in flanking non-coding regions, as a consequence of the huge effective population sizes of marine bivalves (Lallias et al., Reference Lallias, Stockdale, Boudry, Lapègue and Beaumont2009). Marine bivalves are also characterized by high levels of heterozygote deficiency (Vidal et al., Reference Vidal, Penaloza, Urzua and Toro2009), which has been predominantly attributed to the presence of null alleles (Launey et al., Reference Launey, Ledu, Bourdy, Bonhomme and Naciri-Graven2002; Lemer et al., Reference Lemer, Rochel and Planes2011).
The present study was designed to clarify the genetic structure of wild and cultured populations of M. galloprovincialis sampled from the central–eastern Mediterranean Sea and genotyped using microsatellite markers. Furthermore, we attempted to evaluate the influence of null alleles on the genetic variability of mussels, as well as the impact of anthropogenic transplantations on the population differentiation and genetic make-up of these populations.
MATERIALS AND METHODS
Sample collection and DNA extraction
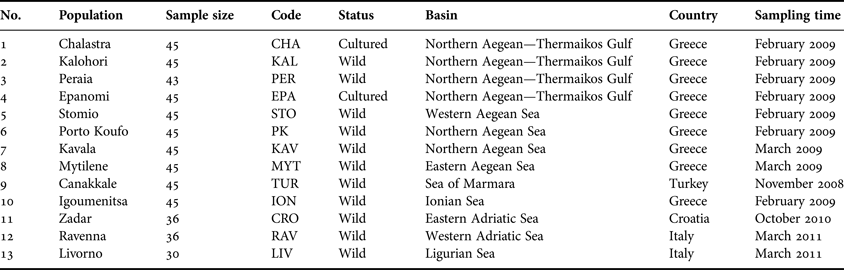
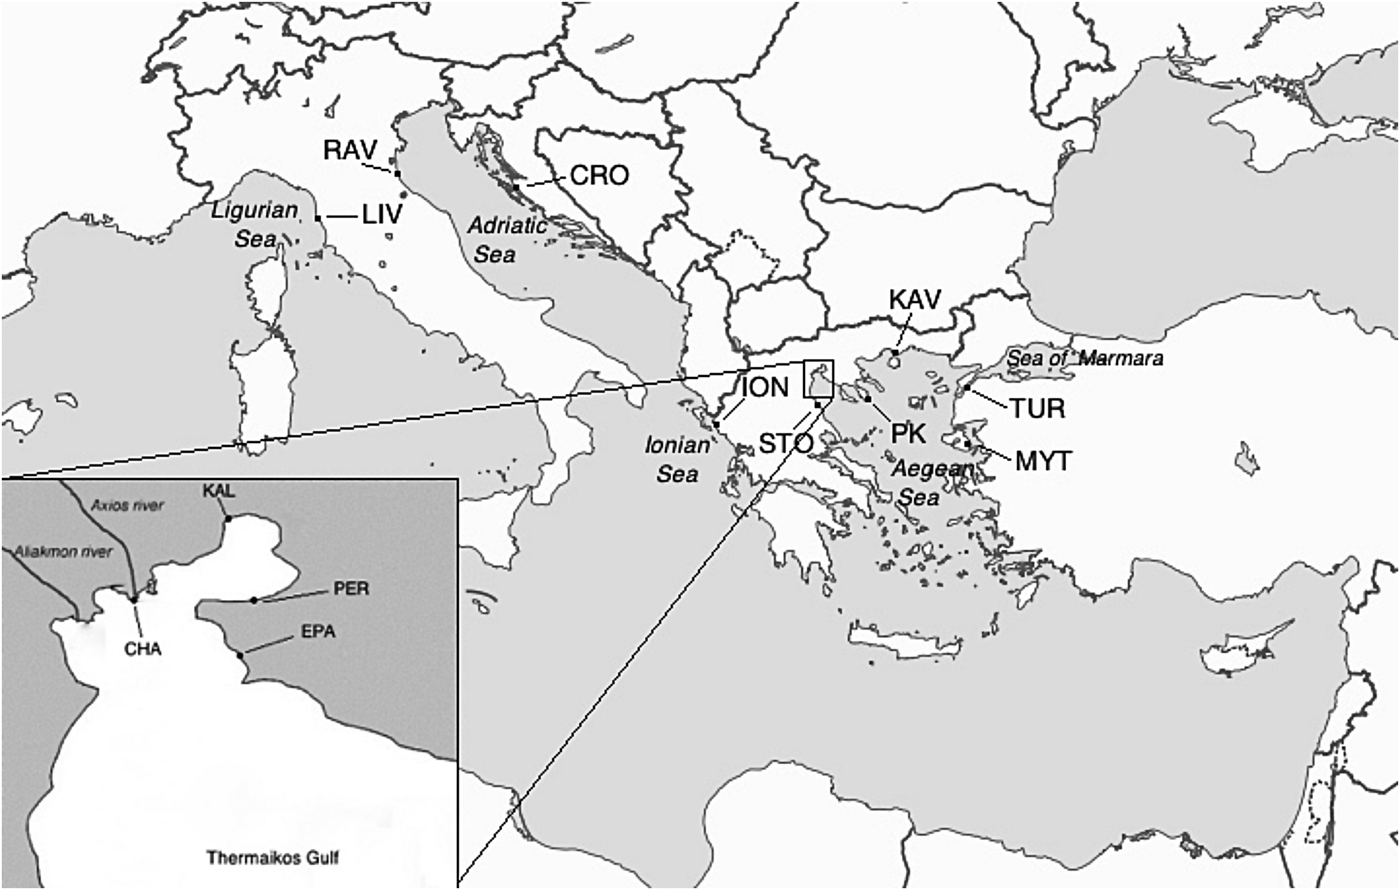
A total of 550 M. galloprovincialis individuals were collected by hand or diving, from 13 localities across the coasts of the central–eastern Mediterranean Sea, originating from Italy, Croatia, Greece and Turkey (Figure 1; Table 1). The selected sampling sites are representatives of the greatest part of M. galloprovincialis geographical distribution in the above area, including the Ligurian, Adriatic, Ionian, Aegean and Marmara Seas. Of particular importance in studying the genetic structure of Mediterranean mussels is the Gulf of Thermaikos, located at the northern part of the Aegean Sea. This is a semi-enclosed basin plentiful in organic material due to the discharge of approximately 150 m3 s−1 water by three rivers and with a maximum depth of 45 m, the west part of which comprises the most important shellfish cultivating area (Koukaras & Nikolaidis, Reference Koukaras and Nikolaidis2004), offering excellent conditions for growth and preservation of mussel stocks (Arsenoudi et al., Reference Arsenoudi, Scouras and Chintiroglou2003). Thus, four of the samples were located within this Gulf, with two of them representing cultured populations (Chalastra and Epanomi) that were collected with the permission of the owners of the mussel farms. The remaining nine samples were collected from wild stocks (Table 1), none of which was part of a national park, privately owned area or protected in any other way, thus no specific permission was required. Mussels were transported alive to the laboratory where a small piece of the mantle tissue was removed from each specimen and used for DNA extraction. The standard phenol extraction protocol of Hillis et al. (Reference Hillis, Moritz and Mable1996) was applied for isolation of total genomic DNA and the extracted DNA was quantified by Infinite® 200 PRO NanoQuant spectrophotometer (TECAN). All individuals were taxonomically identified to belong to M. galloprovincialis, using the nuclear DNA marker Me15/17 (Bierne et al., Reference Bierne, Borsa, Daguin, Jollivet, Viard, Bonhomme and David2003).
Sampling locations of Mytilus galloprovincialis in the central–eastern Mediterranean: code explanations and additional information for each population are reported in Table 1.
Sampling sites' additional information.

Selection of microsatellite primers
In order to find the most appropriate loci for the genetic analysis of mussel populations, 22 polymorphic microsatellite primer pairs, all specific for the three recognized species of closely related Mytilus, that is, M. galloprovincialis, M. edulis and M. trossulus (Beaumont et al., Reference Beaumont, Hawkins, Doig, Davies and Snow2008), were chosen from the literature and tested on 20–30 randomly selected individuals. These were: Mgμ1, Mgμ2, Mgμ3, Mgμ4, Mgμ5, Mgμ6, (Presa et al., Reference Presa, Peréz and Diz2002), MGE001, MGE002, MGE005 MGE006, MGE007, MGE008 (Yu & Li, Reference Yu and Li2007), Mg181, Mg220 (Varela et al., Reference Varela, Gonzáles-Tizόn, Marinas and Martinez-Lage2007), Med362, Med367, Med737, Med740, Med744 (Lallias et al., Reference Lallias, Stockdale, Boudry, Lapègue and Beaumont2009), MT203 and MT282 (Gardeström et al., Reference Gardeström, Pereyra and Andrè2008). Amplicons were initially checked in agarose gels and afterwards on an ABI-Prism 3130xL automatic sequencer (Life Tecjnologies, Foster City, USA). Based on the clarity and reproducibility of the banding patterns, 10 of these primers (Mg181, MT203, MT282, MGE001, MGE005, MGE006, MGE008, Med367, Mgμ3 and Mgμ7) were selected for further screening.
Tailed PCR method and PCR reaction conditions
Forward primers were synthesized with the addition of a short tail at the 5′ end. This tail is complementary to a fluorescent labelled oligonucleotide sequence joining the primer during the PCR reaction. Three tails labelled with different fluorescent labels were used to enable the analysis on the ABI-Prism 3130xL automatic sequencer. This procedure, described by Schuelke (Reference Schuelke2000), decreases the total cost of the method, as it avoids the need of a large number of primers carrying a fluorescent dye label. Each PCR mixture consisted of 25–50 ng of template DNA, one unit of Taq DNA polymerase, 1 μl 10 × Taq DNA polymerase buffer including 1.5 mM MgCl2, 2 μg BSA, 0.2 mM each of dNTP, 1 pmol unlabelled forward primer, 10 pmol unlabelled reverse primer and 10 pmol labelled tail primer in 10 μl of total reaction volume. Amplification reactions were carried out in an ABI 9700 thermocycler (Life Technologies) consisting of an initial denaturation for 2 min at 94°C, followed by: (a) 10 cycles of 40 s at 94°C, 90 s at a temperature depending on the primer with a touchdown procedure (decreasing 0.5 or 1°C per cycle) and 60 s at 72°C; (b) 35 cycles of 40 s at 94°C, 90 s at the lowest temperature value of the touchdown scale and 60 s at 72°C, for the amplification of the target sequence; (c) 10 cycles of 40 s at 94°C, 90 s at 50°C and 60 s at 72°C, for the hybridization of the tailed primers; and (d) 10 min at 72°C for a final extension. All reactions were performed in a 96-well plate using always at least one negative sample (no DNA in PCR) and all PCR products were analysed in the ABI-Prism 3130xL automatic sequencer.
Data analysis
Alleles were scored using the software GENEMAPPER v.4.0 (Applied Biosystems) and named according to their nucleotide size. Input files for several statistical computer programs were created using CREATE v.2 (Coombs et al., Reference Coombs, Letcher and Nislow2008). The software MICROCHECKER (Van Oosterhout et al., Reference Van Oosterhout, Hutchinson, Willis and Shipley2004) was used to investigate the presence of PCR errors like stuttering, large allele dropouts and null alleles. As analysis with MICROCHECKER indicated strong evidence of null alleles at all loci, allele frequencies for each locus and population were estimated by the expectation maximization algorithm (Dempster et al., Reference Dempster, Laird and Rubin1977) implemented in the package FreeNA. This software also provides a correction method for the bias of null alleles on FST estimation (Chapuis & Estoup, Reference Chapuis and Estoup2007). Since the reliability of this method depends on its capacity to integrate the missing data, only samples with seven or more successful loci amplifications were included in the genetic structure analysis.
The number of effective alleles (allelic richness) per locus in each population (standardized to a minimum of 26 genes per population) was estimated without frequency adjustments for null alleles using HP-RARE v.1.0 (Kalinowski, Reference Kalinowski2005). Deviations from Hardy–Weinberg equilibrium (HWE) were estimated following Hedrick's (Reference Hedrick2000) procedures implemented in GENALEX v.6.41 (Peakall & Smouse, Reference Peakall and Smouse2006), whereas linkage disequilibrium and allele frequency differences among populations or between pairs of populations were estimated by Fisher exact tests using GENEPOP v.4.1.0 (Raymond & Rousset, Reference Raymond and Rousset1995). Expected heterozygosity (He), observed heterozygosity (Ho) and inbreeding coefficient (FIS) were computed with and without correction for null alleles using GENETIX (Belkhir et al., Reference Belkhir, Borsa, Goudet, Chickhi and Bonhomme2004). Corrected He, Ho and FIS for each population was computed taking account only loci with null allele frequencies lower than 0.2, as these loci are not considered as potentially problematic for the analysis (Dakin & Avise, Reference Dakin and Avise2004; Chapuis & Estoup, Reference Chapuis and Estoup2007; Lawson Handley et al., Reference Lawson Handley, Byrne, Santucci, Townsend, Taylor, Bruford and Hewitt2007). Since significant heterozygote deficiency is frequent in invertebrates, and in our case-study it did not disappear even after the withdrawal of loci with high proportions of null alleles, a test for self-fertilization was carried out by the calculation of selfing rate for each population with the program RMES (David et al., Reference David, Pujol, Viard, Castella and Goudet2007). This computer program is not sensitive to null alleles and scoring errors.
An analysis of molecular variance (AMOVA) was carried out to partition genetic variation among and within groups using ARLEQUIN v.3.1 (Excoffier et al., Reference Excoffier, Laval and Schneider2005) and their significance was assessed by 10,000 permutations. Population structure was also investigated by the calculation of Reynolds et al., (Reference Reynolds, Weir and Cockerham1983) genetic distance with 1000 bootstrap permutations, harbouring null alleles after the including null alleles (INA) correction method of allele frequencies (Chapuis & Estoup, Reference Chapuis and Estoup2007). Values of genetic distance computed by this method were then compared with those that had not been corrected for null alleles, computed by GENDIST v.3.69 in the PHYLIP package (Felsenstein, Reference Felsenstein2005). In order to visualize these comparisons two UPGMA dendrograms were constructed by the software TREEVIEW (Page, Reference Page1996). Discriminant analysis of principal component (DAPC) was computed using the ADEGENET (Jombart, Reference Jombart2008) in R (http://cran.r-project.org/web/packages/fields/index.html). A total of 100 principal components and five discriminant functions were retained for the computations. The genetic relationships among populations were also visually evaluated through a principal component analysis (PCA) carried out on gene frequency data with the program PCAGEN 1.2.1 (Goudet, Reference Goudet2005). FST values among populations were computed before and after correction for null alleles using the excluding null alleles (ENA) method (Chapuis & Estoup, Reference Chapuis and Estoup2007) implemented in FREENA. Moreover, ΦST values (analogous to FST), were estimated using the software GENOTYPE (Meirmans & Van Tiendersen, Reference Meirmans and Van Tiendersen2004). Finally, a Mantel test embedded in GENALEX v.6.41 (Peakall & Smouse, Reference Peakall and Smouse2006) was conducted to examine the isolation by distance model (IBD), that is, to correlate geographical and genetic distances. Its significance was assessed by 999 random permutations.
As both the DAPC diagram and pairwise exact tests suggested genetic homogeneity among discrete samples, the software POWSIM v.4.1 (Ryman & Palm, Reference Ryman and Palm2006) was used to assess this presumption. This is a simulation-based method, which measures the probability of incorrectly rejecting the hypothesis of no population structuring and the statistical power for detecting genetic differentiation with a χ2 and a Fisher exact test. The tests were performed both for the global scenario (all samples) and for the Aegean Sea (8 populations) using adjusted (by FreeNA) allele frequencies. A thousand simulations were run applying combinations of N e and t leading to FST values of 0.001, 0.0025, 0.005 and 0.01. Number of dememorizations, batches and iterations were set as default—that is, 1000, 100 and 1000 respectively.
RESULTS
Data quality
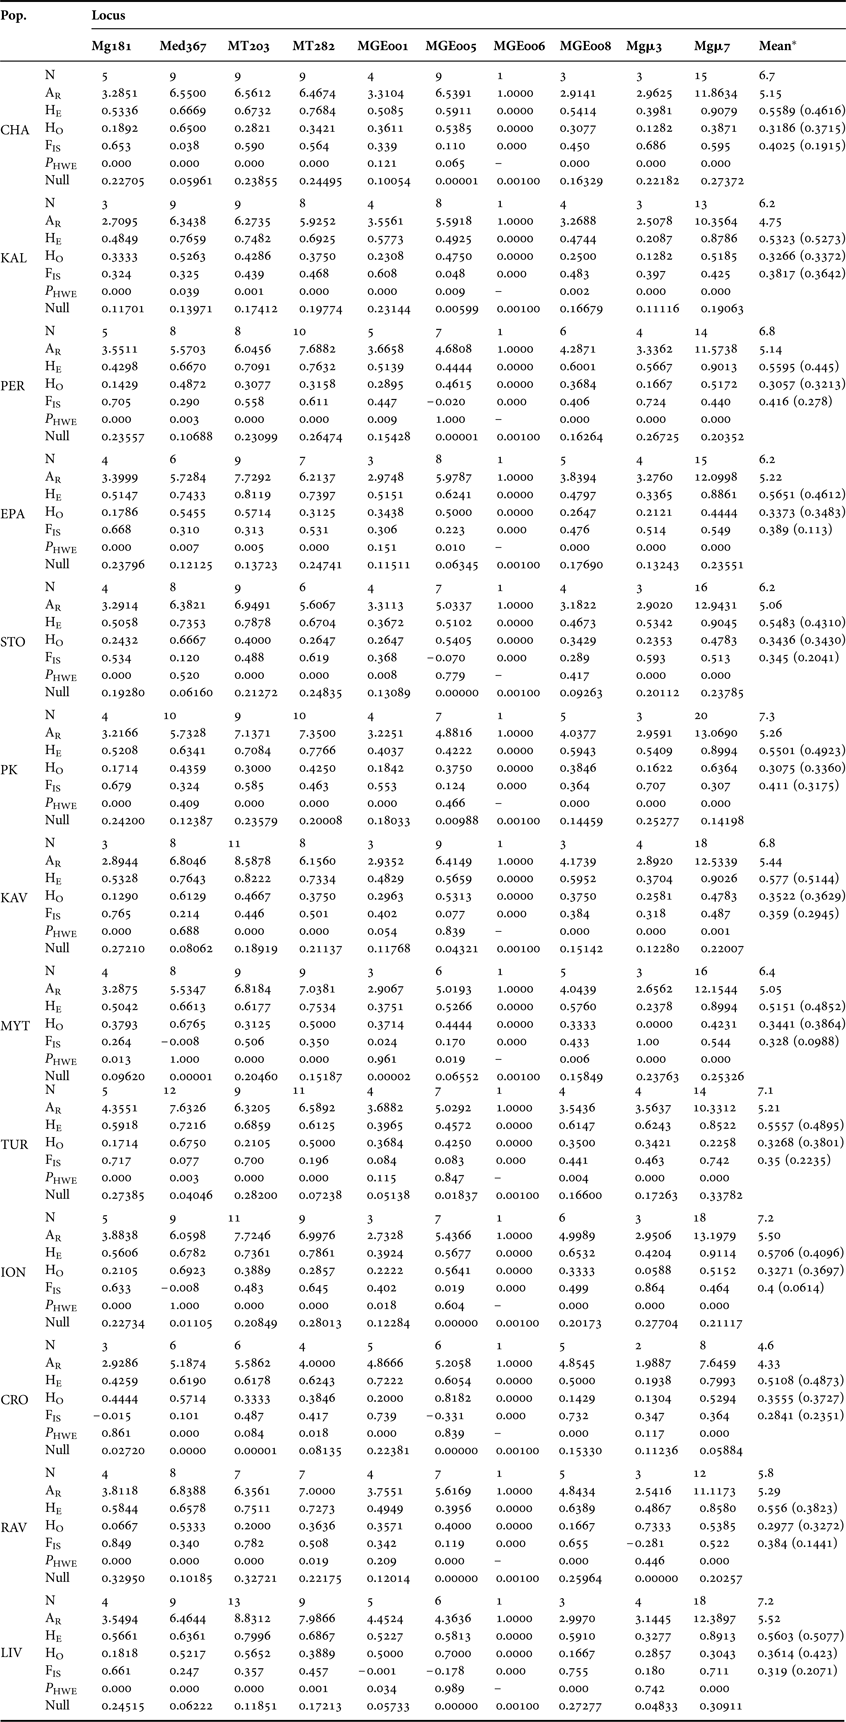
No evidence for large allelic dropout or scoring errors due to stuttering was found by MICROCHECKER. However, both MICROCHECKER and FreeNA revealed evidence for the presence of null alleles in all loci. Null allele frequencies for each locus and population varied between 0.00 and 0.34 (Table 2) as computed by the EM algorithm, so genetic structure was analysed with and without correction for null alleles. Given that null alleles could be attributed to point mutations of primers binding sites (Chapuis & Estoup, Reference Chapuis and Estoup2007), primers designed to amplify target sequences from closely related species could have potential disadvantages. Nevertheless, in our study despite the use of three non-specific primers (Med367, MT203 and MT282) the two loci that exhibited an average null allele frequency greater than 0.2 (Mg181 and Mgμ7 with 0.20952 and 0.22123, respectively) were those designed specifically for M. galloprovincialis. Further, due to the influence of null alleles, through an increase of FST values on the genetic differentiation between population pairs of small size (<20 individuals, White et al., Reference White, Fotherby, Stephens and Hoelzel2011), all mussel populations utilized in this study consisted of at least 30 individuals (Table 1). Therefore, as indicated by comparisons of corrected and non-corrected FST and genetic distance, although null alleles have been detected in all loci, they did not seem to affect the results of interpopulation genetic differentiation.
Genetic diversity parameters of thirteen Mytilus galloprovincialis populations from central–eastern Mediterranean estimated by 10 microsatellites. Number of alleles per locus (N), allelic richness (AR), expected (HE) and observed heterozygosity (HO), inbreeding coefficient (FIS), P values for tests of departure from HWE (P HWE) and the frequency of null alleles (Null) are shown for each population, for each locus and across all loci. Values in parentheses represent the corrected estimates of HE, HO and FIS.
Genetic and genotyping diversity
With the exception of MGE006 locus, which was monomorphic, substantial levels of polymorphism were observed. Table 2 shows the basic parameters of genetic diversity estimated in each population. The overall number of alleles per locus ranged from 5 at Mg181, to 31 at Mgμ7, with a mean value of 11.8. Although there were cases of fewer alleles for particular loci across populations, average allelic richness did not differ highly among the 13 geographical regions, with the mean value ranging from 4.33 in the Croatian population to 5.52 in that of Livorno. Further, approximately equal values of observed and expected heterozygosity were revealed among the 13 populations (Table 2), indicating a pattern of similar genetic diversity in all populations. Instead, a strong discrepancy between observed and expected heterozygosity was detected in all populations, albeit these values were reduced when recalculated using the correction for null alleles (Table 2). This heterozygote deficit was also reflected in FIS values and was directly related to multiple deviations from HWE (in 91 out of 117 tests performed; Table 2). Overall expected (He) and observed (Ho) heterozygosity values at species level were 0.577 and 0.459 without correction, and 0.332 and 0.342 with null allele correction, respectively, while the corresponding Fis values were 0.365 and 0.207, respectively. The selfing rate as estimated by RMES was 0.043 at species level, suggesting the rejection of self fertilization hypothesis in mussel populations. Finally, no significant disequilibrium between pairs of loci within each population was detected (468 tests) whereas tests between pairs of loci from all 13 populations (36 tests) disclosed significant disequilibria only between Med367 and MT282 loci.
Genetic differentiation
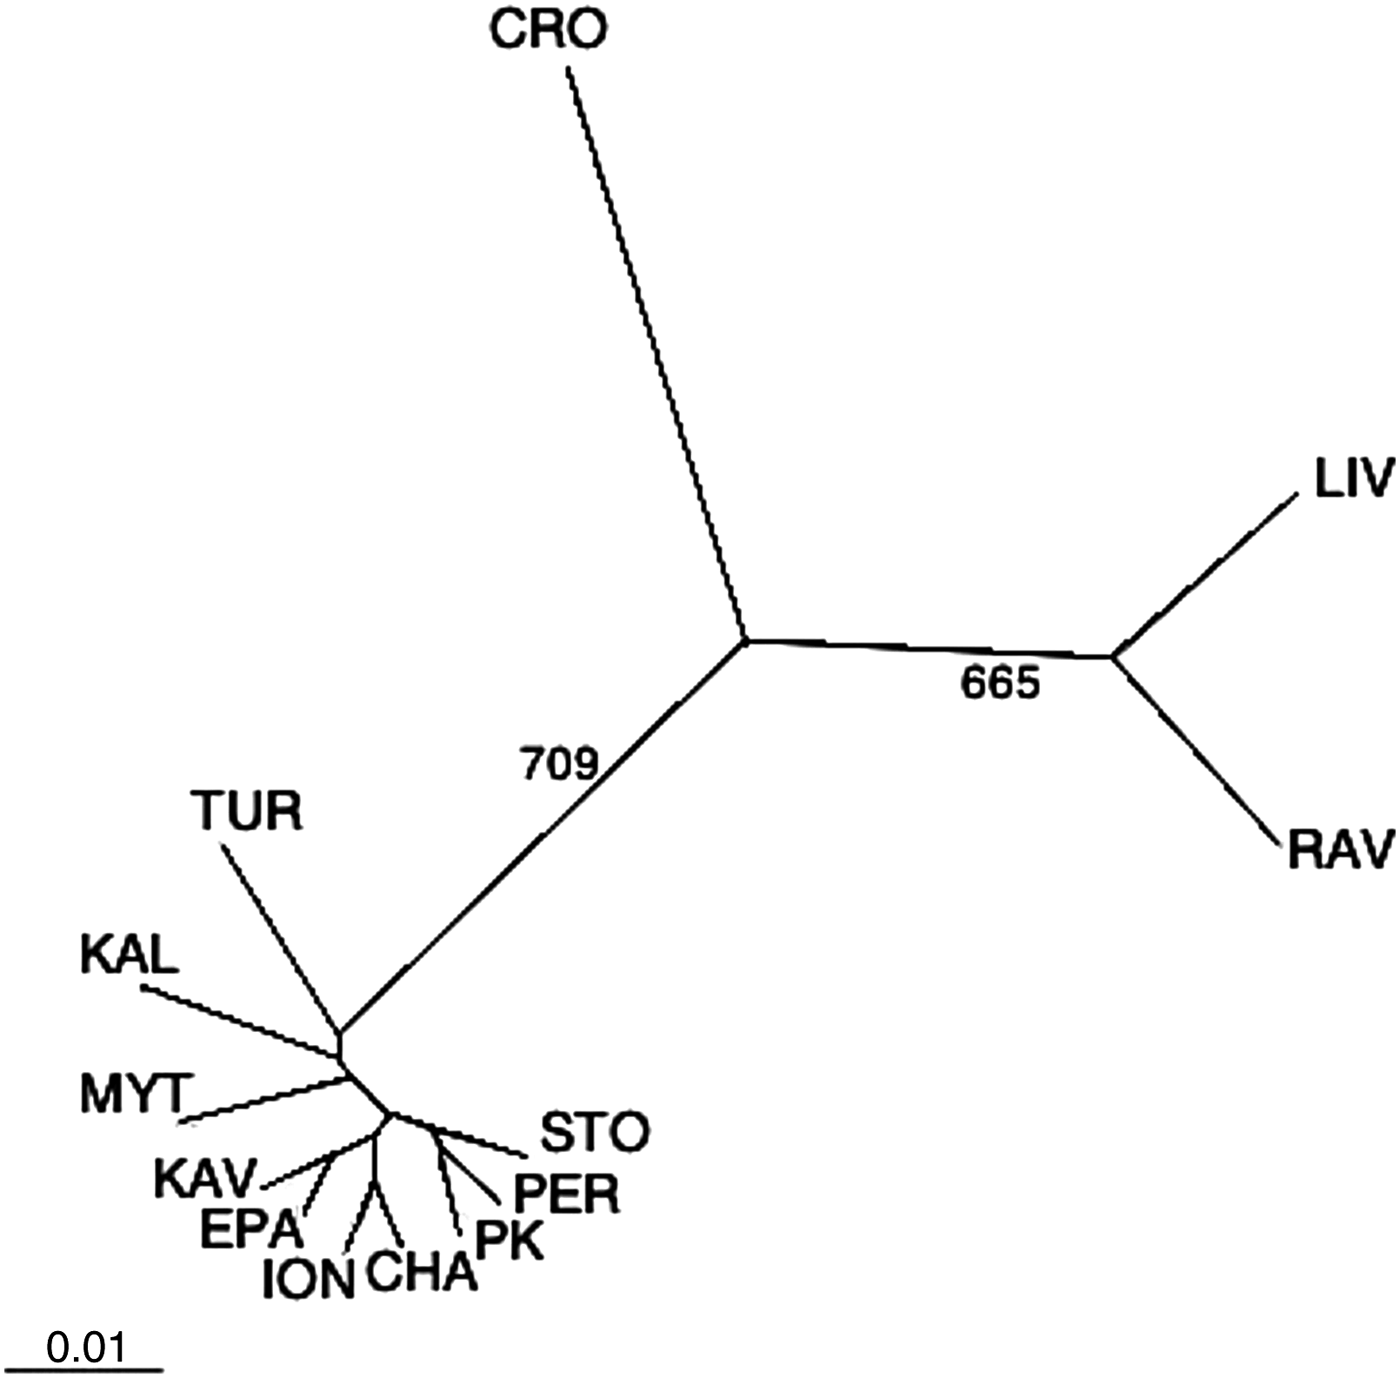
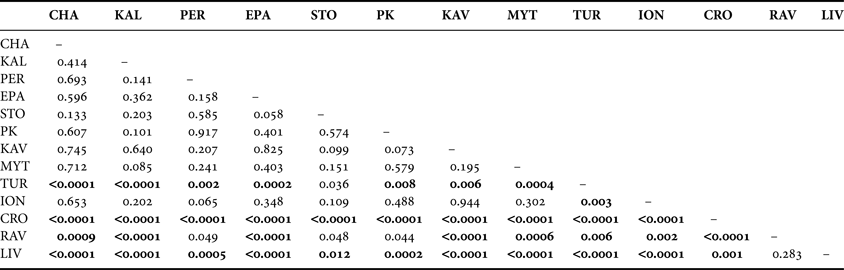
The UPGMA dendrogram, constructed from Reynolds' genetic distances after correction for null alleles, is shown in Figure 2, whereas the DAPC diagram is displayed in Figure 3. Notably, the UPGMA dendrogram constructed without applying the corrections or by using other distance methods, such as Nei's (Reference Nei1978) and Cavalli-Sforza's chord measure DCE (Cavalli-Sforza & Edwards, Reference Cavalli-Sforza and Edwards1967), as well as the PCA plot derived from PCAgen 1.2.1 (not shown) yielded very similar patterns, clustering the populations into three different groups. The first group comprised all Greek populations and the Turkish one; the second the two Italian populations, whereas the third group comprised only the population from Croatia. Fisher's exact tests and FST values among all populations revealed significant genetic differentiation regardless of whether the ENA correction method was used or not (FST = 0.024 and FST = 0.022, P < 10−5, respectively). Significant differentiation, although smaller, was also revealed by Φ statistics (ΦST = 0.013, P = 0.011). In contrast, as it concerns the Aegean populations both the FST and ΦST values were not significant i.e. the FST values (with and without correction) were 0.006 and 0.004 (P = 0.282 and P = 0.356, respectively), while the ΦST value was 0.001 (P = 0.30). None of the pairwise comparisons for genetic heterogeneity among populations within Aegean Sea was significant (Table 3), after applying the Benjamini & Hochberg's false discovery rate procedure (Verhoeven et al., Reference Verhoeven, Simonsen and McIntyre2005). In addition, no significant genetic differentiation was observed between the two Italian populations, as well as between the Ionian and the Aegean populations. On the other hand, differentiation of Italian, Croatian and Turkish populations versus Aegean populations was predominately highly significant (Table 3).
UPGMA tree indicating Reynolds' genetic distances among the 13 Mytilus galloprovincialis populations after gene frequency adjustment for null alleles. Bootstrap values greater than 500 are shown on the branches. The constructed tree before the null allele correction was equal therefore is not shown.
DAPC plot of mussel populations. Dots represent individuals, whereas coloured ellipses correspond to geographical populations. DA and PCA scatterplots in the left side of the graphs indicate the number of discriminant functions and PCs retained for the computations. CHA, Chalastra; KAL, Kalohori; PER, Peraia; EPA, Epanomi; STO, Stomio; PK, Porto Koufo; KAV, Kavala; MYT, Mytilene; TUR, Canakkale; ION, Igoumenitsa; CRO, Zadar; RAV, Marina di Ravenna; LIV, Livorno.

Pairwise exact tests. P values for each pairwise exact test for genetic heterogeneity across all loci (Fisher's method). Significant values after Benjamini and Hochberg correction (P ≤ 0.023) are shown in bold.
The AMOVA was used to partition the variation among and within group (population) components. At first, populations were pooled into three geographical groups: all Aegean populations, together with the one from the Sea of Marmara, were treated as one group; populations from the Adriatic Sea (Zadar and Ravenna) constituted the second group, whereas Livorno (Ligurian Sea) has been considered as a separated third group. The sample from the Ionian Sea (Igoumenitsa) was omitted from the AMOVA, as it was evidenced that nearby mussel transfers may have influenced it (see Discussion below). The results demonstrated that most variation exists within populations (97.16%) followed by that attributed to among groups (2.08%) and among populations within groups (0.76%) (Table 4). Despite the small amounts of genetic variation that are attributable to grouping of populations by and within basins, variation in each partition was significantly different from zero (P < 0.05). Interestingly in a second AMOVA, when only Aegean populations were considered, the FST value fell to 0.004 and among populations variation was found to be non-significant (P = 0.36) accounting only for 0.49% of the total variance (Table 4). These results indicate panmixia of mussels along Aegean coasts and are in consistency with the assignment analyses performed with the GENECLASS2 (Piry et al., Reference Piry, Alapetite, Cornuet, Paetkau, Baudouin and Estoup2004) where only 16.2% of the Aegean mussels were assigned correctly to the population from which they were sampled. In addition, the Mantel test revealed a significant correlation between geographical and genetic distances (r = 0.822; P = 0.004) which, however, does not hold for the eastern Mediterranean samples—the eight Aegean populations and the one from the sea of Marmara—where no such correlation was found (r = −0.045; P = 0.723).
Analysis of molecular variance.
Two-level hierarchical AMOVA. 1Considering all populations in three main groups: Aegean and Marmara Sea; Adriatic and Ligurian Sea. 2Solely for the Aegean populations (one group).
Power analysis
POWSIM analysis estimated that there was more than 96% statistical chance of detecting genetic differentiation when global FST (first case: including all samples) was 0.0025, and 100% when FST was 0.005 or higher. Concerning the case of Aegean populations, 78.6% of the χ 2 tests and 64.3% of the Fisher tests indicated significant genetic differentiation when FST was set to 0.005. Only when expected FST was increased to 0.01, were values of statistical power found to be 100% for the χ 2 test and 98.7% for the Fisher test. Thus, regarding mussels from Aegean Sea, the hypothesis of genetic homogeneity cannot be excluded.
DISCUSSION
Intra-population genetic diversity
High levels of genetic diversity are common within marine bivalves (Marin et al., Reference Marin, Fujimoto and Arai2013 and references therein). On the other hand, several studies have demonstrated a reduction in genetic variability within cultured aquatic populations over a relatively short period of time as a result of inbreeding (e.g. Sekino et al., Reference Sekino, Hara and Taniguchi2002; Lind et al., Reference Lind, Evans, Knauer, Taylor and Jerry2009; De La Cruz et al., Reference De La Cruz, Rio-Portilla and Gallardo-Escarate2010). In mussels, although no artificial fertilization of eggs is carried out (Gosling, Reference Gosling2003), loss of the mean multi-locus heterozygosity has been reported in suspension-cultured populations of M. edulis, in Iles-de-la-Madeleine (Quebec, Canada) (Myrand et al., Reference Myrand, Tremblay and Sevigny2009 and references therein). The phenomenon occurred mostly in the periphery of the sleeves and was attributed to fall-offs of heterozygous individuals. Nevertheless, our results indicate that the two cultured populations of M. galloprovincialis exhibit similar level of genetic diversity (i.e. heterozygosity and allelic richness values) with the wild Mediterranean populations (Table 2), information that may be extremely useful in future management practices. A similar conclusion was drawn in a previous analysis of the present cultured populations with RAPD markers (Giantsis et al., Reference Giantsis, Kravva and Apostolidis2012) suggesting that the mussel culture systems employed in the eastern Mediterranean (as well as in the western Mediterranean, Diz & Presa, Reference Diz and Presa2009) do not lead to bottlenecks of exploited populations.
Deviation from HWE and heterozygote deficiency
Significant departures from HWE associated with heterozygote deficiencies were observed in the majority of the loci examined, in all populations (Table 2). Heterozygote deficiencies have been frequently observed in marine bivalves (e.g. Marin et al., Reference Marin, Fujimoto and Arai2013) including those of Mytilus (Addison et al., Reference Addison, Ort, Mesa and Pogson2008; Diz & Presa, Reference Diz and Presa2009). The cause of these observations is probably a combination of technical features and biologically based factors (i.e. null alleles, allele homoplasy, inbreeding and self-fertilization, selection, population substructure and aneuploidy), but they have yet to be adequately explained (Wei et al., Reference Wei, Wood and Gardner2013).
Self-fertilization during spawning constitutes a phenomenon closely related to inbreeding, which could explain heterozygote deficiencies, and it has been noted in several aquatic invertebrates, including clam shrimp (Chasnov, Reference Chasnov2010), scallops (Martinez et al., Reference Martinez, Mettifogo, Perez and Callejas2007) and clams (Kurihara, Reference Kurihara, Fuseya, Katoh and Inoue2010). In mussels, hermaphroditism has been reported at very low prevalences, although it is likely to be increased when they are exposed to toxic chemicals (Ortiz-Zarragoitia & Cajaraville, Reference Ortiz-Zarragoitia and Cajaraville2010). Nevertheless, this seems to be the least possible scenario in Mytilus, where effective population sizes are large enough to prevent inbreeding (Hoarau et al., Reference Hoarau, Boon, Jongma, Ferber, Palsson, Van Der Veer, Rijnsdorp, Stam and Olsen2005). Moreover, the selfing rates at species level, as revealed by the maximum likelihood estimation of S (RMES, David et al., Reference David, Pujol, Viard, Castella and Goudet2007), were not significantly different from zero (S = 0.043) indicating that there was no evidence for self-fertilization in the M. galloprovincialis populations studied. The hypothesis that introgression may be responsible for the observed deviations from Hardy–Weinberg expectations also receives little support since there was no evidence of introgressive hybridization among the analysed M. galloprovincialis samples and other Mytilus species.
In theory, microsatellite loci are generally considered selectively neutral. Sometimes however, they do not act singularly but are linked to genes networks, and hence may be affected by selective pressure (Rhode et al., Reference Rhode, Vervalle, Bester-van der Merwe and Roodt-Wilding2013). In such cases selection may affect the genetic structure of polymorphism at specific loci causing heterogeneity among loci, with high levels of differentiation at some and low or none at others (Launey et al., Reference Launey, Ledu, Bourdy, Bonhomme and Naciri-Graven2002). However, the similar FST estimates of the polymorphic loci (data not shown) coupled with simulation results in ARLEQUIN 3.5 where only locus Mgμ3 appear to be a candidate for balancing selection (P < 10−5), suggest that the loci used were acting as selectively neutral markers and therefore selection is unlikely to be the main cause of the heterozygote deficiency observed in this study.
Mytilus species have a spawning period that may reach up to six months exhibiting excellent survival capability to various environmental conditions in this phase, whereas females are able to produce up to 40 million eggs individually (Gosling, Reference Gosling2003). Furthermore, they show a high dispersal capability during pelagic larvae stage. Consequently, even though an overall Wahlund effect (including all populations) could be probably ruled out as overall FST (0.024) is much lower than mean Fis (0.207), a cryptic subpopulation admixture generated by pooling populations from large marine areas might explain the HWE departures and heterozygote deficits in bivalves of the genus Mytilus (see Diz & Presa, Reference Diz and Presa2008; Addison et al., Reference Addison, Ort, Mesa and Pogson2008).
Regarding null alleles, they are nearly always mentioned as a potential explanation for the occurrence of heterozygote deficits in microsatellite (e.g. Carlsson et al., Reference Carlsson2008; Polato et al., 2010). However, as stated earlier, in most loci examined in this study, significant deficits remained after the correction for null alleles, suggesting that null alleles are only partially responsible for these observations.
The high incidences of aneuploidy phenomena in bivalves, mainly in oysters and veneroids (Teixeira de Sousa et al., Reference Teixeira de Sousa, Joaquim, Matias, Ben-Hamadou and Leitao2012) lead us to suggest that aneuploidy could also contribute to the observed heterozygote deficiencies of mussels although further studies toward this direction are clearly needed to clarify the prevalence of this phenomenon in mussels.
Lastly, although stuttering and allelic dropout were statistically ruled out and a correction procedure for null alleles took place, there is still a noteworthy potential artefact at microsatellites: mispairing of repeated units during DNA replication due to high levels of polymorphism could potentially generate allelic size homoplasies (Culver et al., Reference Culver, Menotti-Reymond and O'Brien2001), responsible for erroneous overestimation of homozygotes and subsequently for the observed heterozygote deficiency.
Spatial patterns and genetic structure of populations
Microsatellite analysis revealed that although most variation was attributed to within populations' variance (Table 4), significant genetic differentiation among all populations was present. However, this genetic divergence, as indicated by exact tests and pairwise FST estimates, was mostly caused by the strong genetic heterogeneity of the samples from the Adriatic and the Sea of Marmara (Table 3; Figures 2, 3), whereas regarding the region of Aegean Sea, neither global FST or ΦST, nor pairwise tests revealed any genetic differentiation. Our study differs from previous population genetic studies of M. galloprovincialis that propose a restricted dispersal ability of mussels around north Greek coasts (Karakousis & Skibinski, Reference Karakousis and Skibinski1992; Kravva et al., Reference Kravva, Staikou and Triantaphyllidis2000) and the existence of significant genetic structuring among Aegean populations (Giantsis et al., Reference Giantsis, Kravva and Apostolidis2012). However, these discrepancies could potentially be caused by several factors, such as the resolving power of the markers used to detect patterns of population differentiation. On the other hand, the results confirm and extend those of Ladoukakis et al. (Reference Ladoukakis, Saavedra, Magoulas and Zouros2002) who, based on mtDNA analyses, found that M. galloprovincialis populations from the Aegean Sea form a homogeneous collection and are differentiated from those of the Black and Adriatic Seas. The complete lack of genetic differentiation among the Aegean populations suggests that mussels from the Aegean Sea are either at or close to panmixia. This was also evidenced by the second AMOVA, considering only Aegean populations, which revealed that less of 0.5% of the total variation detected was attributed among populations (Table 4).
Mytilus galloprovincialis is not the only marine species whose populations display genetic homogenization in the Aegean Sea. For instance, a mtDNA-RFLP analysis of European lobster (Homarus gammarus) populations found homogeneity among Aegean populations and suggested that the Aegean may act as a metapopulation for European lobster, in which these samples represent a dynamic system of sub-populations that are linked by gene flow, and with individual sub-populations becoming extinct and being recolonized (Triantafyllidis et al., Reference Triantafyllidis, Apostolidis, Katsares, Kelly, Mercer, Hughes, Jorstad, Tsolou, Hynes and Triantaphyllidis2005). However the panmictic model that has been observed in M. galloprovincialis populations from the Aegean Sea and the Ionian Sea correspondingly, does not represent a kind of metapopulation but can be attributed mainly to the species' inherent ability to disperse over long distances through its planktonic larval phase. Indeed, widespread marine organisms with pelagic larval dispersal usually show little, if any, genetic differentiation, due to the absence of natural or artificial barriers that could impede their larval dispersal, resulting in low levels of interpopulation genetic variability. In particular, with regards to marine mussels, several studies have demonstrated genetic homogenization or panmixia among populations within broad geographic areas such as on the Californian coasts and the Galician Rias (Addison et al., Reference Addison, Ort, Mesa and Pogson2008; Diz & Presa Reference Diz and Presa2009, respectively). However, in addition to species high dispersal ability, anthropogenic interferences, that is, unrecorded transplantations of spat for aquaculture purposes and, to a lesser degree, accidental transfer with the ballast waters of ships, may have also played a role in shaping the patterns of genetic homogeneity among the Greek populations, as well as among the two Italian samples.
In the process of mussel culture, mussel seed (juveniles) is collected from traps or collector ropes and transferred to other areas for growing (Kijewski et al., Reference Kijewski, Smietanka, Zbawicka, Gosling, Hummel and Wenne2011). In particular, as it concerns Mytilus, transplantations seem to have influenced the genetic composition of several native mussel populations, such as those along northern Chilean (Toro et al., Reference Toro, Ojeda and Vergara2004) and north-western European coasts (Kijewski et al., Reference Kijewski, Smietanka, Zbawicka, Gosling, Hummel and Wenne2011). Correspondingly, the past three decades when mussel culture has spread widely in Greece, spat from Chalastra (Thermaikos Gulf, Figure 1) has been transferred to most mussel farms around Greece, and these transplantations may have affected the genetic structure of wild (naturally occurring) local populations and hence contributed to the genetic homogeneity among Greek populations, overcoming, for example, the physical barriers that prevent mass gene flow between the Aegean and Ionian basins. This hypothesis would be further reinforced if there were observed populations from southern Greece, an area where the mussel culture has not yet developed, that were different from both Aegean and Ionian ones. However, since no such population was found, nor is there any certainty about the annual numbers of mussels moved around the country or the duration and frequency of these transfers, it is very difficult to support this scenario with confidence. Similarly, to explain the observed genetic homogeneity between the two distant Italian populations (shoreline >3000 km, Figure 1), further analyses including populations from several locations around the Italian coasts are needed.
On the other hand, there are cases where gene flow among marine organisms can be constrained by biological, physical and ecological factors (Borrero-Perez et al., 2011; Sanna et al., Reference Sanna, Cossu, Dedola, Scarpa, Maltagliati, Castelli, Franzoi, Lai, Cristo, Curini-Galletti, Francalacci and Casu2013). The Mediterranean biogeographical boundaries play a significant role in shaping the genetic structuring in marine species (Sanna et al., Reference Sanna, Cossu, Dedola, Scarpa, Maltagliati, Castelli, Franzoi, Lai, Cristo, Curini-Galletti, Francalacci and Casu2013). Particularly the region of the Aegean Sea (eastern Mediterranean) is of special interest, as a number of studies have revealed the existence of a genetic break or limitation to larval dispersal between the Aegean populations and those in other basins (Ladoukakis et al., Reference Ladoukakis, Saavedra, Magoulas and Zouros2002; Nikula & Väinölä, Reference Nikula and Väinölä2003; Borrero-Pérez et al., Reference Borrero-Pérez, González-Wangüemert, Marcos and Pérez-Ruzafa2011), and the existence of natural frontiers that may prevent the invasion of non-native species (Panucci-Papadopoulou et al., Reference Panucci-Papadopoulou, Raitsos and Corsini-Foka2012). Such an example may be the population from the Sea of Marmara (Canakkale) which appears significantly differentiated from most Aegean populations (Table 3). The outflow of low salinity waters from the Dardanelles into the Aegean (Olson et al., Reference Olson, Kourafalou, Johns, Samuels and Veneziani2007) in combination with the narrow width (1.2–6 km) probably forms a physical barrier preventing gene flow from the Aegean towards the Sea of Marmara. Likewise the topographic and oceanographic conditions prevailing on the Dalmatian coasts may form physical barriers inhibiting larval dispersal and thus promoting the significant differentiation of the Croatian sample from all the other samples, including that of Ravenna situated at the opposite side of the Adriatic (Table 4; Figure 1). Indeed, the bay of Zadar is surrounded by a complex of longish islands, which stand in the way of direct contact of the bay with the open sea. The region comprises several distinct marine habitats such as karst marine lakes and submerged caves and pits (Radović et al., Reference Radović, Čivić, Topić and Vukelić2009). Moreover the sea currents of the two Adriatic sides are different as they flow in a cyclonic circulation, with those of the Italian coasts flowing southwards far away from the Croatian coast (Mantziafou & Lascaratos, Reference Mantziafou and Lascaratos2004).
In conclusion, the current research presents a first attempt to investigate the genetic structure of Mytilus galloprovincialis mussels throughout the coasts of the central–eastern Mediterranean Sea using microsatellite markers. The results indicate broad patterns of genetic homogeneity between Greek populations, as well as between the two Italian ones, and the differentiation of those from Turkey and Croatia. However, to elucidate the processes that led to the observed patterns of genetic structure and to ensure the sustainability of populations of the species, further research will be required, including key locations throughout the Mediterranean Sea and strategies to deal with human transplantations.
ACKNOWLEDGEMENTS
The authors are grateful to Drs Gloria Isani and Emilio Carpenè for their kind hospitality in the Department of Veterinary Medical Science, University of Bologna. We are also indebted to Dr Natalija Topic Popovic for her valuable help in collection of the Croatian samples.
FINANCIAL SUPPORT
This research received no specific grant from any funding agency, commercial or not-for-profit sectors.