The prevalence of childhood overweight and obesity has been growing rapidly worldwide in the last few years.Reference Swinburn, Sacks and Hall 1 , Reference Wang and Lobstein 2 Hypertension can be a consequence of overweight that is already manifested in youth.Reference Freedman, Katzmarzyk, Dietz, Srinivasan and Berenson 3 , Reference Berenson 4 The relationship between obesity and arterial hypertension is well established both in children and in adults.Reference Kotsis, Stabouli, Papakatsika, Rizos and Parati 5 It is estimated that the increase in childhood obesity will result in increased rates of cardiovascular disease among future young and middle-aged adults, by 2020, resulting in substantial morbidity and mortality.Reference Bibbins-Domingo, Coxson, Pletcher, Lightwood and Goldman 6
The National Health and Nutrition Examination Survey in 2004 in the United States showed that overall blood pressure levels in United States children and adolescents have increased over the past decade: systolic blood pressure was found to be 1.4 millimetres of mercury higher in 1999–2000 compared with 1988–1994 and diastolic blood pressure was found to be 3.3 millimetres of mercury higher.Reference Muntner, He, Cutler, Wildman and Whelton 7 In 2007, a review of blood pressure data in 8- to 17-year-old children from the National Health and Nutrition Examination Survey conducted in the United States from 1963 to 2002 clearly demonstrates an increase in the prevalence of high blood pressure in children,Reference Din-Dzietham, Liu, Bielo and Shamsa 8 countering Chiolero et alReference Chiolero, Bovet, Paradis and Paccaud 9 suggestions that the prevalence of childhood hypertension has remained stable over time. The increase in childhood obesity and cardiovascular comorbidities is observed in several European countries as well, including Germany, Austria, Switzerland, Spain, and Italy.Reference Flechtner-Mors, Thamm and Wiegand 10 – Reference Pileggi, Carbone, Nobile and Pavia 12 In Romania, a study carried out in 1989 on 7917 school-aged children showed a prevalence of elevated blood pressure at 11%, but no relation to body mass index was mentioned.Reference Ivan, Duda and Groll 13
Aims
The aims of this study were to describe the current prevalence of paediatric hypertension and the relationships between body mass index, gender, place of residence, and blood pressure in a population of school-aged children from western Romania.
Material and method
Demographics
Timis is the largest county in western Romania with an area of 8697 square kilometres. We randomly chose 5 urban schools and 10 rural schools to collect data for this study. A total of 3626 children aged 7–18 years were examined by medical students in the period February, 2010–June, 2011. Before each data collection round, all examiners were trained in taking accurate measurements, according to international measurement techniques.Reference de Onis, Onyango, Borghi, Garza and Yang 14 Each child underwent anthropometric assessments that were carried out during 1-day session. Height and body mass was obtained using calibrated scales. The subjects wore normal, light, indoor clothing without shoes. All anthropometric measurements were taken in the mornings. The age of children was rounded down when child's age was years and 1–6 months and rounded up when the age was years and 7–12 months (for example, when the child was 7 years and 6 months, the age was rounded down to 7 years, while, if the child was 7 years and 7 months, the age was rounded up to 8 years).
Definitions
Body mass index was calculated as weight (kilograms)/height square metres. Children were considered overweight or obese on the basis of age-specific body mass index reference guidelines from Centers for Disease Control and Prevention Child Growth Standards 2000. 15 Overweight is defined as a body mass index at or above the 85th percentile and lower than the 95th percentile for children of the same age and sex. Obesity is defined as a body mass index at or above the 95th percentile for children of the same age and sex. Underweight is defined as a body mass index at or below the 5th percentile for children of the same age and sex. We chose to use the Centers for Disease Control and Prevention growth charts because the reference for blood pressure published by the Fourth Report also uses Centers for Disease Control and Prevention for height percentiles reference.
Blood pressure measurement methods
Blood pressure measurements were taken by the auscultation method while the child was at rest in a comfortable sitting position, with the right arm exposed and resting at the level of the heart. A paediatric aneroid sphygmomanometer was used with the appropriate cuff size, selected with a width that covered at least 40% of the arm circumference at a point midway between the olecranon and the acromion. 16 , Reference Clark, Lieh-Lai, Sarnaik and Mattoo 17 The arm circumference was measured with a flexible measuring tape. The sphygmomanometer cuff length was at least 80%, up to 100% of arm circumference. We used three cuff sizes: for arm circumference between 14 and 21.5 centimetres, the cuff had a width of 5.5 centimetres and a length of 15 centimetres; for arm circumference between 20.5 and 28.5 centimetres, the cuff had a width of 10.6 centimetres and a length of 24 centimetres; and for arm circumference between 27.5 and 36 centimetres, the cuff had a width of 13.5 centimetres and a length of 30 centimetres. The cuff was inflated to about 20 millimetres of mercury above the point at which the radial pulse disappeared. The onset of sound (Korotkof phase I) was indicative of systolic pressure, and the disappearance of sound (Korotkof phase V) was taken as indicative of diastolic pressure. For each child, three measurements were recorded with an interval at least 5 minutes apart. The mean of these three readings was used for the final data analysis. All efforts were made to minimise factors that might affect blood pressure, such as anxiety, fear, stress, crying, laughing, and recent activity.
For defining elevated blood pressure in children, we used the standards published in the Fourth Report on the Diagnosis, Evaluation, and Treatment of High Blood Pressure in Children and Adolescents. 16 The report supplies tables of blood pressure percentiles based on the database created by the Pediatric Task Force, consisting of 63,227 children.
Pre-hypertension in children is defined as average systolic blood pressure or diastolic blood pressure levels that are greater than or equal to the 90th percentile, but less than the 95th percentile. Hypertension is defined as average systolic blood pressure and/or diastolic blood pressure that is greater than or equal to the 95th percentile for sex, age, and height on three or more occasions. Stage 1 hypertension is the designation for blood pressure levels that range from the 95th percentile to 5 millimetres of mercury above the 99th percentile. Stage 2 hypertension is the designation for blood pressure levels that are higher than 5 millimetres of mercury above the 99th percentile. Further, we will consider the child to have hypertension if she/he has stage 1 or 2 hypertension; pre-hypertension is discussed as a separate entity.
Ethical considerations
Owing to the non-invasive nature of the protocol consisting only of measurements that are a routine for school examinations – height, weight, and blood pressure – we used a “passive consent” or “opt-out” method. Parents were fully informed about all study procedures through a school information meeting. Parents who refused the participation communicated this to the school principal. Before the measurement, the child was also asked whether she/he agrees with it. The children's names were not included in the electronic data files. Examiners ensured the basic principles of confidentiality, privacy, and objectivity throughout the process. The children were measured in a private room, boys and girls separately. The approval of the University's Ethical Advisory Commission is in accordance with the Helsinki Declaration.
Statistical analysis
For calculating the exact percentiles of body mass index, height, and blood pressure for each child, we used the commercial software: EZ BMI Calculator – Deluxe. 15 The software uses as references for growth data from the Centers for Disease Control and Prevention 2000, and for blood pressure reference data from the Fourth Report on the Diagnosis, Evaluation, and Treatment of High Blood Pressure in Children and Adolescents. 15 , 16 Data were further analysed using the SPSS, PC program (version 19.0 – SPSS Inc., United States). Descriptive statistics were run on all the variables and presented as percentages, means, and standard deviations. Statistical significance between continuous variables was assessed using unpaired Student's t-test, with p-values of less than 0.05 considered statistically significant. Simple linear regression analysis was used to determine the pair-wise association between continuous variables. Odds ratio was calculated by binomial regression.
Results
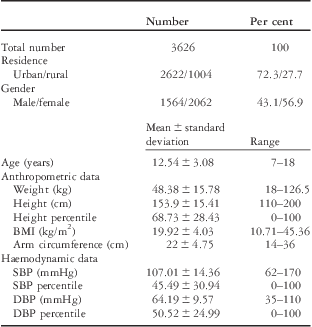
We excluded from the database 86 children who were older than 18 years or younger than 7 years. A total of 3626 children aged 7–18 years were examined in the period February, 2010–June, 2011. The study population consisted of 2727 children in Timisoara and 1004 children in rural surroundings. The study evaluated 1564 boys (43.1%) and 2062 girls (56.9%), with a male/female ratio of 1:1.31. Demographic, anthropometric, and haemodynamic variables of the school-aged children are shown in Table 1.
Demographic, anthropometric, and haemodynamic variables of children.

BMI = body mass index; DBP = diastolic blood pressure; SBP = systolic blood pressure
Prevalence of overweight and obesity
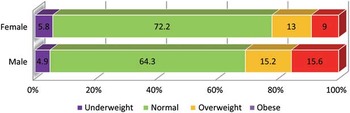
Overall, the prevalence of overweight – body mass index more than 85th percentile and less than 95th percentile – was 14%. Boys had a higher prevalence of overweight than girls (15.2% versus 13%; p-value equals 0.01). The prevalence of obesity – body mass index more than 95th percentile – was 11.8% higher for boys than for girls (15.6% versus 9%; p-value less than 0.001). Figure 1 depicts the prevalence of body mass index class in relation to gender. The prevalence of overweight and obesity was higher among rural versus urban residence (24.9% versus 27.9%; p-value equals 0.01).
Prevalence of BMI class in relation to gender, using CDC 2000 reference.

Prevalence of arterial hypertension
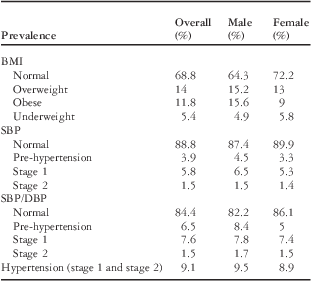
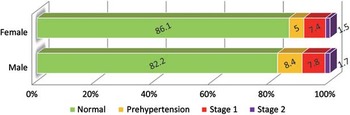
With regard to arm circumference, 99% of the children had an arm circumference between 14 and 36 centimetres; 13 children who were outside this range were excluded from statistical evaluation. In all, 44.2% of children had an arm circumference between 14 and 21.5 centimetres, 49.9% had an arm circumference between 21.5 and 28.5 centimetres, whereas 5.7% had arm circumference between 27.5 and 36 centimetres. The overall results of the screening for elevated blood pressure are shown schematically in Table 2. The prevalence of hypertension (stage 1 and stage 2) on our screening was 9.1% (9.5% in boys and 8.9% in girls; p-value equals 0.003). Overall, 6.5% of the children (8.4% of boys and 5% of girls) had pre-hypertension. Figure 2 shows the prevalence of blood pressure class in relation to gender, using the Fourth Report reference. In all, 17.4% children in urban residence and 11.1% (p-value equals 0.01) in rural residence presented either pre-hypertension or stage 1 and 2 hypertension. With regard to body mass index, Table 4 shows that 21.1% of obese, 12.8% of overweight, 7.1% of normal weight children, and 3.1% of underweight children presented hypertension (stage 1 and stage 2).
Results of the screening for elevated blood pressure.

BMI = body mass index; DBP = diastolic blood pressure; SBP = systolic blood pressure
Prevalence of blood pressure class in relation to gender, using the Forth Report reference.

Prevalence of hypertension class with regard to BMI class and gender (male, female prevalence).

BMI = body mass index
Relationships between body mass index, gender, place of residence, and blood pressure
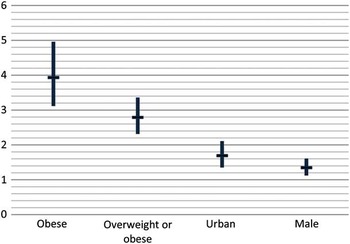
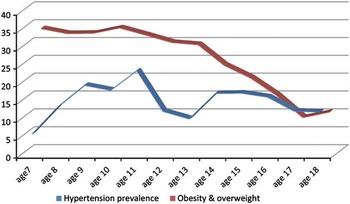
The odds ratio for hypertension was determined for all variables found to be associated with hypertension at screening by univariate analysis (Table 3). The strongest determinant of hypertension was body mass index percentile. Significant odds ratio was found for obesity (3.93; confidence interval: 3.11–4.95), urban residence (1.68; confidence interval: 1.35–2.1), and male gender (1.34; confidence interval: 1.12–1.6). Graphic schematisation for comparing odds ratio is shown in Figure 3. Age was not a determinant for hypertension. Figure 4 shows that prevalence trends of overweight and obesity when compared with those of elevated blood pressure have no correlation – pre-hypertension and hypertension taken together.
Univariate analysis of elevated blood pressure determined for certain variables.

φ is a measure of association based on χ2 that controls for sample size. φ can range from 0 to +1
Odds ratio for hypertension in relation to BMI, residence and gender.

Prevalence trends of overweight and obesity compared to trends for elevated blood pressure.

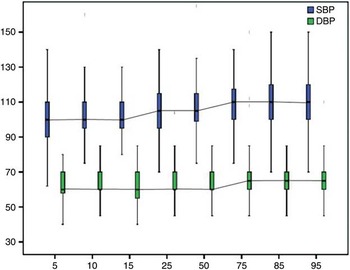
Exact body mass index percentiles were calculated for each student. Body mass index percentile categories of less than 5th, 10th, 25th, 50th, 75th, 90th, and more than 95th were generated by rounding the exact body mass index percentile to the nearest categorical threshold. The relationship of systolic blood pressure and diastolic blood pressure to body mass index percentile was determined for the range of categorical body mass index percentiles. Systolic blood pressure showed a progressive increase with each increase in body mass index percentile category, whereas diastolic blood pressure did not (shown in Fig 5).
Average SBP and DBP for each BMI percentile category.

Discussions
Prevalence of overweight, obesity, and hypertension
Childhood obesity is increasing worldwide, reaching epidemic proportionsReference Swinburn, Sacks and Hall 1 , Reference Wang and Lobstein 2 in both developed and developing countries.Reference de Onis and Blössner 18 To the best of our knowledge, to date, no published data are available regarding the prevalence rates of overweight and obesity for Romanian schoolchildren. Our data show a worrisome prevalence of overweight and obesity in school-aged children in western Romania. The results are relatively similar to those in neighbouring countries such as Hungary and Serbia.Reference Kovács, Gábor, Fajcsák and Martos 19 , Reference Kisić-Tepavcević, Jovanović and Kisić 20 Overall, overweight and obesity in school-aged children in western Romania was 25.8% (using Centers for Disease Control and Prevention growth reference), whereas 19.1% in Hungary (using International Obesity Task Force reference) and 30.7% in Serbia (using International Obesity Task Force reference). In Italy, the overall prevalence is 27.2% (Centers for Disease Control and Prevention).Reference Cacciari, Milani and Balsamo 21 Both overweight and obesity were significantly higher in boys than in girls and these findings are in concordance with other studies in the region.Reference Mészáros, Mészáros and Völgyi 22
Surprisingly, we found a higher prevalence of overweight and obesity in rural areas when compared with urban areas. Several studies looked at factors contributing to higher prevalence of obesity in rural areas.Reference Lutfiyya, Lipsky, Wisdom-Behounek and Inpanbutr-Martinkus 23 , Reference Reed, Patterson and Wasserman 24 Weight problems in rural communities could be explained by the evolvement of farming methods, by the lack of physical activity due to socio-economic status, limitation of recreational facilities, less commitment time available for parents and children, and high cost of activities. On the other hand, the availability of cheap, high-density energy foods, in rural areas, could also be an important cause for the higher prevalence of obesity. Further studies are needed in order to determine the exact causes of this issue for Romanian socio-economic and cultural setting.
The prevalence of obesity in children is influenced greatly by the growth reference used. There are three sets of growth references commonly used to assess a child's weight status and health risk: BMI cut-points published by the US Centre for Disease Control and Prevention, the International Obesity Task Force, and those published by the World Health Organization. Inconsistent prevalence estimates of childhood overweight and obesity based on variant growth references pose a challenge in defining the burden of childhood obesity at a population level.Reference Twells and Newhook 25 National growth references are ethically and geographically specific and thus provide the most appropriate results in a clinical setting; however, in research, they cannot be compared with other international studies because of different methodology. The same issue of using international versus national references for blood pressure remains. Several authors have underlined that when using the Fourth Report reference the prevalence of hypertension is often overestimated.Reference Marras, Bassareo and Ruscazio 26 , Reference Sinha and Reid 27 Ideally, Romanian blood pressure references would have resulted in specific ethnic and geographical data regarding prevalence of hypertension in children, but unfortunately, to date, paediatric Romanian national blood pressure references do not exist.
Historically, the reported prevalence of paediatric hypertension in RomaniaReference Ivan, Duda and Groll 13 back in 1989 was 11%, but is greatly dependent on the way in which hypertension is defined, and on whether pre-hypertension is included. However, no recent studies have performed a screening for hypertension following the Fourth Report guidelines.
We chose to refer to hypertension as stage 1 and 2 and referred to pre-hypertension separately, in order to avoid overestimation of hypertension by inclusion of pre-hypertension in this category. In the current study, the overall prevalence of hypertension was 9.1%, which is consistent with findings of other studies.Reference Muntner, He, Cutler, Wildman and Whelton 7 , Reference Ogden, Flegal, Carroll and Johnson 28 Nevertheless, our study reported a higher prevalence of hypertension in normal weight children compared with data from the Sorof 2004 study (7.1% – our study; 2.6% – Sorof).Reference Sorof, Lai, Turner, Poffenbarger and Portman 29 This is most likely due to the fact that our results came from one screening, whereas Sorof rescreened three times and showed that the prevalence decreased with each screening from 19%, to 9.5%, to 4.5%.
Relationships between body mass index, gender, place of residence, and blood pressure
Hypertension was significantly more prevalent in boys than in girls, and higher in urban compared with rural areas. Our results clearly show a correlation between increased body mass index and hypertension. Almost 1 in 10 children with normal weight had high blood pressure, whereas for overweight and obesity we observed a two- and threefold increase, respectively, in the incidence of hypertension. We delimited body mass index percentile categories; Figure 5 presents mean and standard deviation for the average systolic blood pressure and diastolic blood pressure for each body mass index percentile category. The graph clearly shows the progressive increase of systolic blood pressure with each increase in body mass index percentile category. In addition, these results underline the fact that the classification in “overweight” and “obesity” is, in fact, rather arbitrary and does not reflect properly the cardiovascular risk that is continuous with each increase in body mass index percentile. Both overweight and obese children have a significantly high risk for elevated blood pressure and should be the target for preventive interventions. Prevention is particularly important with regard to the possibility that the current generation of children may be the first to have shorter life expectancies than their parents.Reference Olshansky, Passaro and Hershow 30
Taking into account the significantly increased odds ratio values for overweight and obesity, male gender, and urban residence, these clearly are major contributing factors for the overall higher prevalence of hypertension found in the current study.
Limitations
Our study has a number of limitations. We used the Fourth Report references to define hypertension in children. This could lead to overdiagnosis of hypertension as mentioned in the “Discussion” section.Reference Marras, Bassareo and Ruscazio 26 , Reference Sinha and Reid 27 Apart from body mass, other risk factors for cardiovascular disease that were not assessed in this study, such as dyslipidemia, insulin resistance, type II diabetes mellitus, microalbuminuria, left ventricular hypertrophy, or pulmonary hypertension due to obstructive sleep apnoea, could also be highly prevalent in this population.
All blood pressure measurements were taken with paediatric aneroid sphygmomanometer, the accuracy of which is determined primarily by observer technique. We used a single observer, which may be a source of bias. We have not evaluated or adjusted for factors such as physical activity, diet, and salt intake. These areas are open for further research.
Hypertension must be confirmed on repeated visits before characterising a child as having hypertension.Reference Sorof, Lai, Turner, Poffenbarger and Portman 29 Confirming an elevated blood pressure measurement is important, because blood pressure at high levels tends to fall on subsequent measurement as a result of an accommodation effect – reduction of anxiety by the patient from one visit to the next – and regression to the mean. 16
Conclusions
The current study confirms a worrisome prevalence of overweight and obesity among children in western Romania, accompanied by an alarming cardiovascular risk, shown by increased prevalence of hypertension. Confirmation of the findings observed in the current study was needed for Romanian population. Overweight and obesity, male gender, and urban residence were the major contributing factors for the overall high prevalence of hypertension found. Other factors that result in higher blood pressure levels among children also need to be identified. In addition, our results point to the urgent need to adopt strategies aimed at preventing hypertension in children that include prevention of overweight, weight loss, increased physical activity, and dietary modification, started early in the child's life. Such interventions could have a profoundly positive impact on the prevalence of high blood pressure in children and thus on the enormous burden of cardiovascular diseases in adults from Romania.
Acknowledgements
Measurements were recorded by medical students and volunteers of “Save the Children”; the coordinators were Iulia Jurca-Simina, Ioana Alina Moaca, and Laura Leahu. The authorisation for implementing this study was obtained from the Timis Learning Inspectorate. Body mass index and blood pressure were calculated using the EZ BMI Software. The authors declare no conflict of interest.