


Introduction
How much do citizens rely on elite cues to form opinions on contested policy in the European Union (EU)? Although cue-taking is well-documented within U.S. partisan politics (Bullock Reference Bullock2011; Cohen Reference Cohen2003; Nicholson Reference Nicholson2011; Tesler Reference Tesler2017), less is known about how such messenger effects unfold in the complexity of the EU’s multilevel governance system. Here, competing institutional actors, such as national governments and the European Commission, often serve as salient policy advocates within the public sphere. During this process, individuals are exposed to a broader and potentially competing array of messages from a diverse set of political actors.
Climate policy debates provide a particularly suitable case study for investigating the interplay between the message (policy content) and the messenger (communication source). A notable example is the plan to phase out the sale of new combustion-engine vehicles after 2035 (European Commission 2022). While the European Commission initially advocated for a stricter ban, the proposal received substantial public pushback from carmakers and national-level Member State governments (e.g., Germany, Poland, Italy), resulting in a final compromise regulation that included exemptions for cars running on climate-neutral synthetic fuels (Normand Reference Normand2023). Yet, this contest is far from over, with Italy and other EU member states calling on EU institutions to reconsider the ban on combustion-engine vehicles (Hodgson and Genovese Reference Hodgson and Genovese2024).
Because legislative authority over climate policy is shared, people frequently encounter policy message cues from both national governments and EU institutions. Sometimes, these signals align, but they often also pull in different directions, creating disagreement about who is credible for developing policy and who is responsible for the results in the end (Heinkelmann-Wild et al. Reference Heinkelmann-Wild, Zangl, Rittberger and Kriegmair2023; Schlipphak and Treib Reference Schlipphak and Treib2017). We leverage this multilevel EU context by comparing identical messages attributed to each level and examining how the messenger alone shifts support, asking: When citizens receive mixed signals from EU and national-level actors about contentious policies, which matters more to public opinion: the message or the messenger?
In this paper, we investigate how people evaluate carbon taxation proposals, depending on variations in the policy sector (car, aviation, or heating fuels), the tax rate (10%, 50%, or 100%), and the supporting institution (national government, foreign government, or European Commission). From a dual-process theory perspective (Chaiken et al. Reference Chaiken, Liberman and Eagly1989; Kam Reference Kam2005; Lupia Reference Lupia1994), we expect individuals to rely on both content-based (systematic processing) and source-based (heuristic processing) considerations. For content-based considerations, we anticipate that higher tax rates will have a stronger negative effect on policy support, particularly among those most likely to be personally negatively affected by the proposals (Barber and Pope Reference Barber and Pope2024; Beiser-McGrath and Bernauer Reference Beiser-McGrath and Bernauer2019; Carattini et al. Reference Carattini, Baranzini, Thalmann, Varone and Vöhringer2017; Klenert et al. Reference Klenert, Mattauch, Combet, Edenhofer, Hepburn, Rafaty and Stern2018). Instead, for messenger-based effects, we expect that people’s responses to institutional cues depend on the respondent-source association. Trust in the institution, the strength of national identity, and eurosceptic attitudes are expected to determine whether institutional endorsements from national or EU-level institutions function as a positive shortcut cue or can trigger backlash (Bolsen et al. Reference Bolsen, Palm and Kingsland2019; Fairbrother Reference Fairbrother2022; Kahan Reference Kahan2015; Kahan Reference Kahan2017). Crucially, in addition to studying both content- and source-effects independently, we contribute to recent research by further examining their interplay, as “it is impossible to communicate a policy message in the real world without also sending source cues” (Diamond and Zhou Reference Diamond and Zhou2022, p. 993). Accordingly, we evaluate three guiding research questions:
RQ1: How does the institutional source publicly promoting the policy affect citizens’ preferences for carbon taxation?
RQ2: How does the tax rate affect citizens’ preferences for carbon taxation?
RQ3: What is the interrelation between the effects of policy content and the communicating messenger source?
We address these research questions using evidence from a pre-registered survey-embedded vignette experiment conducted in Germany (N = 1597) and Poland (N = 1595), fielded in Summer 2024. More specifically, we test the direct and combined effects of the message (content) and the messenger (source) on citizens’ preferences by presenting policy vignettes on carbon taxation in the EU. The policy proposals vary randomly in their tax rates (10%, 50%, or 100%), fuel types (car, aviation, and heating), and sources of support (national government, foreign government, and European Commission).
Our study yields three key insights. First, we observe strong message effects: increasing tax rates significantly reduces support, especially among individuals most likely to be affected by tax increases (e.g., people who own a combustion-engine vehicle, have flown at least once in 2023, or use fossil fuels to heat their homes). Second, we find strong messenger effects based on trust, meaning that individuals are more likely to support a policy proposal if they trust the supporting source. However, contrary to our theoretical expectations, we find that citizens with a strong national identity and pronounced euroscepticism are less likely to support these policies, regardless of which institution supports the policy. This finding suggests a general resistance towards carbon taxation, rather than a cue-based differentiation. Lastly, messenger cues are not found to dampen the negative effect of increasing the tax rates. On the contrary, in some cases, support among trusting and pro-European individuals declines more sharply if tax rates increase. In short, while trust in the source leads to overall increased support levels, the capacity of cue-taking to shield respondents from cost sensitivity is limited.
The paper is structured as follows: We first review the key mechanisms raised in the messenger effects literature. Then, we outline the theoretical framework for carbon taxation in the EU, emphasizing the importance of trust, national identity, and euroscepticism. Next, we lay out the experimental research design and discuss the findings. Lastly, we conclude by discussing the results in light of previous research, emphasizing the importance of the message-messenger interplay and outlining key policy implications for the ongoing climate policy debate.
Theory
The role of messengers in shaping policy preferences
People’s policy preferences are jointly shaped by their individual characteristics (socio-demographics, political orientation, knowledge, beliefs, attitudes) and their perceptions of the effectiveness and fairness of policy design attributes (Bergquist et al. Reference Bergquist, Nilsson, Harring and Jagers2022; Dechezleprêtre et al. Reference Dechezleprêtre, Fabre, Kruse, Planterose, Sanchez Chico and Stantcheva2025; Drews and Van Den Bergh Reference Drews and Van Den Bergh2016). However, preferences are not always fixed or internally consistent. Rather, external factors, such as information and communication strategies, have been found to influence how people perceive policy options (Drews and Van Den Bergh Reference Drews and Van Den Bergh2016; Goldberg et al. Reference Goldberg, Gustafson, Ballew, Rosenthal and Leiserowitz2021; Li and Su Reference Li and Su2018).
Dual-process theories of attitude change highlight how messages and communication strategies can be processed systematically or heuristically (Kam Reference Kam2005). Individuals often use information “shortcuts” to form preferences, as these require less cognitive effort compared to acquiring a deep understanding of complex issues (Lupia Reference Lupia1994). Messenger cues often serve as prominent shortcuts, in which individuals process policy-relevant information not only on its content but also on its source. Here, visible social and political actors can serve as a messenger-based heuristic, enabling preference formation with minimal effort by providing shortcut cues (Arceneaux and Kolodny Reference Arceneaux and Kolodny2009; Chaiken et al. Reference Chaiken, Liberman and Eagly1989; McGuire Reference McGuire1969; Nicholson Reference Nicholson2011). A rich body of literature has demonstrated how such messenger effects, sometimes referred to as source or communicator effects (Hafner et al. Reference Hafner, Elmes and Read2019), substantially affect policy support (Bullock Reference Bullock2011; Cohen Reference Cohen2003; Malka and Lelkes Reference Malka and Lelkes2010). The key mechanism can be explained by the tendency for people to align their views with elites or groups they perceive as central to their social or political identity, a process described as “identity-protective cognition” (Kahan Reference Kahan2017). Most existing empirical studies have focused on the U.S. context, often testing the impact of policy endorsements by political parties or politicians (Cohen Reference Cohen2003; Nicholson Reference Nicholson2011; Tesler Reference Tesler2017).
The extent to which individuals rely on systematic versus heuristic processing can vary by person and situation. To be specific, the strength of messenger effects is shaped by a set of underlying mechanisms that we group into three broad categories: individual characteristics, message source, and context-specific policy features.
First, individual characteristics such as the strength of partisan social identity or expressive partisanship (Bankert et al. Reference Bankert, Huddy and Rosema2017; Mayer Reference Mayer2020) have been highlighted as key drivers of messenger effects (Bechtel et al. Reference Bechtel, Hainmueller, Hangartner and Helbling2015; Bullock Reference Bullock2011). The level of partisan identity has been shown to amplify motivated reasoning, aligning citizens’ interpretations of evidence with their political identities (Kahan Reference Kahan2017), and, in some cases, leading individuals to provide misinformation through expressive responding (Jerit and Zhao Reference Jerit and Zhao2020; Schaffner and Luks Reference Schaffner and Luks2018).
The second category of drivers of messenger effects comprises perceptions of the message source, namely the messenger’s perceived trustworthiness, credibility, competence, and likability. Seminal work by Lupia and McCubbins (Reference Lupia and McCubbins1998) highlights how trust and perception of knowledge are key requirements for persuasion to be effective. The essential role of trust and credibility has been documented in theoretical discussions and empirical tests of messenger effects (Bolsen et al. Reference Bolsen, Palm and Kingsland2019; Druckman Reference Druckman2001; Goren et al. Reference Goren, Federico and Kittilson2009).
Third, context-specific policy features include (i) personal policy knowledge and issue-importance, as well as (ii) societal policy salience and issue-based polarization. Greater policy knowledge and personal costs may reduce reliance on heuristics, as people have already processed information systematically in the past or are “more motivated to process the issue-relevant arguments presented” (Petty and Cacioppo Reference Petty, Cacioppo and Berkowitz1986, p. 146). While findings on the effect of policy knowledge and information are mixed (Boudreau and MacKenzie Reference Boudreau and MacKenzie2014; Ehret et al. Reference Ehret, Van Boven and Sherman2018), personal issue-importance has been demonstrated to dampen the influence of party cues, particularly when cues contradict partisan norms (Barber and Pope Reference Barber and Pope2024). The role of the policy’s societal context, such as salience and polarization, remains debated. On the one hand, studies on polarized issues reveal that polarization amplifies the influence of party endorsements while diminishing the influence of policy information (Druckman et al. Reference Druckman, Peterson and Slothuus2013; Gustafson et al. Reference Gustafson, Rosenthal, Ballew, Goldberg, Bergquist, Kotcher, Maibach and Leiserowitz2019). In contrast, studies on salience suggest that voters rely more on policy content for high-salience issues (Ciuk and Yost Reference Ciuk and Yost2016), even to the point of negatively evaluating party candidates affiliated with their own political party (Arceneaux Reference Arceneaux2008; Mummolo et al. Reference Mummolo, Peterson and Westwood2021). Yet, evidence also shows that policy content can shape preferences even in the context of low-salience issues. For instance, Treger (Reference Treger2022) finds that respondents attend to policy content in such cases, with the content influencing preferences similarly to, or even more than, party cues.
Messenger effects for carbon taxation in the EU
In this study, we extend existing research by examining messenger effects in EU climate policymaking, where both supranational sources (e.g., the European Commission) and national governments serve as potentially competing institutional sources of policy messages. While the majority of existing empirical tests have focused on party cues in the U.S. context, only a smaller set of studies has investigated non-party cues (Bolsen et al. Reference Bolsen, Palm and Kingsland2019; Diamond and Zhou Reference Diamond and Zhou2022; Rinscheid et al. Reference Rinscheid, Pianta and Weber2021) or messenger effects in contexts outside the United States (see for instance Bechtel et al. Reference Bechtel, Hainmueller, Hangartner and Helbling2015; Beiser-McGrath Reference Beiser-McGrath2023; Gabel and Scheve Reference Gabel and Scheve2007; Liu et al. Reference Liu, Qin and Zhang2023). It remains unclear how messenger effects operate in more complex political contexts.
Policymaking in the EU is a complex process, with most laws being proposed by the European Commission and co-decided by the EU Parliament and the Council of the European Union (Council of Ministers). This structure creates a distinctive arena for studying how messengers affect policy support, as stakeholders across levels of government (e.g., regional, national, supranational) advance sometimes complementary and sometimes competing policy views.
In multilevel EU politics, the impact of a messenger likely depends on both citizens’ trust in institutions and their view on the appropriate level of governmental authority. First, citizens often evaluate policy messages based on their relative trust in institutions: those who trust the domestic government more than the EU are more receptive to national messengers, and vice versa (Sánchez-Cuenca Reference Sánchez-Cuenca2000). Second, because rule-setting and implementation are shared across governance levels, citizens infer who should act. Messages from the level of government they see as most responsible for the issue are therefore more persuasive.
Taken together, identical policy content can be received differently by citizens who draw inferences about the competence and responsibility of each political institution. Accordingly, an otherwise identical message attributed to the European Commission or a national government may be evaluated differently because of not only who speaks but also what the citizen infers will own the consequences (Heinkelmann-Wild et al. Reference Heinkelmann-Wild, Zangl, Rittberger and Kriegmair2023; Schlipphak and Treib Reference Schlipphak and Treib2017).
Within this multilevel setting, citizens’ policy preferences depend on which institutions they perceive as competent and responsible. Specifically, we focus on three mechanisms: (i) institutional trust, how people assess the competence and integrity of political institutions; (ii) national identity, how strongly people identify with their nation and thus how credible they find domestic versus supranational actors; and (iii) euroscepticism, how likely people are to discount proposals attributed to EU institutions.
First, trust in the message source is critical to how the message itself is interpreted (Bolsen et al. Reference Bolsen, Palm and Kingsland2019; Lupia and McCubbins Reference Lupia and McCubbins1998), with notable prior empirical research focusing on how trust can shape support for tax instruments in climate policy (Devine et al. Reference Devine, Stoker and Jennings2024; Fairbrother Reference Fairbrother2016; Fairbrother Reference Fairbrother2022; Gomm et al. Reference Gomm, Huber, Kolcava, Smith and Bernauer2024). Further, an individual’s level of national identity and euroscepticism may shape messenger effects via identity-based mechanisms. Here, people are expected to align their attitudes and opinions with those of messenger sources they perceive as important parts of their social and political identity (Kahan Reference Kahan2015, Reference Kahan2017). Within the EU context, national governments may serve as credible or resonant sources for people who strongly identify with their nation-state. Conversely, when policies are attributed to foreign governments or supranational institutions, such as the European Commission, people with strong national identities might become resistant or distrustful of policy proposals. Similarly, for individuals with more eurosceptic attitudes, policies supported by the European Commission are likely to elicit heightened skepticism and reduced support. Based on these considerations, we propose the following hypotheses regarding the effect of messenger cues.
H1: The respondent-source association shapes policy support.
-
• H1a: Trusting the institution that acts as the messenger source can increase policy support.
-
• H1b: When the national government is the messenger source, people with stronger national identities will have increased levels of policy support.
-
• H1c: When the European Commission or a foreign government is the messenger source, people with stronger national identities will have decreased levels of policy support.
-
• H1d: When the European Commission is the messenger source, people with eurosceptic attitudes will have decreased levels of policy support.
Besides the effect of messenger cues, we are further interested in the interplay with the message, in this case with policy content. Here, we choose carbon taxes, which prior research has repeatedly revealed to lack widespread public support due to their strong degree of coerciveness and increased costs (Brückmann and Bernauer Reference Brückmann and Bernauer2020; Carattini et al. Reference Carattini, Baranzini, Thalmann, Varone and Vöhringer2017; Gärling and Schuitema Reference Gärling and Schuitema2007; Stadelmann-Steffen and Dermont Reference Stadelmann-Steffen and Dermont2018; Steg et al. Reference Steg, Van Den Berg and De Groot2013). Regarding our theoretical review on drivers of the interplay between the messenger and the message, we suggest that due to their increased costs, especially for affected individuals, information on increased tax rates draws strong attention to content, potentially dampening cue-taking. However, we also point to relevant policy-specific context factors, as carbon taxes have become highly salient in a polarized public arena, featuring prominent media coverage and protests – factors that have been linked to mixed results in prior research on the message-messenger interplay. Recent experimental evidence on carbon taxation and political messages demonstrates the complexity of this interplay, revealing that policy designs such as carbon rebates or compensation mechanisms strongly affect public support, but party information, if introduced, can reinforce ideology-based opinions (Fremstad et al. Reference Fremstad, Mildenberger, Paul and Stadelmann-Steffen2022; Bürgisser et al. Reference Bürgisser, Stadelmann-Steffen and Armingeon2024). At the same time, research has shown that pre-existing attitudes, for example on financial inequality, can increase motivation to engage in systematic processing of policy information, which persists even when party cues are present (Boudreau and MacKenzie Reference Boudreau and MacKenzie2018). In light of these considerations, we propose two hypotheses.
H2: Carbon taxation policies with higher tax rates will have decreased levels of policy support.
While H2 addresses the well-studied direct effect of increased tax rates, we are especially interested in the potential for messenger cues to influence how individuals respond to such costs. Although we expect the high visibility of the imposed costs to motivate systematic processing of the policy content, the role of cue-taking warrants closer attention. Given the contested nature of carbon taxes in the public arena and the highlighted mixed evidence on cue-taking in highly salient policy areas, we advance a third hypothesis that puts the theory of messenger cues to a hard test. Specifically, we propose that positive cue-taking can mitigate the perceived burden of policy costs. If individuals trust or identify with the institution promoting the policy, cue-taking may function as a credibility-enhancing heuristic, making citizens more likely to view the higher tax rate as justified or necessary, thereby reducing resistance to the policy by buffering against cost aversion.
H3 (Moderating Effect): The negative impact of higher tax rates on policy support (H2) is weaker if there is a positive respondent-source association (as specified in hypotheses H1a–d).
Lastly, if theoretical expectations regarding personal issue-importance hold, higher personal costs should increase motivation to engage with issue-relevant information, thereby shifting attention toward policy content. Our final hypotheses suggest that for those highly affected by the proposed carbon taxation, through fossil fuel car ownership, frequent flying, or fossil fuel-based heating, systematic processing of policy content, thus cost attributes, should drive preference formation.
H4 (Moderating Effect): The higher the personal costs, the more we expect the tax rate attributes to dominate the decision-making process relative to the respondent-messenger association.
-
• H4a: The effect of the positive respondent-messenger association (H1) is weaker if personal costs are high.
-
• H4b: The effect of the tax rate (H2) is stronger if personal costs are high.
Research design and methods
Data
We empirically test the elaborated arguments by implementing a survey-embedded vignette experiment as part of a large-scale online survey fielded in 13 EU countries by the CAPABLE (ClimAte Policy AcceptaBiLity Economic framework) project. The specific survey module for this study was fielded in Germany (n = 1597) and Poland (n = 1595) between July and September 2024, with the final sample matching representative quotas for age, gender, and educational attainment distributions.
We implemented attention checks to avoid low-quality responses, using the following criteria: response duration below 45% of the country-specific median, incorrect answer to an item asking respondents to select “other” in a single-display question, and incorrect answer to an item asking respondents to select “somewhat like me” within a matrix. Respondents who failed two out of the three checks were replaced in the sampling process. The complete questionnaire is provided in Appendix A.
Experimental set-up
The experimental design is a repeated vignette experiment with six rounds (+1 reliability round that mirrors round 1). In each round, respondents were presented with an EU policy proposal that randomly varied in the following attributes:
-
• Policy sector: car fuel tax, aviation fuel tax, or heating fuel tax
-
• Tax rate: 10%, 50%, or 100%
-
• Supporting actor: European Commission, German government, or Polish government
We varied the potential policy cost using percentage price increases of 10%, 50%, and 100%. This range was chosen to be policy-relevant while also providing deliberately broad variation in expected costs. These costs span low-salience changes (10%), a sizable mid-range shift (50%), and an upper-bound stress test (100%) that captures high-salience cases under ambitious decarbonization. These values also mimic a range of future trajectories. At the time of our study (Summer 2024), EU-ETS prices hovered around €65/t. Contemporary projections by BloombergNEF (2025) suggest prices could rise to €90–110/t by 2026–27, and €149/t by 2030 (a more than 100% relative increase). Yet this design aims not to forecast future carbon prices, but rather to create sufficient variation to identify how messenger effects behave across different costs.
To balance the text amounts for the two key dimensions – the tax rate and the supporting actor – equally, we added a one-sentence statement from the supporting actor’s spokesperson that highlighted the policy’s effectiveness. These statements were not expected to have any effect, as they varied randomly in each round with respect to synonyms and sentence structure.
For the policy vignettes, we applied a fully randomized design with two exceptions: First, to avoid showing the same policy sector in consecutive order, we first randomized the order for the first three rounds (e.g., round 1 car fuel tax, round 2 heating fuel tax, round 3 aviation fuel tax). The same random order was then repeated for vignette rounds 4, 5, and 6, thereby avoiding consecutive proposals within the same policy sector. Second, the random sampling across different policy sectors, tax rates, and supporting actors was conducted without replacement. This avoids presenting policy designs that have identical tax rates and supporting actors. Here is a randomly generated policy proposal that was used in the survey:
Fuel tax for heating
The Polish government strongly supports plans for a new measure in the European Union to reduce CO2 emissions caused by heating buildings. Specifically, this involves the introduction of a tax on fossil fuels used for heating (e.g. gas, coal or heating oil).
On average, heating an 80 m2 home in Europe with fossil fuels such as gas, coal, or heating oil costs around 1,000 euros per year. The new heating fuel tax will be introduced in all EU countries and will increase the average annual heating costs in Europe from 1,000 to 1,100 euros.
The spokesperson for the Polish government commented: “This measure is extremely important as it will enable the EU and its member states to achieve their climate protection targets.”
After reading the policy proposals, respondents were asked to state their support on a six-point Likert scale: (1) Strongly oppose, (2) Oppose, (3) Somewhat oppose, (4) Somewhat support, (5) Support, (6) Strongly support.
All policy proposals were framed as new EU-level measures, with the supporting institutional actor varying only in their role as a public endorser. The European Commission, national government, and foreign government were therefore presented as advocates for the same policy, not as its authors or implementers. This design choice holds implementation responsibility constant across conditions, allowing for a clean identification of the pure endorsement effect while deliberately abstracting from the broader institutional implications that accompany messenger identity in real-world EU politics.
Operationalization
We measure the following respondent attitudes as moderators. Trust is measured on a 7-point scale (1 = “Do not trust at all,” 7 = “Completely trust”) for each of the three institutions. Using institution-specific trust measures directly captures respondents’ trust in each respective messenger institution. For robustness checks, we additionally estimate models using an alternative operationalization that separates two components of trust. First, we operationalize generalized institutional trust as each respondent’s mean trust across the three institutions. Second, we capture institution-specific trust as the deviation of a respondent’s trust in each institution from their own mean, reflecting comparatively higher or lower trust in that actor relative to their general level of institutional trust.
National identity is an 8-item International Social Survey Programme scale (ISSP Research Group 2015) ranging from 1 (“Not important at all”) to 7 (“Very important”), averaged across items. Euroscepticism is measured by asking respondents whether they think their country’s EU membership is “a good thing,” “neither a good thing nor a bad thing,” or “a bad thing.” All three variables enter the models on their original scales. For predicted values, trust and national identity are evaluated at the 25th and 75th percentiles of their respective distributions; in the full sample, these correspond to values of 2 and 5 for trust and 4.0 and 5.88 for national identity (see Appendix B for country-specific values used in country-specific plots in the Appendix). Euroscepticism predictions contrast respondents who consider EU membership “a good thing” with those who consider it “a bad thing.” For robustness checks, we additionally measure party preferences.
To study hypotheses on personal costs, we assess car ownership, flying frequency, and heating type. Respondents who privately own a petrol, diesel, or gas-powered car are classified as having high personal costs for car fuel taxes; all others are classified as having low costs. For aviation taxes, those who flew at least once for private travel in 2023 are classified as having high personal costs and non-flyers as having low personal costs. This measure captures recent exposure to aviation-related costs rather than more stable habitual flying behavior, which was not available in the baseline questionnaire. As a robustness check, Appendix D also examines support across more fine-grained flight-frequency categories (0, 1, 2, 3+ flights), yielding substantively similar patterns. For heating taxes, using oil, gas, coal, or district heating entails high personal costs, while electricity, wood pellets, heat pumps, or geothermal energy entails low costs. Summary statistics for key variables are in Appendix B.
Analytical approach and robustness
We estimate OLS models with standard errors clustered at the respondent level to account for the repeated-measures design. The intraclass correlation coefficient of the null model is 0.54, indicating that a substantial share of variance reflects stable individual predispositions. Because treatments are randomly assigned independently of respondent characteristics, these predispositions are orthogonal to treatment assignment and do not bias our estimates; clustering ensures valid inference given the within-respondent correlation. To capture potential fatigue or temporal effects across the six experimental rounds, all models include round fixed effects; models using the full sample additionally include country fixed effects. All specifications control for the same set of pre-treatment covariates: age, gender, and education. For models with randomly assigned predictors, covariate adjustment is not required for identification but can improve precision (Gerber and Green Reference Gerber and Green2012; Montgomery et al. Reference Montgomery, Nyhan and Torres2018). For models using observational predictors (euroscepticism, trust, and national identity), covariate adjustment helps mitigate potential confounding.
We report population-level predictions by averaging fitted values across respondents while holding covariates at their observed distribution. To aid interpretation, some figures include lines as visual guides highlighting relevant comparisons for hypothesis tests. Regression tables with coefficients, clustered standard errors, and significance levels are provided in Appendix C. All figures display 95% confidence intervals.
We also provide country-specific plots in Appendix D to investigate whether the findings are consistent across the German and Polish samples, as well as when alternative operationalizations are used (as indicated in the figure captions in the results section). Furthermore, regarding the spokesperson’s statements used to provide equal weight to both content and messenger in the vignettes, Appendix E shows that the randomly assigned texts by the spokesperson have, as expected, no effect in either the German or Polish samples. Also, we acknowledge that repeated exposure to vignettes on carbon taxation might lower support rates over time. Indeed, Appendix F shows a slight decline in average support levels across rounds. However, the decrease is marginal, with average levels of support in round six only 0.1 scale points lower than in round one. Lastly, to assess reliability across repeated rounds, we examine support levels for identical vignettes shown in rounds one and seven. On the six-point support scale, 54.8% of respondents provided the exact same answer, and a further 31.3% differed by only one scale point, meaning that 86.1% of responses fell within one point across rounds. Both Spearman’s and Pearson’s correlations are 0.76, and the weighted Cohen’s kappa is likewise 0.76, indicating substantial intra-respondent reliability beyond chance agreement. Detailed reliability statistics are reported in Appendix G.
Results
Messenger effects
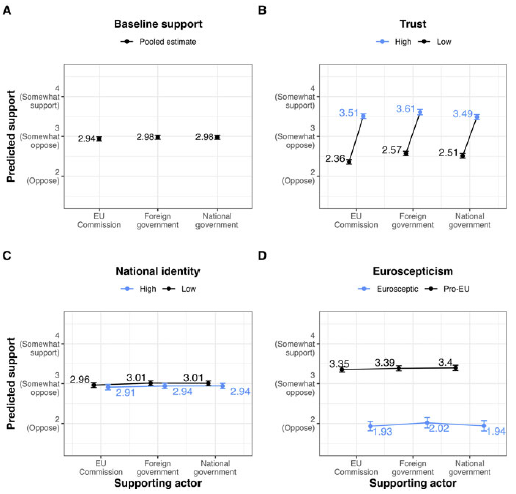
Investigating the hypotheses on the messenger effects (H1) requires examining the respondent-source association, specifically how trust, national identity, and euroscepticism influence approval rates for policies supported by particular actors. Figure 1 reports predicted support rates in four contexts. The baseline plot in panel A displays support levels that depend solely on the proposal’s promoting actor. The three other plots display support levels by different actors as well as high and low levels of trust, national identity, and euroscepticism.
Support levels by respondent-source association. Panels show predicted support by supporting actor for the pooled baseline, at low vs. high trust in the messenger (25th vs. 75th percentile: 2 vs. 5), low vs. high national identity (25th vs. 75th percentile: 4.0 vs. 5.88), and pro-EU vs. eurosceptic respondents, respectively. Predictions derived from OLS models with respondent-level clustered standard errors and country fixed effects. Error bars indicate 95% confidence intervals. Regression tables in Appendix C; country-specific plots and plots by party vote in Appendix D.

Figure 1. Long description
Panel A: This panel shows a bar graph depicting baseline support levels for different supporting actors. The x-axis represents the supporting actor (EU Commission, Foreign government, National government), and the y-axis represents predicted support levels. The pooled estimate for each actor is shown with error bars indicating 95% confidence intervals. The support levels are around 2.94 to 2.98, indicating a somewhat oppose stance. Panel B: This panel shows a line graph depicting predicted support levels based on trust in the messenger. The x-axis represents the supporting actor (EU Commission, Foreign government, National government), and the y-axis represents predicted support levels. Two lines are shown: one for high trust (blue) and one for low trust (black). High trust levels show higher support (around 3.51 to 3.61), while low trust levels show lower support (around 2.36 to 2.57). Panel C: This panel shows a line graph depicting predicted support levels based on national identity. The x-axis represents the supporting actor (EU Commission, Foreign government, National government), and the y-axis represents predicted support levels. Two lines are shown: one for high national identity (blue) and one for low national identity (black). High national identity shows slightly higher support (around 2.96 to 3.01), while low national identity shows slightly lower support (around 2.91 to 2.94). Panel D: This panel shows a line graph depicting predicted support levels based on Euroscepticism. The x-axis represents the supporting actor (EU Commission, Foreign government, National government), and the y-axis represents predicted support levels. Two lines are shown: one for Eurosceptic respondents (blue) and one for pro-EU respondents (black). Pro-EU respondents show higher support (around 3.35 to 3.4), while Eurosceptic respondents show lower support (around 1.93 to 2.02).
The plot on baseline support levels (panel A) reveals that, on average, varying the supporting actor produces no substantively meaningful differences in support rates. When using trust as an indicator for the respondent-source association (panel B), however, a clearer pattern emerges. Moving from the 25th to the 75th percentile of trust (from 2 to 5) corresponds to roughly a one-scale-point increase in support; about +1.15 points for European Commission endorsements, +1.04 for foreign-government endorsements, and +0.98 for national-government endorsements, hence a substantial and statistically significant effect that holds across all sources.
Because trust evaluations of the three institutional actors are substantially correlated, we also estimated models that separate generalized institutional trust from source-specific trust evaluations, reported in Appendix H. The results show that generalized institutional trust is strongly associated with higher overall support for carbon taxation, with each additional point raising support by 0.42 (p < 0.001). However, trust deviations relative to respondents’ average trust still matter for support when policies are endorsed by the European Commission, increasing support by 0.19 per 1-point deviation on the scale (p < 0.001). By contrast, interaction terms for national and foreign governments substantially attenuate these residual effects (−0.25 and −0.24, respectively; both p < 0.001), reducing the net messenger-specific trust effect for these actors to near zero. This suggests that the trust effect is largely driven by generalized institutional trust, although there is some evidence of an additional messenger-specific component for European Commission endorsements.
Panels C and D examine whether messenger effects operate through national identity and euroscepticism. Here, the relevant comparison is whether support levels within the same group vary across different supporting actors (indicated by the connecting lines). We do not find evidence for any differences. Respondents with high national identity are not more supportive of policies backed by the national government, and eurosceptic respondents are not disproportionately less supportive of policies backed by the European Commission.
However, we do find that euroscepticism operates as a strong baseline predictor: eurosceptic respondents show substantially lower support across all supporting actors, with a statistically significant drop of more than one scale point compared to pro-EU respondents (−1.42 for European Commission endorsements, −1.37 for foreign-government endorsements, and −1.46 for national-government endorsements; all p < 0.001). Robustness checks using a binary indicator for whether the respondent’s preferred party is currently in government yield a similar pattern. Opposition party voters are found to have uniformly lower support across all supporting actors, with no differential response to specific messengers (see Appendix D).
In short, these results suggest that cue-taking from trusted actors can substantially increase support levels, independent of the policy sector or tax rate. At the same time, cues based on the respondents’ national identity and euroscepticism do not trigger actor-specific messenger effects. This means that citizens with a strong national identity or eurosceptic attitudes tend to dislike EU-wide carbon taxes in general, regardless of who publicly supports the policy.
Tax rate effect
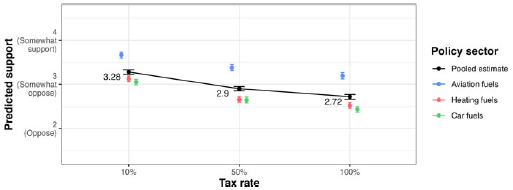
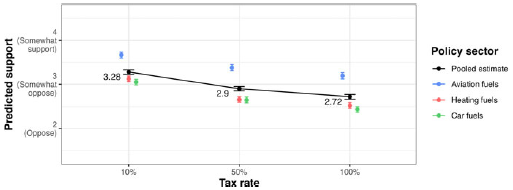
Testing the empirical validity of our cost hypothesis (H2), Figure 2 demonstrates that increasing the rate from 10% to 50% and ultimately to 100% substantially reduces support levels on the six-point scale. Pooled across all policy sectors (black estimates), we observe statistically significant drops of 0.38 and 0.56 scale points when the baseline tax rate increases from 10% to 50% and 100%, respectively. Differentiating by policy sector, we further notice that taxes on aviation fuels (blue estimates) enjoy more overall support, with the 10% proposal slightly above the support midpoint. On the other hand, taxes on heating (red estimates) and car fuels (green estimates) lack public support across all tested tax rates. The country-specific plots reported in Appendix D further show that very similar effect sizes are observed for both countries, the only difference being slightly higher support levels across all proposals in the German sample.
Support levels by tax rate and policy sector. Predictions derived from OLS models with respondent-level clustered standard errors and country fixed effects. The pooled estimate is based on a model without policy sector interactions. Error bars indicate 95% confidence intervals. Regression tables in Appendix C; country-specific plots in Appendix D.
Interaction of tax rate effect and messenger effect
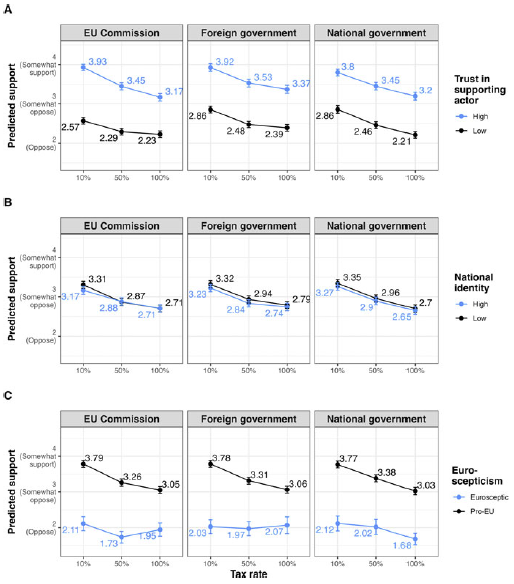
Regarding the interplay between costs and messenger effects, we expect that a positive respondent-source association moderates the negative impact of increasing costs (H3). Taking trust as an example, this means that people who show high trust in the corresponding actor should show a less substantial negative effect of the increasing tax rate. Conversely, low-trust respondents would show a greater aversion to an increase in the tax rate. Figure 3 illustrates the impact of the tax rate, broken down by messenger and the three moderating variables.
Support levels by tax rate and respondent-source association, moderated by trust, national identity, and euroscepticism. Rows A–C show predicted support by tax rate and supporting actor at low vs. high trust in the messenger (25th vs. 75th percentile: 2 vs. 5), low vs. high national identity (25th vs. 75th percentile: 4.0 vs. 5.88), and pro-EU vs. eurosceptic respondents, respectively. Predictions derived from OLS models with respondent-level clustered standard errors and country fixed effects. Error bars indicate 95% confidence intervals. Regression tables in Appendix C; country-specific plots in Appendix D.

The first plot on trust in Figure 3 (panel A) reveals no empirical evidence for this expected mechanism. On the contrary, for policies supported by the European Commission, we see a significantly more substantial negative effect when increasing the tax rate for highly trusting individuals (blue estimates): each additional point of trust amplifies the negative effect of the 50% tax rate by −0.07 (p < 0.01) and of the 100% tax rate by −0.14 (p < 0.001). For policies backed by national or foreign governments, however, we observe parallel trends between high- and low-trust respondents, suggesting that cue-taking based on trust neither boosts nor dampens the adverse effect of increased costs.
The same pattern holds for national identity (panel B) and euroscepticism (panel C), where we would expect stronger negative cost effects when the respondent-source association is negative. We find no empirical evidence for these actor-specific mechanisms. Instead, we observe the same pattern as for trust, where there is a general sensitivity to costs that does not depend on the respondent-source association. For national identity, the positive tax rate
 $\!\! \times\!\!$
identity interactions indicate that the negative effect of higher tax rates is weaker among respondents with stronger national identity; consequently, respondents with lower national identity show steeper declines as tax rates increase. A similar pattern appears for euroscepticism: respondents with low euroscepticism, or more pro-EU attitudes, start from higher support levels but are more sensitive to higher tax rates, whereas eurosceptic respondents show low support across tax rates and comparatively flatter cost responses.
To summarize, we do not find empirical support for the notion that messenger cues mitigate the negative effect of costs. On the contrary, we find that in some contexts, citizens with favorable attitudes towards specific actors (trust) or the EU (low national identity or low euroscepticism) might express higher overall support rates but are highly sensitive to increases in tax rates.
The role of personal costs
Lastly, we examine the role of personal policy costs, a factor expected to increase the importance of policy content. For this, we examine how the messenger effects vary between respondents who are differently affected by the proposed policies (i.e., car owners assessing a car fuel tax, respondents flying at least once in the last year, reading about aviation fuel taxes, or respondents heating their homes with fossil fuels, reading about heating fuel taxes). Figure 4 and Figure 5 extend the analyses from Figure 1 and Figure 2 by incorporating interactions with personal costs. For completeness, we replicate Figure 3 with personal costs in Appendix I.
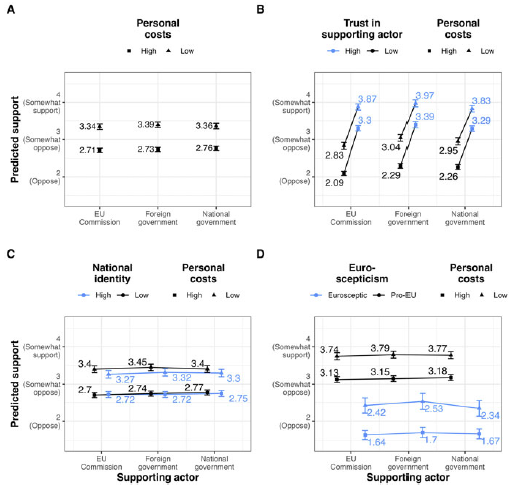
Support levels by respondent-source association and personal relevance. Panels A–D show predicted support by supporting actor for low vs. high personal relevance for the general sample (A) and split by low vs. high trust in the messenger (B; 25th vs. 75th percentile: 2 vs. 5), low vs. high national identity (C; 25th vs. 75th percentile: 4.0 vs. 5.88), and pro-EU vs. eurosceptic respondents (D), respectively. Predictions derived from OLS models with respondent-level clustered standard errors and country fixed effects. Error bars indicate 95% confidence intervals. Regression tables in Appendix C; country-specific plots in Appendix D.

Figure 4. Long description
Panel A: This panel contains a bar graph showing predicted support levels for climate policy by different actors (EU Commission, Foreign government, National government) with high and low personal costs. The y-axis represents predicted support ranging from 2 to 4, with labels for oppose, somewhat oppose, and somewhat support. The x-axis lists the supporting actors. The bars indicate that support levels are generally higher for national governments compared to EU Commission and foreign governments, with slight variations between high and low personal costs. Panel B: This panel features a line graph showing predicted support levels by trust in the supporting actor and personal costs. The y-axis represents predicted support ranging from 2 to 4, with labels for oppose, somewhat oppose, and somewhat support. The x-axis lists the supporting actors. The lines indicate that higher trust in the supporting actor correlates with higher support levels, with notable differences between high and low personal costs. Panel C: This panel contains a line graph showing predicted support levels by national identity and personal costs. The y-axis represents predicted support ranging from 2 to 4, with labels for oppose, somewhat oppose, and somewhat support. The x-axis lists the supporting actors. The lines indicate that higher national identity correlates with higher support levels, with slight variations between high and low personal costs. Panel D: This panel features a line graph showing predicted support levels by euroscepticism and personal costs. The y-axis represents predicted support ranging from 2 to 4, with labels for oppose, somewhat oppose, and somewhat support. The x-axis lists the supporting actors. The lines indicate that pro-EU respondents generally show higher support levels compared to eurosceptic respondents, with variations between high and low personal costs.
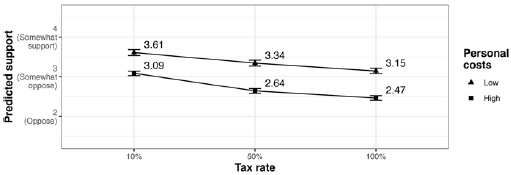
Support levels by tax rate and personal relevance. Predicted support by tax rate for low vs. high personal relevance, pooled across policy sectors. Predictions derived from OLS models with respondent-level clustered standard errors and country fixed effects. Error bars indicate 95% confidence intervals. Regression tables in Appendix C; country-specific and sector-specific plots (including a separate analysis for district heating) in Appendix D.

Panel A in Figure 4 confirms that higher personal costs result in overall lower support levels (−0.65, p < 0.001). Our primary interest, however, lies in Panels B to D, where we test whether messenger effects are mitigated when personal costs are high. Panel B shows that trust raises support to a similar extent in both groups, with a slightly steeper slope among personally affected respondents (interaction +0.06, p < 0.05).
For national identity (panel C), accounting for personal costs does not reveal new messenger effects. However, the variation in support is largely driven by personal costs, with national identity exerting a smaller but meaningful effect. The same cannot be said for euroscepticism (panel D): while we again observe no new messenger effects, eurosceptic attitudes emerge as the dominant driver of preferences. The ranking is clear: eurosceptics with high personal costs report the lowest support, followed by eurosceptics with low costs, then non-eurosceptics with high costs, and finally non-eurosceptics with low costs, who show the strongest support.
Lastly, we are also interested in the role of personal costs in relation to increasing the tax rate. Figure 5 shows that the expected stronger effect of the tax rate for personally affected respondents is empirically supported. Although modest in magnitude, the impact of the tax rate is statistically significantly stronger when personal costs are high: for personally affected respondents, the negative effect of a 50% tax rate is 0.17 scale points stronger, and that of a 100% tax rate is 0.15 scale points stronger (both p < 0.001). In Appendix D, we further show that this moderation effect is driven primarily by the German sample across all three policy sectors. As a robustness check for aviation fuel taxes, we also examined support across more fine-grained flight-frequency categories (0, 1, 2, and 3+ flights in 2023), finding substantively similar patterns to those from the binary classification used in the main analysis.
Discussion
Messenger cues have repeatedly been shown to strongly influence individuals’ policy preference formation (e.g., Bullock Reference Bullock2011; Cohen Reference Cohen2003; Van Boven and Sherman Reference Van Boven and Sherman2021). A rich body of research, particularly within the context of U.S. partisan politics, has demonstrated how individual-level traits (e.g., partisan social identity), source characteristics (e.g., trustworthiness), and context-specific policy attributes (e.g., social salience and personal affectedness) influence whether citizens rely more on policy content or are swayed by messenger effects. In this study, we examine the role of messenger effects in the context of EU climate policy. Specifically, we examine how people differentially rely on “supporting” cues by institutional actors (national governments, foreign governments, or the European Commission) when assessing carbon taxation policies.
The results from our survey-embedded vignette experiment show that, on average, climate policy preferences among German and Polish respondents do not shift solely in response to endorsement by different institutional actors. Instead, as theoretically expected, respondents’ evaluations of the communicator itself play a more important role. Trust in the promoting institution is strongly and positively associated with policy support and is among the most substantial predictors in our analysis. That said, trust raises average support but does not make high-trusting individuals indifferent to costs. The interaction model shows that higher costs are associated with substantial declines in support, even among high-trust respondents, indicating that trust shifts baseline support upward without eliminating sensitivity to the policy’s material implications. Robustness checks further suggest that much of the trust effect reflects generalized institutional trust rather than institution-specific evaluations. Respondents with higher overall trust across institutions are generally more supportive of carbon taxation, while comparatively higher trust in a specific institution shows an additional positive association only for policies endorsed by the European Commission. Overall, these findings underscore the central role of institutional trust in climate policy support and align with recent evidence that trust in institutions responsible for designing or communicating policy can increase both policy preferences and willingness to pay higher prices for environmental protection (Fairbrother et al. Reference Fairbrother, Sevä and Kulin2019; Gomm et al. Reference Gomm, Huber, Kolcava, Smith and Bernauer2024; Harring Reference Harring2013).
Lastly, our findings reveal no empirical support for identity-based cognition as the driver of messenger cues. While citizens with strong national identities and eurosceptic attitudes are less likely to support carbon pricing policies, their opposition seems to be driven more by the nature of the policy itself (an EU-wide climate policy) than by the institution sponsoring it. This pattern is consistent with research linking culturally conservative and right-leaning value orientations to skepticism of climate policy more broadly (Campbell and Kay Reference Campbell and Kay2014; Hornsey Reference Hornsey2021; McCright Reference McCright2016) and with recent evidence on green backlash among right-wing populist constituencies in Europe (Bosetti et al. Reference Bosetti, Colantone, De Vries and Musto2025). Whether such resistance constitutes active backlash or more generalized disengagement remains debated (Henriks et al. Reference Henriks, Harring and Droste2025), but the null finding for identity-based messenger effects may reflect deeper mechanisms rather than a failure of the theoretical model: for eurosceptic and nationally conservative citizens, opposition appears sufficiently ideologically grounded to be largely insensitive to who delivers the message, while lower baseline support leaves less room for further declines as tax rates increase. Indeed, some constituencies in Europe do not support climate policy under any conditions (Smith et al. Reference Smith, Mlakar, Levis, Sanford, Stapper, Bouman, Emmerling, Perlaviciute, Tavoni, Berger, van den Bergh, Bernauer, Casamassima, Epper, Eddai, Savin, Ščasný, Turmunkh, Zvěřinová and Pianta2026). Comparing effect magnitudes underscores this point. Euroscepticism’s effect is comparable in magnitude to trust (around one scale point) but operates as a floor rather than a lever: trust raises baseline support and can be built upon, while eurosceptic attitudes depress it in ways that neither messenger choice nor cost framing appears able to offset. Considering personal costs further, our results suggest that national identity, eurosceptic attitudes, and high personal costs each act as independent, additive deterrents – when combined, they produce very low levels of policy support regardless of which institution endorses the policy.
Overall, our results challenge the assumption that institutional messenger cues substantively shape policy preferences within the EU context. When national and supranational institutions are the stated promoters of different policies, German and Polish respondents appear to judge the policies on their substance rather than on who delivers the message – at least when cues are filtered through national identity or euroscepticism. However, our findings show that messenger cues can positively influence policy support, but only when the promoting source is perceived as being trustworthy.
For policymakers, our findings offer both caution and guidance. The mere presence of different EU-level or national-level actors publicly supporting contested policies does not, in itself, strongly influence public opinion. What matters is the public’s level of trust in the institution that designs or communicates the policy. Yet trust does not guarantee majority support: even individuals who trust EU- or national-level institutions may withdraw support when policies impose higher personal costs. Policymakers would therefore be well-advised to leverage trusted messengers to build support, while remaining mindful that policies with increased personal costs can backfire, particularly among high-trusting individuals, who may be the only group showing majority support to begin with.
For segments of the public with strong eurosceptic attitudes, by contrast, neither the policy’s content nor the messenger’s identity appears to meaningfully shift opinion. These groups evaluate policies based on their climate focus and EU-wide scope, rather than on specific tax rates or institutional sponsors. Communication strategies that modify the messenger or reframe the message are therefore unlikely to be effective here. Shifting their support would require addressing the underlying skepticism toward EU climate governance – a considerably more difficult task that lies beyond the reach of policy design alone.
Our study has several limitations. First, our case selection is confined to two countries. We chose Germany and Poland because of their contrasting public debates on climate policy, and while we find slightly higher average support levels in the German sample, there are no substantial differences in treatment effects between the two countries. At the time of data collection, both countries were led by pro-European governments. German and Polish respondents may therefore have perceived policies supported by national governments as nearly as “European” as those supported by the European Commission, muting the identity cue we would expect. Future research extending to EU member states with more confrontational stances toward the EU (such as Hungary or Italy) would help establish whether identity-protective cognition based on national identity or euroscepticism emerges under conditions of greater institutional contrast.
Second, the moderating factors were measured after respondents completed the vignette experiment, posing some risk of post-treatment bias. While we do not expect relatively stable attitudes such as institutional trust, national identity, or euroscepticism to be substantially altered by brief exposure to policy proposals, the temporal ordering still constrains causal inference.
Third, our policy vignettes involved limited variation in policy content, covering only carbon taxation proposals at the EU level. This deliberately simplified design allowed us to perform a stringent test of our theoretical framework, given that taxes impose salient, direct costs on citizens, and to identify how messenger effects vary and interact across cost levels, which may be obscured in more complex experimental designs with many attributes. At the same time, this limits the generalizability of our findings to other policy instruments. The 10% tax rate reflects conditions at the time of the experiment’s design, while the 50% and 100% scenarios serve as upper-bound stress tests considered plausible by expert projections within the next decade.
Relatedly, our treatments isolate a pure endorsement cue while abstracting from the richer set of inferences citizens draw from institutional identity in practice, such as enforcement credibility, cross-border obligations, revenue allocation, and political accountability. Future research could build on this framework by varying not only who endorses a policy but who authors and implements it, by examining how supranational and national cues interact with policy type (taxes, subsidies, command-and-control instruments) and design elements such as carbon rebates or compensation mechanisms (Fremstad et al. Reference Fremstad, Mildenberger, Paul and Stadelmann-Steffen2022; Bürgisser et al. Reference Bürgisser, Stadelmann-Steffen and Armingeon2024) and by expanding the range of messengers to include business, environmental, labor organizations, or scientists (e.g., Bolsen et al. Reference Bolsen, Palm and Kingsland2019; Diamond and Zhou Reference Diamond and Zhou2022).
Fourth, the survey instrument did not include a measure of respondents’ policy awareness or familiarity with existing carbon pricing systems, which differ substantially between Germany and Poland. While the cross-country equivalence in treatment effects suggests that broad differences in policy context did not translate into differential responses, within-country variation in policy familiarity may still have shaped how respondents processed the vignettes in ways we cannot directly assess. Future studies in contexts with existing carbon pricing should include measures of policy awareness to allow for explicit moderation tests.
Ultimately, broadening the scope of both the messenger and the message would provide a more comprehensive view of how trust, and possibly also identity-protective cognition, interact with policy content to shape public support for EU climate action.
Supplementary material
The supplementary material for this article can be found at https://doi.org/10.1017/S0143814X26101226.
Data availability statement
Replication materials are available in the Journal of Public Policy Dataverse at https://doi.org/10.7910/DVN/FFTR4S.
Author contributions
-
• Alessio Levis is a Doctoral Research Fellow at the Swiss Federal Institute of Technology (ETH) Zürich, Center for Comparative and International Studies (corresponding author).
-
• E. Keith Smith is a Senior Researcher at the Swiss Federal Institute of Technology (ETH) Zürich, Center for Comparative and International Studies.
-
• Silvia Pianta is a Junior Scientist at the RFF-CMCC European Institute on Economics and the Environment.
Funding statement
This project is made possible by funding from the European Union’s Horizon Europe research and innovation program under grant agreement No. 101056891 (CAPABLE). Open access funding provided by the Swiss Federal Institute of Technology Zurich.
Competing interests
The authors have no relevant financial or non-financial interests to disclose.
Ethical standards
The survey has been reviewed and approved by ETH Zurich’s Ethics Committee (EK-2024-141).
Use of artificial intelligence (AI) tools
During the preparation of this work, the authors used Grammarly, ChatGPT, and Claude AI to improve language and readability. After using these tools/services, the authors reviewed and edited the content as needed and take full responsibility for the publication’s content. The same applies to the R and Stata code, where ChatGPT and Claude AI were used to generate and revise it. All generated code was reviewed for correctness, and we take full responsibility for its content.


 Open access

