1. Introduction
Technical advances in structural biology have greatly accelerated the processes of protein structure determination, as reflected in the increasing numbers of three-dimensional (3D) structures available in the Protein Data Bank (PDB). As of January 1st 2014, 96 956 structures are available in the PDB, and the number may reach 0.1 million at some point in 2014. Although the individual structures of the proteins themselves provide important information to understand their functions, most of the proteins, actually, would act together with other proteins and macromolecules, including oligonucleotides and lipids, as well as small molecular ligands, by forming constitutive and/or transient complexes. Toward this end, there are only 12% of the structures in the PDB are in the hetero-complex forms. Thus, the structural analyses of protein complexes, in addition to the development of novel strategies to solve the associated problems, are essential for understanding the biological functions of proteins in the physiological state.
Furthermore, proteins can work as oligomers and/or aggregated states under the physiological conditions. Some proteins are embedded in or associated with phospholipid-bilayer membrane to exert their functions. Above all, living cells are quite inhomogeneous, in the sense of their components and contain an abundance of the complex architectures existing in both solid and liquid phases. Conventional structural analyses of proteins are generally not applicable to these inhomogeneous systems, and thus the development of novel strategies is important to elicit structure information from physiologically relevant states.
Due to their importance in cellular functions, protein–protein interactions are now considered as attractive sites of action in drug development (Berg, Reference Berg2008). Targeting protein–protein interactions with small molecules is still challenging, due to the large protein–protein interaction surfaces and absence of obvious binding pockets (James & Christopher, Reference James and Christopher2007). Since accurate structure models of protein–protein complexes would be quite useful in providing starting points for the drug design, as well as the following optimization steps, strategies that readily provide reliable structural information about protein complexes are greatly desired in pharmacological applications.
Solution-state nuclear magnetic resonance (NMR) spectroscopy methods have extensively contributed toward solving these problems in the structural analyses of protein–protein and protein–macromolecule complexes, as the techniques allow significant variations of the experimental conditions, as compared to other structural–biological methods. In addition, solution-state NMR is a unique methodology to handle and extract dynamic information from heterogeneously behaving systems, and thus is suitable to approach the cellular systems and problems discussed above.
Among other successful strategies using solution-state NMR for the analyses of protein complexes in the physiological states, we have developed NMR measurement techniques, the cross-saturation (CS) and transferred cross-saturation (TCS) methods (Nakanishi et al. Reference Nakanishi, Miyazawa, Sakakura, Terasawa, Takahashi and Shimada2002; Shimada, Reference Shimada2005; Shimada et al. Reference Shimada, Ueda, Matsumoto, Sakakura, Osawa, Takeuchi, Nishida and Takahashi2009; Takahashi et al. Reference Takahashi, Nakanishi, Kami, Arata and Shimada2000). The TCS experiment is an extended version of the CS experiment, which significantly elevates the molecular weight limitation of CS methods to >150 kDa, given that fast exchange conditions between the bound and unbound states are achieved (k ex>0.1 s−1). Both techniques provide precise identification of the interfaces of protein–protein complexes in solution, and have been used to investigate the interactions of proteins, including large and/or membrane-embedded proteins, with their biological binding partners (Shimada, Reference Shimada2005; Shimada et al. Reference Shimada, Ueda, Matsumoto, Sakakura, Osawa, Takeuchi, Nishida and Takahashi2009). The techniques have also been successfully applied to systems with huge molecular weights and/or inhomogeneity, such as liposomes and insoluble fibrils, as previously reviewed (Shimada, Reference Shimada2005; Shimada et al. Reference Shimada, Ueda, Matsumoto, Sakakura, Osawa, Takeuchi, Nishida and Takahashi2009). Furthermore, the nature of the TCS experiment, which has higher sensitivity toward low-affinity transient interactions, is optimal for analyzing ‘encounter complexes’, which represent the first dynamic step in the protein complex formation and are crucial for accelerating stable productive complex formation.
Here, along with the theoretical and practical considerations of the CS and TCS methods, we will review the recent applications of TCS to the analyses of biologically and biomedicinally important proteins in physiologically relevant states. We will also discuss the recent progress in constructing accurate structural models of protein–protein complexes, based on the information obtained from CS and TCS experiments, which would be in the early stages of drug development processes. The TCS method has also contributed toward revealing dynamic views of the protein complex formation, which are represented by the formation of the encounter complex or multistep protein–protein/protein–membrane interactions, as discussed in detail in this review. Through these examples, we hope to convince the readers that the CS and TCS methods are suitable to provide accurate structural information from dynamic and inhomogeneous systems, which are quite abundant in living cells. The information may be complementary to or inaccessible from the static views of the interactions provided by other structural biological methods.
2. Outline of the CS and TCS methods
Schematic diagrams of the CS experiments are shown in Fig. 1 (Takahashi et al. Reference Takahashi, Nakanishi, Kami, Arata and Shimada2000). In the CS experiments, the complex of the uniformly 2H,15N-labeled protein I, with residues to be identified as the interface residues, and the non-labeled protein II is formed in a solvent with a low H2O/D2O ratio, typically 10% H2O/90% D2O. Under these conditions, the proton density in protein I is very low, because the protons in protein I are all exchangeable and each exchangeable hydrogen site is occupied by 1H with low probability. The complex is irradiated at a frequency corresponding to the aliphatic proton resonances, which exclusively affects protein II, because almost no aliphatic protons exist in the deuterated protein I. In the case of large proteins, the saturation in the aliphatic protons of protein II is instantaneously transferred to all of the hydrogen atoms of protein II, which has high proton density. This phenomenon is known as the spin diffusion effect (Akasaka, Reference Akasaka1981; Kalk & Berendsen, Reference Kalk and Berendsen1976). Although the deuterated protein I is not directly affected by the radiofrequency field, the saturation can be transferred from proteins II to I through the interface of the complex, in a phenomenon called the CS effect. The saturation transferred to protein I is limited to the interface, due to its low proton density. The saturation of each amide proton of protein I can be observed as an intensity reduction in 1H–15N shift correlation spectra, measured by transverse relaxation-optimized spectroscopy (TROSY) coherence transfer (Pervushin et al. Reference Pervushin, Riek, Wider and Wüthrich1997, Reference Pervushin, Wider and Wüthrich1998). Therefore, the residues that are in close proximity to protein II can be identified by observing their signal intensity reductions.
Schematic diagrams of the CS method.

As exemplified by previous studies, the binding interfaces determined by the CS method are more precise than those provided by conventional methods, such as chemical shift perturbation and H–D exchange rates (Matsuda et al. Reference Matsuda, Ikegami, Nakajima, Yamazaki and Nakamura2004; Shimada et al. Reference Shimada, Ueda, Matsumoto, Sakakura, Osawa, Takeuchi, Nishida and Takahashi2009; Takahashi et al. Reference Takahashi, Nakanishi, Kami, Arata and Shimada2000). These differences could arise because the chemical shifts and the H–D exchange rates are affected by various factors, such as differences in the microenvironment and subtle conformational changes upon binding. Therefore, the combination of the CS and chemical shift perturbation methods provides a useful means of separating the direct intermolecular contacts from the secondary effects due to ligand-induced conformational changes (Takeda et al. Reference Takeda, Terasawa, Sakakura, Yamaguchi, Kajiwara, Kawashima, Miyasaka and Shimada2003).
For the effective suppression of spin diffusion in protein I, a solvent with a low concentration of H2O is used in the CS experiment. However, since the CS effect is detected by the labile main chain amide protons, this experimental limitation causes a loss of sensitivity. Furthermore, because the main chain amide protons usually form the framework structure of the protein, and thus are less exposed on the molecular surface, they are generally less susceptible to saturation transfer from protein II to protein I. Therefore, we utilized the side chain methyl protons of protein I in the CS method (Takahashi et al. Reference Takahashi, Miyazawa, Ina, Fukunishi, Mizukoshi, Nakamura and Shimada2006).
The probability of methyl protons being located in the molecular interface of a protein–protein complex is comparable to or even larger than that of amide protons (Takahashi et al. Reference Takahashi, Miyazawa, Ina, Fukunishi, Mizukoshi, Nakamura and Shimada2006). Furthermore, the 1H–13C shift correlation spectra of the methyl groups are generally well-resolved, and because of the fast rotation about the methyl symmetry axis, the methyl group exhibits narrow line widths, leading to excellent sensitivity (Goto et al. Reference Goto, Gardner, Mueller, Willis and Kay1999; Hajduk et al. Reference Hajduk, Augeri, Mack, Mendoza, Yang, Betz and Fesik2000; Rosen et al. Reference Rosen, Gardner, Willis, Parris, Pawson and Kay1996). Additionally, the relatively short longitudinal relaxation time of the methyl protons ensures the short relaxation delay in the experiment, which decreases the total measurement time. Therefore, the methyl protons are very suitable probes in the CS experiments used for identifying molecular interfaces.
In the CS method, the resonances originating from the complexes should be directly observed. Therefore, the CS method is not so effective with protein complexes larger than 150 kDa. To overcome these limitations, we have developed an extended version of the CS method, termed TCS measurement (Nakanishi et al. Reference Nakanishi, Miyazawa, Sakakura, Terasawa, Takahashi and Shimada2002). The TCS experiments are performed with an excess amount of protein I, relative to protein II (Fig. 2). If the complex has sufficiently large exchange rates between the free and bound states, then the saturation of the interface residues is efficiently transferred to the free state of protein I. The TCS method is applicable to large and/or heterogeneous protein complexes, for which NMR signals in the complex state are not directly observable, because we do not need to directly observe the complex signals.
Schematic diagrams of the TCS method.
3. General theory of the TCS method
The efficiency of the TCS effects depends on experimental condition and sample properties, such as solution conditions, binding constant of proteins I to II, molecular weights of the complex, and the spatial configurations of the protons in the complex. Therefore, a theoretical description of the TCS method will be helpful for the rational optimization of the experimental conditions.
In the samples prepared for analyses by CS or TCS method, the exchangeable hydrogen sites are occupied by either 1H or 2H at the probability of the fractional content of protons in the solvents, and therefore, the samples are mixtures of isotopomers. The time-course of the longitudinal magnetizations of the protons of each isotopomer in the TCS method during the irradiation is given by Matsumoto et al. (Reference Matsumoto, Ueda and Shimada2010)
 $$\displaystyle{{{\rm d}{\bf M}(t)} \over {{\rm d}t}} = - ({\bf R} + {\bf K})({\bf M}(t) - {\bf M}_0 ) + {\bf Q},$$
where M(t) is a vector consisting of the longitudinal magnetizations of protons of proteins I and II that are not directly irradiated, M0 is a vector consisting of the magnetizations at thermal equilibrium, R is a relaxation matrix, K is a kinetic matrix, Q is a vector consisting of the sum of the products of the magnetization at thermal equilibrium and the cross-relaxation rate constants between the protons that are directly irradiated and the protons that are not directly irradiated, and t is the duration of the irradiation.
In order to suppress the spin diffusion in protein I, due to the lower proton density, protein I is deuterated and water with a low proton concentration is used as the solvent. In the presence of the extremely low proton concentration, it can be assumed that only protein I isotopomers that contain one proton are predominantly exist in sample solution. For simplicity, we also assume that all of the protons in protein II are instantaneously saturated upon irradiation, and thus, the magnetizations of all of the protons in protein II are assumed to be zero. Under such conditions, the time-course of the magnetization of each proton in protein I, described by two-coupled differential equations, are given by
 $${\eqalign{\displaystyle{{\rm d} \over {{\rm d}t}}\left( {\matrix{ {M_{\rm f} (t)} \cr {M_{\rm b} (t)} \cr}} \right) = - \left[ {\left( {\matrix{ {\rho _{\rm f}} & 0 \cr 0 & {\rho _{\rm b}} \cr}} \right) + \left( {\matrix{ {k_{{\rm on}} \left[ R \right]} & { - k_{{\rm on}} \left[ R \right]} \cr { - k_{{\rm off}}} & {k_{{\rm off}}} \cr}} \right)} \right]\left( {\matrix{ {M_{\rm f} (t) - M_0} \cr {M_{\rm b} (t) - M_0} \cr}} \right) + \left( {\matrix{ 0 \cr {\mathop \sum \limits_i^{{\rm receptor}} \sigma _i M_0} }}} \right),\hskip-6pt\cr$$
where M f (t) and M b (t) are the magnetizations for the proton of protein I in the free and bound states, respectively, ρ f and ρ b are the longitudinal relaxation rate constants for the proton of protein I in the free and bound states, respectively, k on and k off are the second-order association rate constant and the dissociation rate constant, respectively, [R] is the concentration of the free protein II, and  $\sum\nolimits_i^{{\rm receptor}} {\sigma _i M_0} $ is the sum of the intermolecular saturation transfer rates. Note that all of the magnetizations are defined as values per unit concentration; therefore, the kinetic matrix in Eq. (2) is corrected from the previously reported conventional kinetic matrix (Jayalakshmi & Krishna, Reference Jayalakshmi and Krishna2002) by multiplying the corresponding concentration ratios, as
 $${\bf K} = \left( {\matrix{ {k_{{\rm on}} \left[ R \right]} & { - k_{{\rm off}} \times \displaystyle{{\left[ L \right]} \over {\left[ {LR} \right]}}} \cr { - k_{{\rm on}} \left[ R \right] \times \displaystyle{{\left[ L \right]} \over {\left[ {LR} \right]}}} & {k_{{\rm off}}} \cr}} \right) = \left( {\matrix{ {k_{{\rm on}} \left[ R \right]} & { - k_{{\rm on}} \left[ R \right]} \cr { - k_{{\rm off}}} & {k_{{\rm off}}} \cr}} \right),$$
where [L] and [LR] are the concentrations of the free protein I and the complex, respectively.
ρ f, ρ b, and σ i can be calculated from the rotational correlation times of protein I in the free and bound states and the distances between protons in the complex, although not described in detail here (Matsumoto et al. Reference Matsumoto, Ueda and Shimada2010). [R] can be calculated from k on, k off, and the total concentration of proteins I and II.
The effects of the radiofrequency (rf)-irradiation in each proton of protein I are evaluated by the ratio of the signal intensities from spectra recorded with and without irradiation, given by M f(t)/M 0.
If we assume that the initial magnetizations of all protons in protein I are at thermal equilibrium (M f(0)=M b(0)=M 0), then the analytical solution of Eq. (2) is given by
 $$\hskip-2pt\eqalign{\left( {\matrix{\! {M_{\rm f} (t)} \cr {M_{\rm b} (t)} \cr}} \!\right) \!=\! \left( {\matrix{ {M_0} \cr {M_0} \cr}}\! \right) + \displaystyle{{\sum\limits_{i}^{{\rm receptor}} {\sigma _{i}\, M_0}} \over {\rho _{\rm f} \rho _{\rm b} {\rm +} \overline \rho k_{{\rm ex}}}} \left(\! {\matrix{ {k_{{\rm on }}{[R]} \left(\! {1 + \displaystyle{{\lambda _ -} \over {\lambda _ + - \lambda _ -}} {\rm e}^{ - \lambda _ + t} - \displaystyle{{\lambda _ +} \over {\lambda _ + - \lambda _ -}} {\rm e}^{ - \lambda _ - t}} \!\right)} \cr {\lambda _{\rm f} - \lambda _ - \left( {1 - \displaystyle{{\lambda _{\rm f} - \lambda _{\rm b}} \over {\lambda _ + - \lambda _ -}}} \right){\rm e}^{ - \lambda _ + t} - \lambda _ + \left(\! {1 + \displaystyle{{\lambda _{\rm f} - \lambda _{\rm b}} \over {\lambda _ + - \lambda _ -}}} \right){\rm e}^{ - \lambda _ - t}} \cr}}}\! \right),$$
where λ f = ρ f+k on[R], λ b = ρ b+koff, k ex = k on[R]+k off, and  $\overline \rho = (1 - p_{\rm b})\rho _{\rm f} + p_{\rm b} \rho _{\rm b} $. λ + and λ − are the eigenvalues of the dynamic matrix, and are given by
 $$\lambda _ \pm\! = \displaystyle{{\rho _{\rm f} + \rho _{\rm b} + k_{{\rm ex}} \pm \sqrt {(\rho _{\rm f} - \rho _{\rm b} )^2 + 2(\rho _{\rm f} - \rho _{\rm b} )(\,p_{\rm b} - p_{\rm f} )k_{{\rm ex}} + k_{{\rm ex}}^2}} \over 2}.$$
p b and p f are the free and bound fractions of protein I, respectively. Therefore, the ratio of the signal intensities of each proton can be calculated from k on, k off, the total concentration of proteins I and II, the rotational correlation times of protein I in the free and bound states, and the distances between the protons in the complex, by using these equations. k on, k off, and the rotational correlation times of protein I in the free and bound states are dependent on temperature.
The above relatively simple theoretical descriptions are invalid in the cases where more than two protons exist in each protein I molecule. The spatial configuration of the protons of each isotopomer in protein I can be quite variable, because protein I is deuterated and water with a low proton concentration is used as the solvent (Fig. 3). Therefore, the observable magnetizations in the CS or TCS methods need to be formulated as an ensemble average of the magnetizations over all of the isotopomers in the sample solution. Although not described in detail here, we have established the theoretical description of the TCS method, which explicitly incorporated isotopomers in the sample solution (Matsumoto et al. Reference Matsumoto, Ueda and Shimada2010).
Schematic diagrams of the samples used in TCS experiments. Protein I is deuterated, and water with a low proton concentration is used as the solvent. Under these conditions, the spatial configurations of the protons of each isotopomer in protein I can be highly variable.
4. Practical considerations for TCS experiments
4.1 Estimation of the effects of the experimental conditions on CS phenomena by model spin simulation
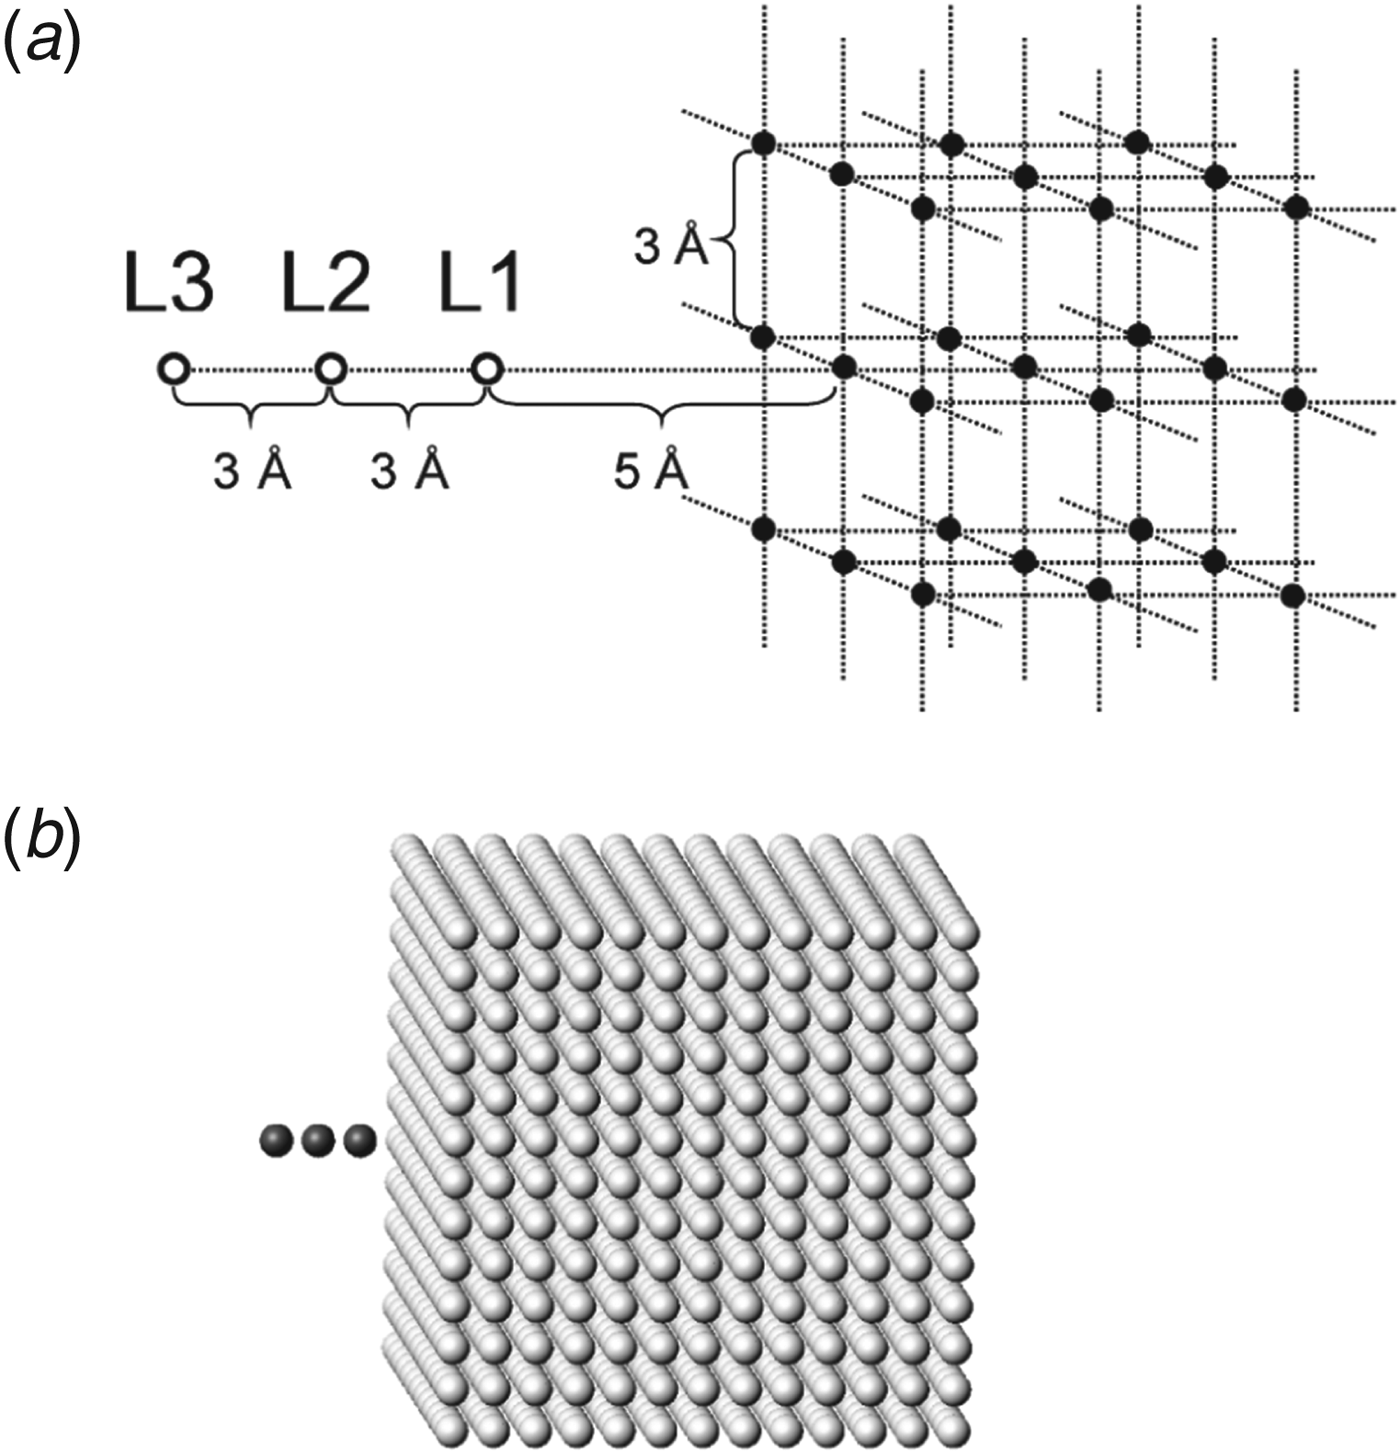
To estimate the effects of the experimental conditions in the TCS method, we performed numerical simulations of TCS experiments using a model spin system that mimics large complexes, as shown in Fig. 4a and b, based on the theories that incorporate isotopomers (Matsumoto et al. Reference Matsumoto, Ueda and Shimada2010).
Model spin system used in the simulation study. (a) Basic structure of the model spin system. Protein I is composed of three exchangeable protons, L1, L2, and L3 (open circles) placed linearly with 3 Å spacing. Protein II is composed of non-exchangeable protons (closed circles) placed at 3 Å -spaced grid points in a cube. The distance between the L1 proton and the closest proton of protein II is set to 5 Å. (b) CPK model of the model spin system. The total number of protons in protein II is 133. The protons of proteins I and II are colored gray and white, respectively.
In the theoretical description of the TCS experiments, we made several assumptions for simplification (Matsumoto et al. Reference Matsumoto, Ueda and Shimada2010). In the model spin simulation, we also assumed that the model spin system sufficiently mimics the spatial configuration of protons in protein–protein complexes. Nevertheless, the intensity ratios in the TCS experiments of the complex of ubiquitin (Ub) and yeast ubiquitin hydrolase 1 (YUH1) were similar to those in the model spin simulation under the corresponding conditions, suggesting that the simulation was effective for the optimization of the TCS experimental conditions (Matsumoto et al. Reference Matsumoto, Ueda and Shimada2010).
Although not described in detail here, the simulation studies indicated that: (i) the proton concentration in the solvent should be 10–30%; (ii) a larger p b is preferred for higher saturation efficiency; (iii) the TCS method is applicable to systems where k off > 0.1 s−1; (iv) for k off ⩾ 10 s−1, p b ⩾ 0.1 is preferred; (v) for k off ∼ 1 s−1, p b ⩾ 0.5 is preferred; and (vi) the TCS method is applicable to systems with large τ c (∼1 μs), where p b is ∼0.01 (Matsumoto et al. Reference Matsumoto, Ueda and Shimada2010).
4.2 Residual protons in protein I
High deuteration ratio for protein I (⩾95%) is important in the CS and TCS experiments, because residual aliphatic protons in protein I may induce unfavorable intensity reductions for non-binding site residues. Although the effects of the residual protons are usually negligible for properly prepared perdeuterated samples, the protons in the thiol and hydroxyl groups located inside of proteins may slowly exchange with water and behave as residual aliphatic protons (Matsuda et al. Reference Matsuda, Ikegami, Nakajima, Yamazaki and Nakamura2004), especially in the case of a larger protein systems, in which the saturation transfer rates are significantly enhanced (Mase et al. Reference Mase, Yokogawa, Osawa and Shimada2012; Yokogawa et al. Reference Yokogawa, Osawa, Takeuchi, Mase and Shimada2011). These effects may be avoided by optimization of the center frequency and the bandwidth of the saturation pulses to guarantee instantaneous saturation for protein II (Sugiki et al. Reference Sugiki, Takeuchi, Yamaji, Takano, Tokunaga, Kumagai, Hanada, Takahashi and Shimada2012; Yokogawa et al. Reference Yokogawa, Osawa, Takeuchi, Mase and Shimada2011).
4.3 Subtraction of the non-specific binding effects
The samples used in CS and TCS experiments often contain additional non-deuterated additives or impurities as well as proteins I and II. The irradiation saturates these additional substances, and the saturation may transfer from the substances to the observed protein I via water or non-specific interactions. Therefore, control experiments are important, in order to rule out these effects. In the cases where deuterated protein II is available, the non-specific binding effects can be examined by control experiments in which both of the proteins are deuterated (Mase et al. Reference Mase, Yokogawa, Osawa and Shimada2012). In the cases where inhibitors are available, the non-specific binding effects can be examined by competitive control experiments in the presence of the inhibitors (Kanaba et al. Reference Kanaba, Maesaki, Mori, Ito, Hakoshima and Mishima2013; Kofuku et al. Reference Kofuku, Yoshiura, Ueda, Terasawa, Hirai, Tominaga, Hirose, Maeda, Takahashi, Terashima, Matsushima and Shimada2009; Kubo et al. Reference Kubo, Nishida, Udagawa, Takarada, Ogino and Shimada2013). In the cases where protein II is embedded in vesicles, and vesicles in which the binding site of protein II is inwardly oriented are available, the non-specific binding effects can be examined by control experiments with the inwardly oriented vesicles (Ueda et al. Reference Ueda, Nomoto, Koga, Ogasa, Ogawa, Matsumoto, Stampoulis, Sode, Terasawa and Shimada2012).
5. Model building based on an amino-acid selective cross-saturation (ASCS) method
5.1 ASCS method to identify intermolecular proximal residue pairs
As described in Section 1, accurate protein–protein complex models based on precise experimental information about the intermolecular interactions are required, as the starting points for drug development. In this section, we will describe the construction of protein–protein complex models, based on ASCS and TCS methods (Igarashi et al. Reference Igarashi, Osawa, Takeuchi, Ozawa and Shimada2008; Kanamori et al. Reference Kanamori, Igarashi, Osawa, Fukunishi, Shimada and Nakamura2011).
Although the CS experiments provide reliable information about the protein II-binding interface of protein I (Fig. 1), the CS method, in principle, provides no information about the binding residues of protein II, and thus about the relative orientation of the two proteins, because the protons of the non-labeled protein II are subjected to saturation by irradiation and subsequent spin diffusion to the whole protein II molecule. In order to build a complex model, the intermolecular proximal residue pairs must be identified. In conventional NMR experiments, the intermolecular nuclear Overhauser effect (NOE) must be observed and assigned. However, the intermolecular NOEs that are observed within 5 Å are mostly those between side chain protons, which often cannot be assigned in larger systems, due to the degeneracy of the NMR signals. We obtained such information by development of an ASCS method, in which only the main chain assignments of protein I are necessary (Igarashi et al. Reference Igarashi, Osawa, Takeuchi, Ozawa and Shimada2008).
5.2 Outline of the ASCS method
In the conventional CS method, in which proteins I and II are unlabeled and uniformly 2H,15N-labeled, respectively (Fig. 1). In the ASCS method, on the other hand, protein II is amino acid selectively 1H-labeled in a 2H-background, while protein I is uniformly 2H,15N-labeled. With this labeling method, CS originates from the 1H-labeled amino-acid residues on protein II. Figure 5a schematically depicts the amino acid X, Y, and Z selective CS, where the amide protons of protein I, H1, H2, and H3 and H4, are affected by the rf-irradiation, respectively. As shown in Fig. 5b, the distribution of the CS-source residues of amino acid types X, Y, and Z overlaps with that of the amide protons affected by the rf-irradiation on protein I at the binding interface. Therefore, given each 3D structure of proteins I and II and the combinatorial analysis of multiple ASCS results using several differently labeled protein II, the identification of the CS-source residue(s) on protein II is possible. Thus, the ASCS method can identify the CS-source residue(s) of protein II and the residue(s) of protein I affected by the rf-irradiation, as the intermolecular proximal residue pairs.
Schematic representations of ASCS methods. (a) The ASCS method. Protein II molecules are amino acids, X, Y, and Z selectively 1H-labeled in a 2H-background on each panel, respectively, whereas protein I is labeled in the same way as in conventional CS. The amide protons affected by the rf-irradiation on the ligand are depicted as H1, H2, H3, and H4. (b) Combinatorial approach to determine the proximal residue pairs. The CS-source residues can be identified by combining several ASCS results, based on the spatial complementarity of the CS-source candidates and the amide protons affected by the rf-irradiation.
This amino-acid selective 1H-labeling in a 2H-background applied to ASCS requires highly selective and efficient 1H labeling. Our quantitative analyses of the labeling efficiency of model proteins revealed that the amino-acid selective 1H-labeling was applicable to Ala, Arg, His, Ile, Leu, Lys, Met, Phe, Pro, Tyr, Trp, Cys., and Gly, but not to Asp, Gln, Ser, Thr, and Val. Gly and Cys have intermediate incorporation efficiencies.
5.3 Observation of CS from the amino-acid selectively 1H-labeled protein
The ASCS observations were validated using the known structure of the complex of yeast Ub and the C90S mutant of YUH1 (Johnston et al. Reference Johnston, Riddle, Cohen and Hill1999). The C90S mutant of YUH1 was found to bind Ub with a dissociation constant of 43 nM. Hereafter, we refer to the C90S mutant of YUH1 as YUH1.
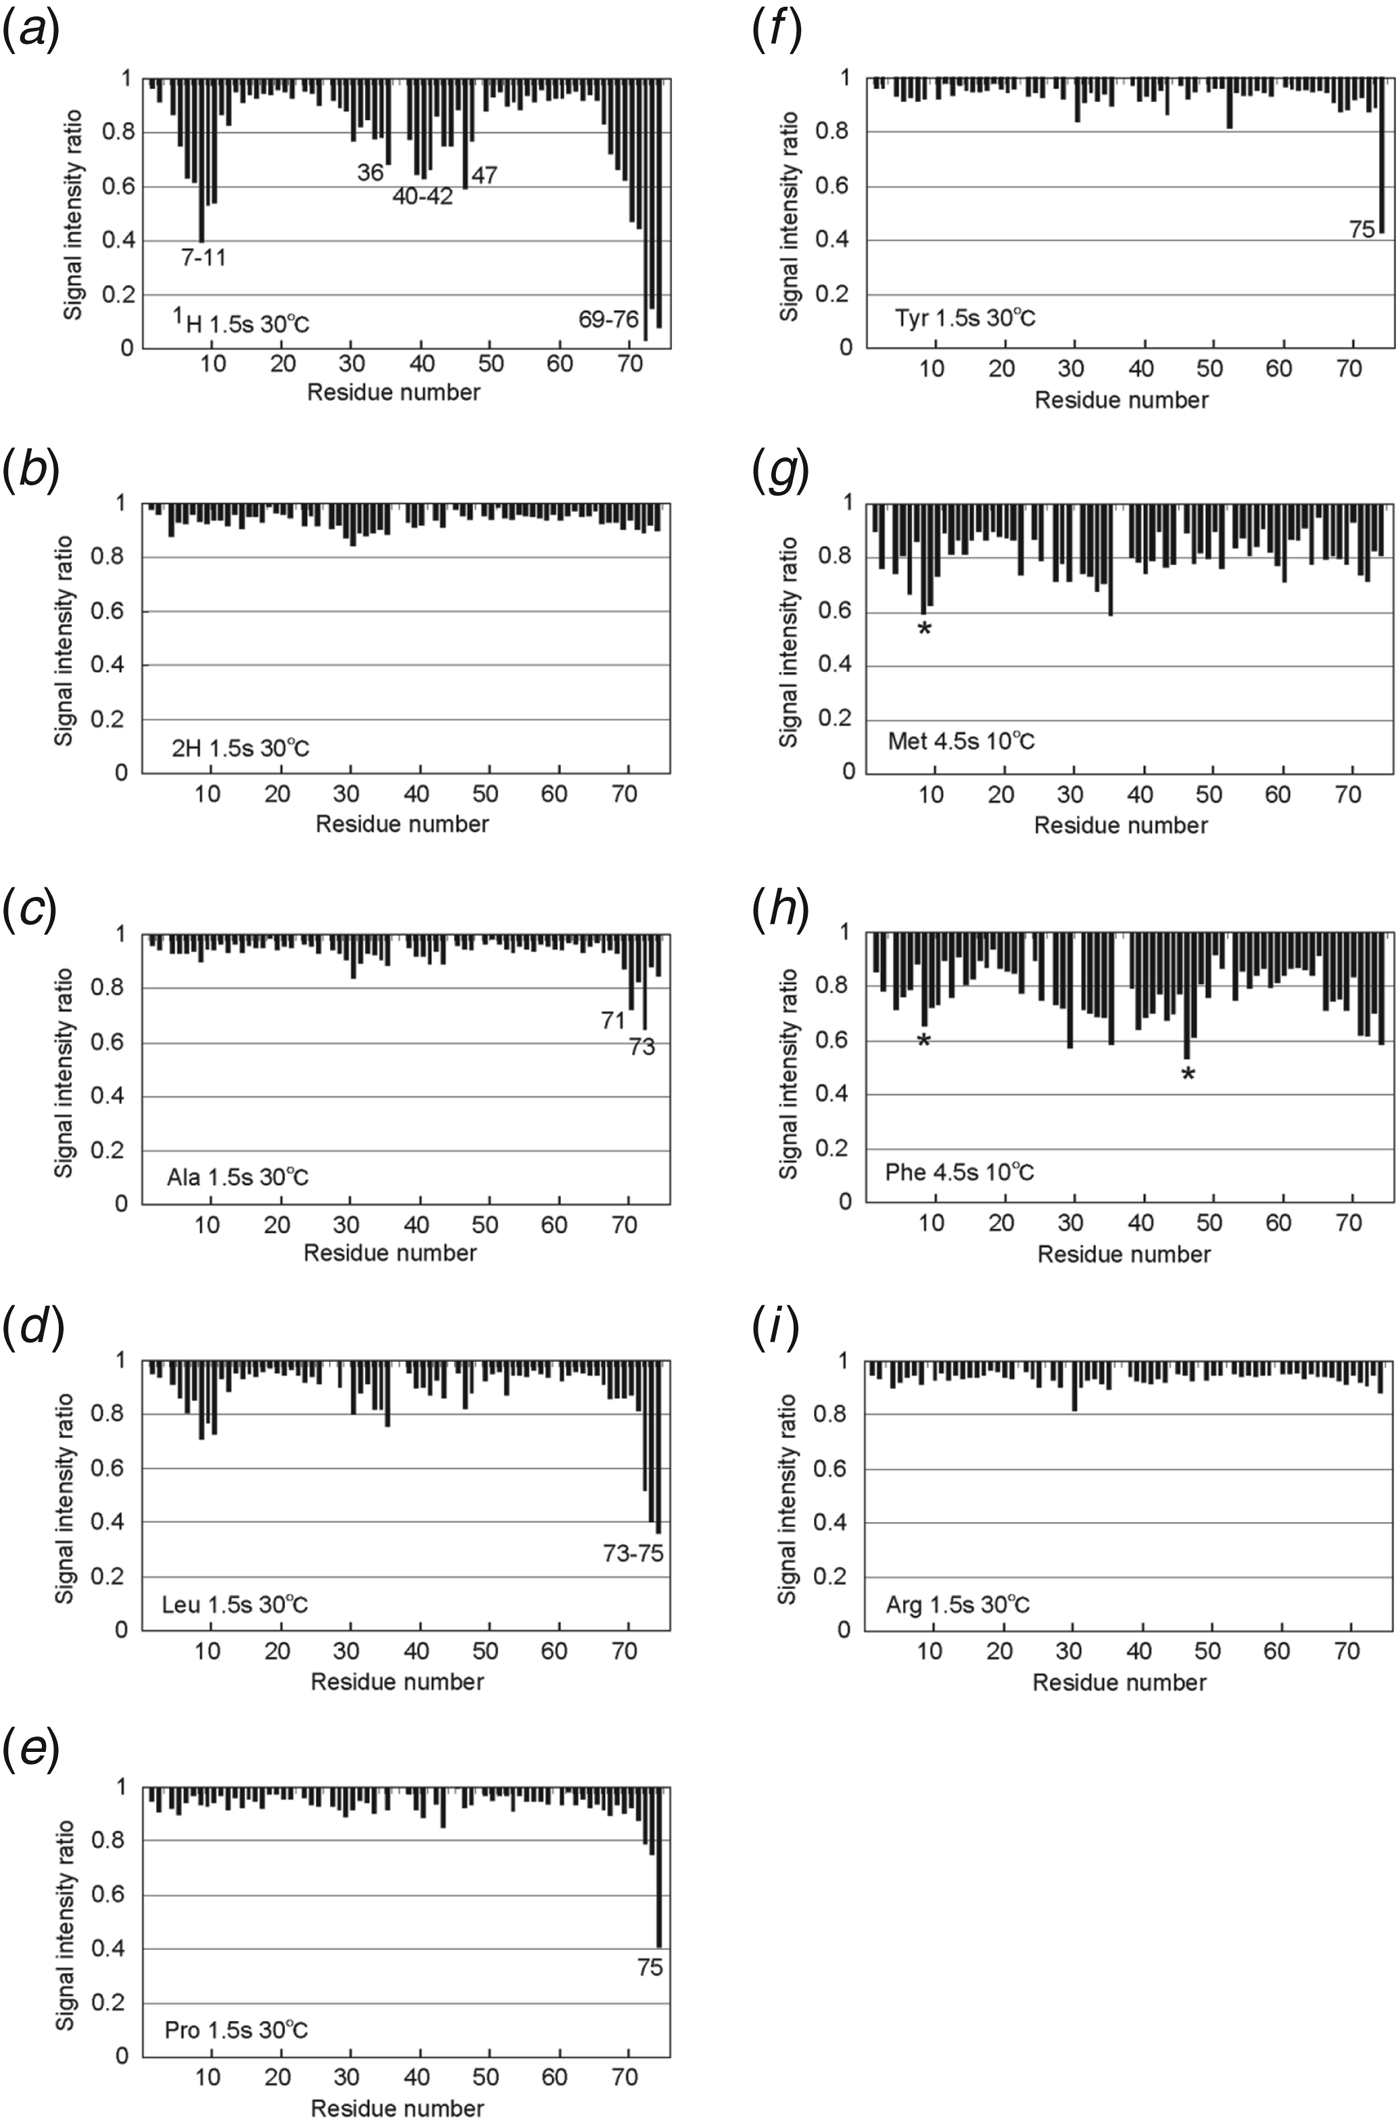
First, the CS experiments were performed using unlabeled YUH1 (the conventional CS method, Fig. 6a) and uniformly 2H-labeled YUH1 as a negative control (Fig. 6b). While the 2H-labeled YUH1 showed no signal intensity reduction, the conventional CS experiment provided signal intensity reductions for residues 7–11, 36, 40–42, 47, and 69–75 of Ub (Fig. 6a).
CS from YUH1 to Ub. (a) Conventional CS experiment using unlabeled YUH1. Residues 7–11, 36, 40–42, 47, and 69–76 of Ub were significantly affected by the rf-irradiation. (b) CS experiment using uniformly 2H-labeled YUH1. No Ub residue was affected by the rf-irradiation. (c) Ala, (d) Leu, (e) Pro, (f) Tyr, (g) Met, (h) Phe, and (i) Arg-selective CS experiments. (c–f and i) ASCS experiments were performed at 30°C with irradiation for 1.5 s. Numbers show Ub residues affected by the rf-irradiation. (g and h) ASCS experiments were performed at 10°C with irradiation for 4.5 s. Asterisks indicate the Ub residues within 4–5 Å from the 1H-labeled amino-acid residues of YUH1.
ASCS experiments were then performed for Ala, Arg, Leu, Met, Phe, Pro, or Tyr selectively 1H-labeled YUH1 in complexes with uniformly 2H,15N-labeled Ub. Figure 6c–i shows each of the ASCS results. The CS was observed from [1H-Ala] YUH1 to Leu71 and Leu73 of Ub (Fig. 6c); from [1H-Leu] YUH1 to Leu73, Arg74, and Gly75 (Fig. 6d); from [1H-Pro] YUH1 to Gly75 (Fig. 6e); and from [1H-Tyr] YUH1 to Gly75 (Fig. 6f). Although no signal intensity reduction was observed for Met and Phe under the same conditions as those for the other amino acids (data not shown), small intensity reductions were observed by changing the saturation duration from 1.5 to 4.5 s and the temperature from 30 to 10°C to increase the spin diffusion rate, considering the molecular weight of YUH1 (26 kDa) (Fig. 6g and h). No CS was detected from Arg to Ub (Fig. 6i).
We note a possibility of the insufficient saturation in protein II, due to the amino-acid-selective labeling, leading to the low sensitivity to the detection of CS. To enhance the sensitivity, lowering temperature in the ASCS experiments is useful.
5.4 Search for the CS-source residues
We then tried to identify the Ub-binding site on YUH1 by analyzing the Ala, Leu, Pro, and Tyr selective ASCS results, with reference to the individual structures of Ub and YUH1. The saturation of Pro residues on [1H–Pro] YUH1 and Tyr residues on [1H–Tyr] YUH1 caused the signal reduction at Gly75 of Ub (Fig. 6e and f), indicating that the CS-source Pro and Tyr residues are located in close proximity to the YUH1 surface. The combinations of proximal Pro and Tyr residues (<7 Å) found on the YUH1 surface were Pro10/Tyr167, Pro15/Tyr37, Pro49/Tyr37, and Pro188/Tyr190. The Ub molecule was then placed on the YUH1 surface, to allow Gly75 of Ub to approach each of the four Pro/Tyr sites. While keeping the amide proton of Gly75 of Ub in the proximity of each Pro/Tyr site, various orientations of Ub were examined to satisfy other ASCS results, i.e., the CS-source Ala residue(s) close to the Leu71 and Leu73, which were affected by the rf-irradiation (Fig. 6c), and the CS-source Leu residue(s) close to Leu73, Arg74, and Gly75 (Fig. 6d) of Ub. As a result, this manual analysis identified Pro10 and Tyr167 as the CS sources for Gly75 of Ub; Ala218 and/or Ala227 for Leu71 and Leu73 of Ub; and Leu58, Leu165, and/or Leu229 for Leu73, Arg74, and Gly75 of Ub (Fig. 7).
Identification of proximal residues on Ub and YUH1 by ASCS. (a) Left: Amide protons affected by the rf-irradiation (red spheres) in four ASCS experiments. The Ub backbone is shown as a blue tube model. Right: Candidates of residues on YUH1 proximal to Ub residues affected by the rf-irradiation. Ala, Pro, Tyr, and Leu are colored pink, red, orange, and green, respectively. (b) The residue proximal to the residues affected by the rf-irradiation on the crystal structure of Ub–YUH1.
All possible combinations of the CS-source residues were then systematically evaluated, based on the maximum distance deviation of the CS-source residues and the amide protons affected by the rf-irradiation. From the ASCS results, shown in Fig. 6c–f, we extracted two Ala residues, three Leu residues, one Tyr residue, and one Pro residue in the YUH1 surface as the CS-source residues. Since YUH1 has 10 Ala, 17 Leu, 11 Pro, and 4 Tyr residues, the number of combinations of CS-source candidates is 102×173×41×111×21 617 200. For each combination of CS-source candidates, the best relative orientation of Ub and YUH1 was then searched, so that the geometry of the selected CS-source candidate on the YUH1 structure could overlap the geometry of the amide protons on Ub affected by the rf-irradiation. The CS-source candidates were sorted by the maximum distance deviation in ascending order. As a result, the top eight among the 22 million combinations were the same candidate sets as those obtained by the aforementioned manual analysis (Igarashi et al. Reference Igarashi, Osawa, Takeuchi, Ozawa and Shimada2008).
5.5 Building a complex model satisfying the ASCS results
Based on the amino-acid residue pair list, the candidate Ub–YUH1 complex structures were coarsely generated by docking the Ub and YUH1 models, and 76 candidate complex structures with maximum deviations <6.0 Å were first generated (Kanamori et al. Reference Kanamori, Igarashi, Osawa, Fukunishi, Shimada and Nakamura2011). Subsequently, structural clustering based on the RMSD selected 42 candidate complex structures among the 76 structures, as shown in Fig. 8a. In Fig. 8a, the centers of mass of the 42 candidates of Ub are widely distributed around YUH1.
Model building of a protein–protein complex satisfying the ASCS results. (a) Initial structures for the simulated annealing calculations. Green spheres represent the centers of mass for 42 candidates of Ub. The initial structures of Ub generated from the 1st and 34th pair list are shown and colored red and blue, respectively. The YUH1 and Ub of the reference complex are shown and colored light blue and orange, respectively. The C-terminal Cα atoms of Ub are displayed as space-filled models. (b) Relationship between the EASCS values and the RMSDtotal values of Ub, determined using the simulated annealing procedure. The open circle represents the EASCS value calculated from the reference complex. The dashed line represents EASCS=15.4 kcal mol−1. (c) Complex structure of YUH1 and Ub. YUH1 and Ub of the complex with the lowest EASCS value are shown and colored blue and red, respectively. The YUH1 and Ub of the complex after equilibration in explicit water are shown and colored green and purple, respectively. Furthermore, the YUH1 and Ub of the reference complex are shown and colored light blue and orange, respectively. The YUH1 of the model complex is superimposed on the YUH1 of the reference structure.
We then developed a simulated annealing protocol incorporating a penalty function, EASCS, which is the sum of the squares of the differences between the experimentally observed and that are theoretically calculated CS values, based on the Bloch equation. This protocol was applied to generate 84 (42×2) structures. Figure 8b shows the RMSDtotal against the reference structure and the EASCS values of snapshot structures of the 84 (42×2) structural trajectories, where RMSDtotal is the RMSD value of the backbone atoms of the model Ub structure, when the model YUH1 structure was superimposed onto the reference YUH1 structure. The snapshot structures were captured every 1.0 ps. The correlation coefficient between the RMSDtotal and the EASCS value was 0.61. This result shows that RMSDtotal correlates with EASCS, and that the structure with a lower EASCS value is more probable than that with a higher EASCS value. The structure with the minimum EASCS value (EASCS=7.88 kcal mol−1) has an RMSDtotal equal to 3.05 Å, as indicated in Fig. 8b; the 3D structure is shown in Fig. 8c, as superimposed on the complex reference structure. The structure of the protein assembly was very well reproduced.
A model of protein–protein complexes can be built by incorporating the ASCS results, as the intermolecular structural constraints, within the simulated annealing protocol. Assuming that the individual structures of proteins I and II are available, the ASCS method provides the intermolecular proximal residue pairs, without side chain resonance assignments. Thus, the method is beneficial for larger systems with weak interactions, where the TCS method is applicable (Kanamori et al. Reference Kanamori, Igarashi, Osawa, Fukunishi, Shimada and Nakamura2011).
6. In situ TCS studies of biologically and medically important systems under physiologically relevant conditions
6.1 Multidomain and multisubunit proteins
Various proteins form huge multidomain and/or multisubunit structures, composed of multiple structural domains. In traditional structural studies, each single structural domain is separated, in order to decrease the size of the molecule of interest. However, their functional sites are often composed of several domains or subunits, and thus in situ structural studies of the multidomain and/or multisubunit, not isolated single ones, are required for understanding their functions. In this section, we will describe the TCS studies of the interactions between the intracellular side of G-protein-gated inwardly rectifying potassium (GIRK), which forms a homotetramer, and the multidomain protein G-protein α subunit (Gα) or the heterodimeric protein G-protein βγ subunit (Gβγ).
6.1.1 GIRK as an effector of G-proteins
GIRK ion channel is a member of the inwardly rectifying potassium ion channel (Kir) family, regulating heart rate, neuronal excitability, and other physiological events (Hibino et al. Reference Hibino, Inanobe, Furutani, Murakami, Findlay and Kurachi2010). GIRK functions as a tetramer, in which a long, 88 Å K+ permeation pathway is formed by the transmembrane (TM) and cytoplasmic pore (CP) regions (Whorton & MacKinnon, Reference Whorton and Mackinnon2011). The crystal structure of GIRK revealed two K+-ion gates: the helix bundle crossing on the cytoplasmic side of the TM region and the loops on the membrane side of the CP region, referred to as G-loops. Although the gating of Kir family proteins is generally regulated by phosphatidylinositol 4,5-bisphosphate, the opening of the GIRK gate is also triggered by the direct binding of the Gβγ. The stimulation of G-protein-coupled receptors (GPCRs) causes the exchange of GDP with GTP on Gα, which decreases the affinity of Gα for Gβγ. Gβγ then dissociates from Gα in the GTP-bound state (Gα(GTP)) and associates with GIRK, resulting in the opening of the GIRK gate (Hibino et al. Reference Hibino, Inanobe, Furutani, Murakami, Findlay and Kurachi2010). When the GPCR stimulation ends, the GTP on Gα is hydrolyzed to GDP, and then Gα in the GDP-bound state (Gα(GDP)) removes Gβγ from GIRK, resulting in the closure of the GIRK gate. Although Gβγ directly binds to and activates GIRK, Gα also plays important roles in regulating GIRK. In particular, Gα(GTP) reportedly interacts with GIRK directly, and accelerates the deactivation of GIRK (Benians et al. Reference Benians, Leaney, Milligan and Tinker2003; Berlin et al. Reference Berlin, Tsemakhovich, Castel, Ivanina, Dessauer, Keren-Raifman and Dascal2011). Altogether, it is now evident that Gα not only functions as the donor and acceptor of Gβγ but also modulates the gating properties of GIRK.
6.1.2 The Gβγ binding and conformational rearrangements of GIRK
To reveal the structural mechanism by which Gβγ-binding activates GIRK, we investigated the direct interaction between the CP region of GIRK1 (GIRKCP; residues 41–63 and 190–371 as a single polypeptide) and Gβγ (Yokogawa et al. Reference Yokogawa, Osawa, Takeuchi, Mase and Shimada2011). To identify the Gβγ-binding site on GIRKCP, TCS experiments were performed. The residues affected by the rf-irradiation were mapped on a single subunit of GIRKCP (Fig. 9a). Although the mapped residues are dispersed on a single subunit of GIRKCP, these residues formed two adjacent contiguous surfaces in the two neighboring subunits of the GIRKCP tetramer (Fig. 9b), suggesting that the two surfaces could form a single Gβγ-binding site.
Gβγ-binding interface on GIRKCP. (a) Mapping of the affected residues in the TCS experiment on a single subunit of the GIRKCP structure (PDB code 1N9P). The residues with large intensity reduction ratios and small but significant intensity reduction ratios are colored red and orange, respectively. In the surface representations (center and right), proline residues and residues with no data are colored black and gray, respectively, because they lacked CS data. (b) Mapping of the affected residues in the TCS experiment on two adjacent subunits of a GIRKCP tetramer (white and cyan), viewed from the outside (left) and the inside (right) of the pore, with the same color code as in (a). (c) Important residues for the interaction between GIRKCP and Gβγ. (Upper) Surface representations of Gα (right) and Gβγ (left), viewed from the contacting surfaces in the crystal structure of the Gαβγ complex (PDB code 1GOT). The residues involved in the intermolecular interaction between Gα and Gβγ, within a distance of 4 Å in the Gαβγ complex structure, are colored according to their side chain properties: hydrophobic, hydrophilic, acidic, and basic residues are green, yellow, red, and blue, respectively. The interacting residues between the N-terminal helix of Gα and Gβγ are labeled in gray. The important residues of Gβγ for GIRK binding, identified by mutational analyses, are labeled with asterisks. The region of the Gβγ-binding site on Gα (the Gβγ-binding motif), composed of a hydrophobic area flanked by two acidic residues, and the interacting surface on Gβγ are enclosed in circles. (Lower) The Gβγ-binding surface of GIRK, determined by TCS experiments, on the GIRKCP structure, colored according to the side chain properties. The similar Gβγ-binding motif to that found on the Gα surface in the upper panel is circled and enlarged, where the residues without TCS information are also labeled in black and blue, for the residues from one subunit colored in white and the other subunit, colored cyan, respectively.
On the other hand, the mutational analyses suggested several residues of Gβγ that are important for GIRK activation. It should be noted that most of these residues are located in the Gα-binding site, in the crystal structure of the heterotrimeric Gαβγ complex (Fig. 9c). In addition, the Gβγ-binding sites on GIRK possess surface properties similar to those on Gα. Therefore, it is tempting to speculate that GIRK binds to Gβγ in a similar manner to Gα in the crystal structure of the heterotrimeric Gαβγ complex.
The Gβγ-binding effects on GIRKCP were also investigated by chemical shift perturbation experiments, which reflect the effects of the direct binding of Gβγ as well as the conformational change of GIRKCP induced by Gβγ binding. Upon the addition of 50, 100, 200, and 400 μM Gβγ to 50 μM uniformly 2H,15N-labeled GIRKCP tetramer, no signals exhibited normalized chemical shift changes (Mulder et al. Reference Mulder, Schipper, Bott and Boelens1999; Osawa et al. Reference Osawa, Yokogawa, Muramatsu, Kimura, Mase and Shimada2009) larger than 0.05 ppm, but significant intensity reductions were observed for a number of signals.
The observed intensity reductions of the NMR signals are caused by slower tumbling, due to the increased average molecular weight of the complex of GIRKCP and Gβγ. Furthermore, the intensity reductions are induced by the chemical shift differences of GIRKCP between the free and bound states (Matsuo et al. Reference Matsuo, Walters, Teruya, Tanaka, Gassner, Lippard, Kyogoku and Wagner1999). The differences reflect the changes of the microenvironments on the Gβγ-binding site on GIRKCP, including the disruption of the fourfold symmetry of the GIRKCP tetramer, as well as the concomitant conformational changes of remote regions from the binding site.
The residues with large intensity reduction ratios seemed to be distributed widely on the molecular surface of the single subunit of GIRKCP (Fig. 10a). However, mapping on the neighboring two subunits revealed that the affected residues are clustered at the subunit interface and its surrounding regions on both the inside and the outside of the pore (Fig. 10b). The residues located on the outside of the pore reside in the Gβγ-binding site (Fig. 9b) and its proximity. The other residues are located on the inside of the pore, at the membrane side, and at other distal sites (Fig. 10b, right). In particular, the significant chemical shift perturbations observed for the residues located at the subunit–subunit interface away from the Gβγ-binding site (Fig. 10b, right) strongly suggested that the rearrangements of the four subunits are induced by Gβγ binding. Indeed, two distinct conformations of the CP region by rigid body subunit rearrangements were observed in the crystal structure of a chimeric channel of KirBac1.3, KirBac3.1, and GIRK1 (PDB code 2QKS). As shown in Fig. 10, significant chemical shift perturbations upon Gβγ binding were observed for Gly307 and Met308 on the G-loop, suggesting that the relative positions between the loops of the four subunits change upon Gβγ binding, which could result in the opening of the K+ ion gate.
Binding mode of Gβγ-and GIRK. (a) The residues with large intensity reductions and small but significant reductions upon addition of Gβγ in the chemical shift perturbation experiments, mapped on the surface of a single subunit of the GIRKCP structure and colored red and orange, respectively. Proline residues and residues with no data are colored black and gray, respectively. (b) Mapping of the residues with significant intensity reductions clustered in the interface on the outside surface of the two neighboring subunits of GIRKCP (left), and mapping of the other residues, which are not exposed to the outside surface, on two neighboring subunits of GIRKCP viewed from the inside of the pore (right), with the same color scheme as in (a). The buried residues are labeled with dashed lines. (c) Interacting residues between the CP and TM regions of the chimeric channel. (Left) Backbone structure of the chimeric channel of KirBac1.3 and GIRK1 (PDB code 2QKS). Two neighboring subunits are shown from the outside, and are colored gray and cyan, respectively. The regions lacking electron density are depicted by dashed lines. The interface between the CP and TM regions is boxed, and the residues in G-loop (the loop between the H and I strands of one subunit), proximal to those in the TM region of the same and adjacent subunits within 4 Å, are depicted by stick models. (Right, upper) Enlarged view of the interface between the CP and TM regions boxed in the left panel. The residue numbers are labeled according to those of GIRK1. (Right, lower) Schematic drawing of the interface between the CP and TM regions of the chimeric channel, shown in (b). The residue pairs within 4 Å of each other are connected by green lines. The following are the shortest distances between the inter- and intra-subunit residues: intersubunit, 4.0 Å (Phe72 (CE2) –Thr305 (CG2)), 4.0 Å (Thr73 (OG1) –Thr305 (OG1)), 3.7 Å (Ile182 (CG2) –Thr305 (O)), and 2.6 Å (Gln186 (NE2)–Thr305 (O)); and intrasubunit, 3.4 Å (Ser185 (O)–Thr306 (OG1)), 3.1 Å (Ser185 (O)–Met308 (CG)), 3.7 Å (Gln186 (NE2)–Met308 (CE)), 3.6 Å (Pro187 (CB)–Val303 (CG2)), and 3.8 Å (Pro187 (CG)–Cys310 (CB)). The positions of the Cα atoms are depicted as red dots, except for those of the residues with significant chemical shift perturbations, which are indicated as yellow dots.
6.1.3 Structural basis for the modulation of the gating properties of GIRK by Gα
In order to reveal the underlying mechanism by which Gα modulates GIRK, we performed NMR analyses of the interaction between the CP region of GIRK1 (GIRKCP-L; residues 41–63 and 190–386) and Giα i3(GTP), which accelerates the deactivation of GIRK (Mase et al. Reference Mase, Yokogawa, Osawa and Shimada2012). To identify the GIRKCP-L -binding site on Gα i3, TCS experiments were performed. The residues with large intensity reductions are located on the helical domain and the GTPase domain. The mapping of these residues on the structure of Gα revealed that the residues identified on the GTPase domain of Gα i3 are mostly clustered, indicating that this site (hereafter, referred to as the ‘α2/α3 site’) mainly contributes to the GIRKCP-L binding (Fig. 11a).
Direct interactions between GIRKCP-L and Gα i3, revealed by TCS. (a) Mapping of the affected residues in the TCS experiment from GIRKCP-L to Gα i3 is shown on the Gα structure (PDB code 1GIA). The affected residues are colored red on the Gα structure, whereas residues with no data, including proline residues, are colored black. The αA, αB, α2, and α3 helices are colored green. (b) Mapping of the affected residues in the TCS experiment from Gα i3 to GIRKCP-L on a single subunit of the GIRKCP-L tetramer. Residues 371–386 are depicted by gray tubes. The affected residues are colored red on the GIRKCP-L structure, whereas residues with no data, including proline residues, are colored black. The αA helix is colored green in the ribbon diagrams. (c) Mapping of the affected residues (colored red) in the TCS experiment on two adjacent subunits of a GIRKCP-L tetramer (white and gray), viewed from the outside (left) and the inside (right) of the tetramer.
The residues identified on the helical domain, which are distant from the α2/α3 site, do not form a contiguous surface but are located on the same side of the protein surface as the α2/α3 site, suggesting that they transiently contact GIRKCP-L. We further investigated the interactions of the helical domain with GIRKCP-L (see below).
Conversely, to identify the Gα i3-binding site on GIRKCP-L, TCS experiments observing GIRKCP-L were performed. The affected residues were mapped on a single subunit (Fig. 11b) and two adjacent subunits (Fig. 11c) of GIRKCP (PDB code 1N9P). Almost all of these residues are located on the C-terminal region, around the αA helix of GIRKCP-L (Fig. 11). Therefore, we concluded that these residues are the Gα i3-binding residues.
The interaction between the helical domain of Gα i3 and GIRKCP-L was further investigated by paramagnetic relaxation enhancement (PRE) experiments. PRE arises from magnetic dipolar interactions between the nuclear spin and the unpaired electron spin of the paramagnetic center, which enhances the relaxation of the nuclear spins, leading to the line-broadening and thus the intensity reduction of the NMR signals of the residues within about 20 Å of the spin label (Battiste & Wagner, Reference Battiste and Wagner2000; Clore & Iwahara, Reference Clore and Iwahara2009). In addition, PRE can detect a transient interaction, because the PRE effect occurs within 250–500 μs (Clore, Reference Clore2011), which is a much shorter duration than that of the CS (the effective saturation time of 200–300 ms for the TCS experiments in this study) (Matsumoto et al. Reference Matsumoto, Ueda and Shimada2010).
Figure 12a shows that the PRE effects from Hexa III-I82C-MTSL, in which the six natively existing cysteine residues that are exposed and reactive were substituted with other residues, and Ile82 was substituted by Cys and chemically modified by MTSL, were observed for 13 signals from residues within the C-terminal region of GIRKCP-L. It should be noted that most of the other residues in the C-terminal region could not be analyzed due to signal overlapping, and thus these residues might also be affected by MTSL. On the other hand, only Cys53 was detected for Hexa III-S153C-MTSL (Fig. 12b), which might be caused by the partial MTSL modification of Cys53. Since the spin label was introduced at I82C, which is at the center of the three residues identified by TCS, we concluded that the Ile82 side of the helical domain can approach within 20 Å of the C-terminal region of GIRKCP.
PRE results of the interaction between GIRKCP-L and Gα i3. Mapping of the affected residues in the PRE experiment using HexaIII-I82C-MTSL (a, left) and HexaIII-S153C-MTSL (b, left), respectively, on a single subunit of the GIRKCP-L structure. The affected residues are colored red. Proline residues and residues with no data are colored black. (Right) Mapping of the spin-labeled site of Gα i3 on the structure of Gα.
To build a model of the Gα i3-GIRKCP-L complex satisfying the NMR-derived structural information, rigid body docking was performed by using the HADDOCK program. The residues in the α2/α3 site of Gα and in the αA helix of GIRKCP-L, identified by the TCS experiments, were specified as the ‘active residues’ in the program, so that they formed the interface of the complex. Although the information about the residues on the helical domain derived from the TCS and PRE experiments was not used for the calculation, the helical domain of Gα was calculated to be proximal to the αA helix in a neighboring subunit of GIRKCP-L, probably due to the restraint of Glu242 on the subunit interface of GIRKCP-L, as determined from the TCS experiments (Fig. 13a). In this binding mode, Glu242 of GIRKCP-L at a distance from the αA helix, approaches the side chain of Glu186 of Gα i3, which accounts for its intensity reduction in the TCS experiment. Altogether, we concluded that the α2/α3 site of Gα i3 mainly recognizes the αA helix of GIRKCP-L in one subunit of the tetramer, whereas the helical domain of Gα i3 transiently approaches the αA helix in another neighboring subunit.
Proposed model of Gα(GTP) and the cytoplasmic region of the GIRK complex. (a, Left) Two adjacent subunits of a GIRKCP-L tetramer, viewed from the inside of the tetramer, are depicted by a ribbon diagram, and a homology model of Gα i3 is shown in a surface representation. The nitrogen atoms of the GIRKCP-L residues identified in the TCS experiments, and the residues with PRE effects from the MTSL modification of I82C on the helical domain of Gα i3, are shown as red and magenta balls, respectively. The α2/α3 residues of Gα i3 identified in the TCS experiments are colored blue. (Center and right) Binding model of Gα i3(GTP) and the cytoplasmic region of GIRK1 (PDB code 1N9P), obtained with the HADDOCK software. Only the two adjacent subunits of the GIRK tetramer are shown, from the inside of the tetramer. (b) Model of the Gα-GIRK-Gβγ ternary complex. (Left) The nitrogen atoms of the Gβγ-binding residues on GIRK1 are mapped as magenta balls on the complex model of Gα and the GIRK tetramer. (Right) Ternary complex model of Gα-GIRK-Gβγ. Gβ and Gγ are colored magenta and violet, respectively. The residues involved in the intermolecular interactions between Gα and Gβγ, within a distance of 4 Å in the Gα i1(GDP)β 1γ 2 (PDB code 1GP2) structure, are colored orange. (c) GIRK- and RGS-binding sites on Gα. The GIRK-binding residues identified in this study are colored red, and the residues involved in the intermolecular interaction between Gα and RGS, within a distance of 4 Å in the Gα i1(GDP/Mg2+/AlF4−) – RGS4 complex structure (PDB code 1AGR), are colored green. The overlapping residues, Lys209 and His213, are colored blue.
The mapping of the Gβγ-binding residues on the structure of the Gα-GIRK complex indicated that the binding sites of Gα i3(GTP) and Gβγ on GIRK do not overlap with each other, and therefore, Gα i3 (GTP) and Gβγ can simultaneously bind to GIRK (Fig. 13b). Furthermore, the mapping of the RGS-binding site on the structure of Gα suggested that regulator of G-protein signaling (RGS) can bind to Gα i3 in the complex with GIRK (Fig. 13c). Therefore, the Gα i/o-GIRKGβγ ternary complex model obtained here provides the structural basis for the rapid closure of the GIRK channel upon signal termination, through the efficient removal of the proximal Gβγ from GIRK.
6.2 Interactions within oligomers and aggregations
6.2.1 Oligomerization of chemokines
Chemokines are an important class of signaling molecules that activate leukocytes. Chemokine concentration gradients on endothelial layers and in the surrounding tissue provide directional cues to guide cell movement. One factor that may be vital to the establishment and maintenance of a gradient is the chemokines’ ability to oligomerize (Appay et al. Reference Appay, Brown, Cribbes, Randle and Czaplewski1999). Several studies using non-oligomerizing variants have shown that the induction of migration in vivo is dependent on oligomerization (Campanella et al. Reference Campanella, Grimm, Manice, Colvin, Medoff, Wojtkiewicz, Weissleder and Luster2006), although monomeric chemokines are capable of causing cell migration in vitro (Laurence et al. Reference Laurence, Blanpain, Burgner, Parmentier and Liwang2000).
Therefore, structural knowledge of chemokine oligomers could provide insights into the molecular mechanisms by which chemokines facilitate the recruitment and activation of leukocytes in vivo.
An oligomer interface of the CCL5 chemokine was investigated by the CS method (Wang et al. Reference Wang, Watson, Sharp, Handel and Prestegard2011). NMR and SAXS analyses revealed that the CCL5 primarily form a tetramer at pH 4.5. In order to observe the homooligomer-binding interface, 2H, 15N-labeled CCL5 was mixed with unlabeled CCL5 in a 1:3 ratio. To distinguish the monomer-monomer from dimer–dimer interfaces, the same experiment was performed for an E66S mutant, which forms the dimer exclusively. For WT CCL5, the intensities of N-terminal residues 6–8 (red in Fig. 14), 10, 15–17, 23, 26–29, 33–34, and 49–50 were highly reduced. Additional intensity changes were seen for residues 40–43 and 64–68. The decreased intensities for the N-terminal residue signals are clearly due to the interactions at the monomer–monomer interface in the dimer units, because the same residues are perturbed in the spectra of the E66S mutant. Residues 26–29, 33 and 34, and 64–68 were perturbed in the WT data only (orange area in Fig. 14), suggesting that they are in the dimer–dimer interface. On the whole, the binding interface defined by the CS experiment agreed with the tetramer model found through the SAXS/RDC grid search procedure (Wang et al. Reference Wang, Watson, Sharp, Handel and Prestegard2011). The perturbation of residues 40–43 and 48–51 can be explained by the fact that these residues are in the vicinity of the monomer–monomer interface, and may be indirectly saturated by their proximity to the interfacial residues.
Identification of the oligomer interface of CCL5 by CS experiments. Surface representation of the CCL5 tetramer model. The residues involved in the dimer–dimer contacts (residues 26–29, 33, 34, 66, and 67), and the monomer–monomer contacts (residues 6–10) are colored red and orange, respectively.
6.2.2 Formation of amyloid fibrils
β2-Microglobulin (β2m) is one of the most extensively investigated amyloidogenic proteins. In the body of a healthy individual, the β2m molecules released into the plasma are degraded by the kidneys. However, in patients on long-term hemodialysis, released β2m cannot be degraded because of the dysfunction of the kidneys, and the β2m concentration can reach 40 μg ml−1. Such a high concentration is considered to be a risk factor for the formation of amyloid fibrils (Yamamoto et al. Reference Yamamoto, Hasegawa, Yamaguchi, Goto, Gejyo and Naiki2005).
Kinetic measurements of Trp fluorescence revealed that the seed-dependent fibril extension reaction of β2m proceeds by two steps (Chatani et al. Reference Chatani, Ohnishi, Konuma, Sakurai, Naiki and Goto2010) (Fig. 15a). The first step is the association of the free monomer with the seed to form a transient monomer–seed complex (hereafter referred to as TMSC). In the next step, the conformation of the monomer converts to the final, fibril structure. The conformational conversion from the TMSC to the fibril structure is thought to be the rate-limiting step of fibril extension.
Identification of the fibril seeds-binding site in β2-microglobulin. (a) Scheme of two-step fibril formation by β2m. (b) Profiles of TCS experiments performed in the presence (blue bars) and the absence (black diamonds) of fibril. The intensity ratios of signals with and without RF irradiation (I sat/I non-sat) are plotted. The red circle indicates the residues that showed significant R 2 relaxation dispersion.
To determine which residues participate in the TMSC interactions, TCS experiments were performed, using a sample containing unlabeled fibrils and 2H,15N-labeled β2m monomers in 12.5 mM NaCl, to achieve equilibrium between the free and bound states (Yanagi et al. Reference Yanagi, Sakurai, Yoshimura, Konuma, Lee, Sugase, Ikegami, Naiki and Goto2012). The results of the TCS experiments in the presence of fibril revealed that most of the residues in the middle of the molecule, including the loop regions in the native structure, showed significant reductions in the relative intensity (I sat/I non-sat) (Fig. 15b, blue bar), indicating that these residues interact with the fibril, whereas the N-terminus is excluded from the binding site. On the other hand, the TCS experiment in the absence of fibril exhibited no significant reduction in the relative intensity (Fig. 15b, diamond). The residues with significant reduction in the TCS experiment correlated to those with significant R ex values in the R 2 dispersion experiments of β2m monomers, which reflect the exchange between partially structured and extensively unfolded forms (Fig. 15b, red circle). Considering these results and those from H/D exchange experiments in the presence of fibril, it was postulated that the extensively unfolded form is the precursor for the fibril (Yanagi et al. Reference Yanagi, Sakurai, Yoshimura, Konuma, Lee, Sugase, Ikegami, Naiki and Goto2012).
6.3 Dynamic interactions between membrane proteins and their ligand proteins
Some proteins, for example, intrinsically disordered proteins, reportedly recognize their substrates by complex multistep binding reactions (Dogan et al. Reference Dogan, Gianni and Jemth2013). TCS is applicable to the multistep recognition mode. In this section, we will describe TCS studies of the two-step binding mode of a chemokine receptor, CXCR4, and its ligand, stromal cell-derived factor-1 (SDF-1).
SDF-1 and CXCR4 participate in many essential physiological processes, such as homeostatic regulation of leukocyte traffic, hematopoiesis, and embryonic development (Nagasawa et al. Reference Nagasawa, Tachibana and Kawabata1999). SDF-1 adopts a typical chemokine fold: an unstructured N-terminus followed by a long flexible loop (N-loop), a three-stranded anti-parallel β-sheet, and an α-helix (Crump et al. Reference Crump, Gong, Loetscher, Rajarathnam, Amara, Arenzana-Seisdedos, Virelizier, Baggiolini, Sykes and Clark-Lewis1997; Gozansky et al. Reference Gozansky, Louis, Caffrey and Clore2005). CXCR4 is a member of the GPCR family, characterized by seven TM helices. In the crystal structure of CXCR4 in complex with its inhibitor, the inhibitor binds to a pocket within the TM region (Wu et al. Reference Wu, Chien, Mol, Fenalti, Liu, Katritch, Abagyan, Brooun, Wells, Bi, Hamel, Kuhn, Handel, Cherezov and Stevens2010).
A two-step/two-site binding model has been proposed for the SDF-1–CXCR4 interaction (Crump et al. Reference Crump, Gong, Loetscher, Rajarathnam, Amara, Arenzana-Seisdedos, Virelizier, Baggiolini, Sykes and Clark-Lewis1997): the SDF-1 N-loop interacts with the CXCR4 N-terminus, and subsequently the SDF-1 N-terminus interacts with the CXCR4 TM region to trigger receptor activation. However, there is no direct evidence that the SDF-1 N-terminus and the N-loop interact with structurally independent sites on CXCR4.
In order to analyze the interaction between the detergent-solubilized full-length CXCR4 and SDF-1, methyl-utilizing TCS (methyl-TCS) experiments were performed. The results revealed that the methyl resonances that were significantly affected by the rf-irradiation formed a contiguous surface, including β-sheet, 50s-loop, and N-loop, on the SDF-1 structure (Fig. 16a). In addition, the resonances from the SDF-1 N-terminal residues were also significantly affected by the rf-irradiation. These results suggested that the SDF-1 β-sheet, 50s-loop, N-loop, and N-terminus are in close proximity to CXCR4 in the complex.
CXCR4–SDF-1 interaction revealed by methyl-TCS experiments. (a) Results of the methyl-TCS experiments performed in the absence of AMD3100. The SDF-1 structure (PDB code 1VMC) is shown in a CPK representation. Isoleucine, leucine, and valine residues are colored according to the reduction ratios (RR) originating from the specific interactions, as follows. Red: RR>0.150. Light red: 0.150>RR>0.110. Orange: 0.110>RR>0.100. Cyan: RR<0.100. For the leucine and valine residues, the larger RR of their two methyl resonances was utilized. (b) Results of the methyl-TCS experiments performed in the presence of AMD3100. Red: RR>0.125. Light red: 0.125>RR>0.100. Orange: 0.100>RR>0.075. Cyan: RR<0.075. The other details are the same as in (a). (c) Schematic diagram of the two-step mechanism for the SDF-1–CXCR4 interaction. The 1st-step interaction between the SDF-1 β-sheet, 50s-loop, and N-loop, and the CXCR4 extracellular region facilitates the rapid binding and efficient anchoring of SDF-1 on the extracellular side of CXCR4. The SDF-1 N-terminus is highly dynamic even in this state, which is used to search for the binding cavities buried within the TM helices. Consequently, the 2nd-step interaction between the SDF-1 N-terminus and the CXCR4 TM region occurs, and the SDF-1 N-terminus triggers the conformational changes in the CXCR4 TM to induce G-protein signaling.
TCS experiments were also performed under conditions where the CXCR4 TM region was blocked by the CXCR4-selective antagonist, AMD3100 (Schols et al. Reference Schols, Struyf, Van Damme, Este, Henson and De Clercq1997). As a result, the resonances from the N-terminal residues were not significantly affected by the rf-irradiation in the presence of AMD3100 (Fig. 16b). Except for the N-terminus, the resonances from SDF-1 that were significantly affected by the rf-irradiation in the presence of AMD3100 are almost identical to those in the absence of AMD3100.
Considering that AMD3100 binds to the TM region of CXCR4 (Gerlach et al. Reference Gerlach, Skerlj, Bridger and Schwartz2001), these TCS experiments demonstrated that the SDF-1 N-terminus should bind to the CXCR4 TM region, whereas the other SDF-1 region should bind to the CXCR4 extracellular regions. These two interactions should occur independently, because AMD3100 could only block the interaction between the SDF-1 N-terminus and the CXCR4 TM region. Consequently, the novel structural evidence provided here strongly supports the two-step binding model, as illustrated in Fig. 16c, with the characteristic features of the two independent interactions. In the absence of AMD3100, the SDF-1–CXCR4 complex would exist equilibrium between the 1st- and 2nd-step states. In addition, the 1st-step intermediate state could be successfully mimicked by adding AMD3100, which selectively inhibits the formation of the final 2nd-step complex.
The two-step interaction would be important for the efficient binding of SDF-1, which is a relatively large GPCR ligand, to the deeply buried cavity in the CXCR4 TM region (Fig. 16c). The independent interaction between the SDF-1 β-sheet, 50s-loop, and N-loop, and the CXCR4 extracellular region should facilitate the rapid and efficient anchoring of SDF-1 near the CXCR4 TM region. Even in this 1st-step bound state, the SDF-1 N-terminus should exhibit a highly dynamic nature in the limited space. Since an unstructured protein has a large capture radius, the dynamics of the SDF-1 N-terminus would increase the efficiency for searching the space for its binding site, through the well-known ‘fly-casting’ mechanism of intrinsically disordered proteins (Wright & Dyson, Reference Wright and Dyson2009). Consequently, the SDF-1 N-terminus can effectively bind to the buried cavities within the CXCR4 TM helices, to trigger the conformational changes in the CXCR4 TM region that lead to the activation of G-protein.
6.4 Interactions between proteins and membrane proteins embedded in lipid bilayers
Membrane proteins, which are embedded in the lipid bilayers of biomembranes, have various important functions in signal transduction, transportation, and bioenergetics, and over half of the currently available drugs target membrane proteins (Rask-Andersen et al. Reference Rask-Andersen, Almén and Schiöth2011). Conventionally, membrane proteins are solubilized by detergents in traditional structural studies. However, the solubilization environments of membrane proteins can influence their structures (Zhou & Cross, Reference Zhou and Cross2013), and thus structural studies of membrane proteins embedded in a lipid-bilayer environment are important.
In this section, we will describe the TCS studies of another chemokine receptor, CCR5, reconstituted into a lipid bilayer of reconstituted high-density lipoprotein (rHDL) (Yoshiura et al. Reference Yoshiura, Kofuku, Ueda, Yokogawa, Osawa, Terashima, Matsushima and Shimada2010), and photosynthetic membrane proteins embedded in lipid bilayers of vesicles prepared from thylakoid membranes (Ueda et al. Reference Ueda, Nomoto, Koga, Ogasa, Ogawa, Matsumoto, Stampoulis, Sode, Terasawa and Shimada2012).
6.4.1 Reconstitution of CCR5 into rHDLs
CCR5, like CXCR4, belongs to the GPCR family, and the interactions between CCR5 and its chemokines, MIP-1α, MIP-1β, and RANTES (CCL5), induce chemotactic responses in CCR5-expressing leukocytes (Rajagopalan & Rajarathnam, Reference Rajagopalan and Rajarathnam2006). CCR5 is reportedly the major coreceptor for HIV-1, and its ligands are potent inhibitors of HIV infection (Berger et al. Reference Berger, Murphy and Farber1999). However, the structural basis for the interactions between CCR5 and its ligands remain poorly understood.
The methodology applied for CXCR4 was not directly applicable for CCR5, because CCR5 in detergent micelles was much less stable than CXCR4. Surface plasmon resonance (SPR) analyses revealed that the response of the conformation-dependent antibody 2D7 for CCR5 immobilized on the sensor chip was reduced to 50% after a 3 h incubation at 4°C (Fig. 17b), and was undetectable after a 24 h incubation (Fig. 17a, solid line).
Interaction between CCR5–rHDL and MIP-1α variant. (a and b) Stability of the solubilized CCR5. Normalized SPR responses for 2D7 antibody binding to CCR5 in DDM micelles, immediately after solubilization (dotted line) and after a 24 h incubation at 4°C (solid line) are shown in (a). Responses were normalized for the amount of captured CCR5. Relative values of the responses for 2D7 antibody binding of CCR5 in DDM micelles (immediately after solubilization=100%) over time are shown in (b). (c) Schematic representation of the preparation of CCR5–rHDL. CCR5 embedded in Sf9 cell membranes was solubilized, immediately reconstituted into rHDL, and subsequently purified using the His-tag and the 1D4-tag in MSP and CCR5, respectively. (d) Normalized SPR responses for the binding of the 2D7 antibody to CCR5-rHDL, immediately after preparation (dotted line) and after a 24 h incubation at 4°C (solid line). Responses were normalized for the amount of captured CCR5-rHDL. (e) SPR analyses of the interaction between the MIP-1α variant and CCR5-rHDL. Overlay plots of the sensorgrams obtained for the interaction between 0.33 and 13.2 μM of the MIP-1α variant and the immobilized CCR5-rHDL. (f) Determination of the CCR5 binding interface on MIP-1α by methyl-TCS experiments. Mapping of the affected residues in the TCS experiment with CCR5-rHDL are colored orange on the MIP-1α structure (PDB code 1B53). Glu57, whose mutations were identified in SNPs involved in HIV-1 infection, is also colored red.
Membrane proteins maintain their native conformations more stably in lipid bilayers than in detergent micelles. It has recently been reported that rHDLs, also known as nanodiscs, can accommodate membrane proteins within a 10-nm-diamter disc-shaped lipid bilayer, in a detergent-free solution (Bayburt et al. Reference Bayburt, Grinkova and Sligar2002; Nath et al. Reference Nath, Atkins and Sligar2007). rHDLs are composed of phospholipid bilayers, containing embedded membrane proteins, and membrane scaffold proteins (MSPs), which stabilize the discoidal bilayer and control its size. rHDLs are a promising resource for solution NMR studies, because of their water solubility and monodisperse character (Glueck et al. Reference Glueck, Wittlich, Feuerstein, Hoffmann, Willbold and Koenig2009; Lyukmanova et al. Reference Lyukmanova, Shenkarev, Paramonov, Sobol, Ovchinnikova, Chupin, Kirpichnikov, Blommers and Arseniev2008; Raschle et al. Reference Raschle, Hiller, Yu, Rice, Walz and Wagner2009). Therefore, it is important to reconstitute CCR5 into a lipid bilayer by using rHDLs for NMR analyses of the interaction between CCR5 and its ligand.
Due to the extreme instability of the detergent-solubilized CCR5, it was difficult to apply the general rHDL reconstitution procedure, in which the membrane proteins are first purified in detergents, and then the rHDLs are reconstructed by adding lipids and MSPs. Therefore, a novel rHDL reconstitution procedure was employed for the preparation of functional CCR5 in rHDLs (CCR5-rHDLs), as follows (Fig. 17c). The plasma membrane of the CCR5-expressing Sf9 cells was partially purified by sucrose gradient ultracentrifugation. CCR5 was solubilized by detergents and then immediately reconstituted into rHDLs, by adding MSP and removing the detergents. CCR5-rHDLs were purified by sequential affinity chromatographies, utilizing the His-tag and the 1D4 epitope-tag on MSP and CCR5, respectively. This method minimized the period during which CCR5 is in the detergent-solubilized state to as short as 90 min, by reconstituting CCR5 directly from the lysate of Sf9 cells before purification.
To examine the stability of CCR5-rHDL, we analyzed the time course of the binding activity to 2D7 by SPR (Fig. 17d). About 85% of the initial 2D7 antibody binding was retained after a 24 h incubation at 4°C.
We applied SPR to examine the binding between the monomeric P8A/F13Y/E67Q variant of MIP-1α, which was utilized for the TCS study, and CCR5-rHDLs. As a result, the responses were observed upon the addition of the MIP-1α variant to CCR5-rHDLs immobilized on the sensor chip, and the estimated dissociation constant was ∼5 μM (Fig. 17e). In addition, the activation of G proteins by CCR5-rHDLs with the MIP-1α variant was revealed by a GDP–GTP exchange assay.
The methyl-TCS experiments were performed with CCR5-rHDL and the MIP-1α variant. These results revealed that the methyl resonances derived from Val59 and Val63 are significantly affected by the rf-irradiation (Fig. 17f), suggesting that the region including MIP-1α, Val59, and Val63, which has not been investigated in previous structure–function studies, is in close proximity to CCR5 in the complex.
Several single nucleotide polymorphisms (SNPs) with non-synonymous amino-acid changes were recently identified within the MIP-1α gene, and one of the SNPs, with the E57D mutation, reportedly has a protective genetic influence on HIV-1 infection (Modi et al. Reference Modi, Lautenberger, An, Scott, Goedert, Kirk, Buchbinder, Phair, Donfield, O'BRIEN and Winkler2006). However, it was unknown how these SNPs affect the MIP-1α function. The present TCS study suggested that the protective influence on HIV-1 infection of the SNP may be due to the change in the interaction mode between CCR5 and MIP-1α, which causes the increased affinity, because Glu57 is in close proximity to Val59 and Val63. In addition, another SNP containing the V63F mutation was also reported (Paximadis et al. Reference Paximadis, Mohanlal, Gray, Kuhn and Tiemessen2009). Although this SNP has not been well characterized, it may also have a genetic influence on HIV-1 infection.
6.4.2 Interaction between photosynthetic membrane protein complexes and an electron transport protein
In photosynthetic light reactions, ATP and NADPH are produced by light-driven electron transfer from water to NADP+, mediated by proteins such as cytochrome b 6f (cyt b 6f) and photosystem I (PSI), which are thylakoid membrane-embedded protein complexes, and plastocyanin (Pc). Pc is a soluble electron carrier protein that shuttles between cyt b 6f and PSI. The heme molecules in the cytochrome f (cyt f) subunits of cyt b 6f donate electrons to the copper ions in Pc, and the chlorophyll molecules, P700, in the PsaA and PsaB subunits of PSI accept electrons from Pc. Pc rapidly cycles through the following steps: binding to cyt b 6f, accepting an electron from cyt b 6f, dissociating from cyt b 6f, binding to PSI, donating an electron to the photo-excited PSI, and then dissociating from PSI. These electron transport reactions are important in plant growth (Chida et al. Reference Chida, Nakazawa, Akazaki, Hirano, Suruga, Ogawa, Satoh, Kadokura, Yamada, Hakamata, Isobe, Ito, Ishii, Nishio, Sonoike and Oku2007).
Pc forms separate electron transfer complexes with PSI and cyt b 6f, and the distances between their reaction centers are sufficiently short to accomplish their electron transfer reactions in <10−4 s (Hope, Reference Hope2000). In addition, the Pc–PSI and Pc–cyt b 6f electron transfer complexes rapidly associate and dissociate, at rates of ∼108 M−1 s−1 and ∼103 s−1, respectively. The formation of such rapidly associating and dissociating electron transfer complexes facilitates efficient electron transport (Busch & Hippler, Reference Busch and Hippler2011).
Mutational analyses of Pc revealed that the residues in the hydrophobic patch that surrounds the copper ion, and those in the acidic patch located adjacent to the hydrophobic patch, are reportedly important for Pc–PSI and Pc–cyt b 6f electron transport in eukaryotic plants (Fig. 18a) (Hope, Reference Hope2000). PSI and cyt b 6f from eukaryotic plants contain several hydrophobic residues surrounding P700 and the heme in cyt f, respectively, and clusters of basic residues located adjacent to the hydrophobic residues. These residues in PSI and cyt b 6f also participate in electron transport, based on mutational analyses (Busch & Hippler, Reference Busch and Hippler2011; Hope, Reference Hope2000). However, the roles of these residues in the rapid turnover of Pc remain unknown.
Determination of the interface residues of Pc for cyt b 6f or PSI by TCS. (a) Distribution of the hydrophobic and acidic patches in spinach Pc (PDB code 1YLB). The surface of Pc is transparent, and the copper atom and the ribbon diagram are simultaneously displayed. The residues in the hydrophobic and acidic patches that were proposed to be responsible for the electron transport in previous mutational analyses are labeled, and colored green and red, respectively. (b,g) TCS experiments with excess amounts of Pc relative to (b,c) PSI and cyt b 6f embedded in thylakoid vesicles, (d,e) solubilized PSI, or (f,g) solubilized b 6f. Panels (b), (d), and (f) are schematic diagrams of the experiments. Panels (c), (e), and (g) are maps of the residues affected by the rf-irradiation in the TCS experiments. The residues with signal intensity reduction ratios >0.3 and within the 0.2–0.3 range are colored red and pink, respectively. Proline residues and residues with intensity reductions that were not determined, because of low signal intensity or spectral overlap, are white. The surface of Pc is transparent, and the copper atom and the ribbon diagram are simultaneously displayed. The molecular diagrams were generated with Web Lab Viewer Pro (Molecular Simulations, Inc.).
Therefore, we performed TCS experiments to identify the residues of Pc in close proximity to PSI and/or cyt b 6f embedded in the thylakoid vesicles, in which the Pc-binding sites of PSI and cyt b 6f are exposed to the solvent (Ueda et al. Reference Ueda, Nomoto, Koga, Ogasa, Ogawa, Matsumoto, Stampoulis, Sode, Terasawa and Shimada2012). Based on the spectra with and without irradiation, we calculated the reduction ratios of the peak intensities. The affected residues formed a continuous surface on the hydrophobic patch of Pc (Fig. 18b and c).
In order to observe the Pc–PSI and Pc–cyt b 6f interactions separately, we also performed the TCS experiments using detergent-solubilized PSI and cyt b 6f from spinach thylakoid membranes. These results showed that the affected residues formed a continuous surface on the hydrophobic patch of Pc (Fig. 18d–g).
These TCS experiments revealed that the acidic patch of Pc is not close to either PSI or cyt b 6f in the electron transfer complexes. In the TCS experiments using vesicles, no detergents were employed, and therefore no decomposition of the subunits of PSI and/or cyt b 6f caused by detergents occurred.
According to the classification proposed by Kumar and Nussinov, an ion pair is defined as a salt bridge if the side-chain charged group centroids and at least one pair of side-chain nitrogen and oxygen atoms are within 4 Å (Kumar & Nussinov, Reference Kumar and Nussinov2002). The definition of a stable salt bridge is based on the distance between the side-chain atoms, whereas the distances between the main chain amide protons of Pc and the protons of PSI or cyt b 6f are reflected in the TCS experiments. However, our statistical analyses of the salt bridge structures revealed that most of the stable salt bridges could be identified by the TCS experiments, and thus the acidic patch residues of Pc do not form stable salt bridges with either PSI or cyt b 6f in the electron transfer complexes.
The previously reported mutational analyses, cross-linking studies, and ion strength dependencies of the Pc–PSI and Pc–cyt b 6f electron transport rates showed that the acidic patch residues of Pc and the basic residues of PSI and cyt b 6f are responsible for the Pc–PSI and Pc–cyt b 6f electron transport reactions (Busch & Hippler, Reference Busch and Hippler2011; Hope, Reference Hope2000). Therefore, the acidic patch of Pc may increase its local concentration around PSI and cyt b 6f, thus facilitating the rapid formation of the electron transfer complex by occasionally forming dynamic salt bridges or long distance ion pairs (Fig. 19a–d). Most of these loose electrostatic interactions would not contribute to the complex stabilization or be observable in the present TCS experiments. The absence of stable salt bridges in the acidic patch is in agreement with the rapid dissociation of the complexes.
Schematic views of the interaction modes in the Pc–PSI and Pc–cyt b 6f complexes.
6.5 Interactions between proteins and phospholipids embedded in lipid bilayers
Lipid bilayers are essential to provide barriers to separate cellular components from the external environment and to form subcellular structures, such as the nucleus, within cells. Lipid bilayers are also involved in cell metabolomics and/or signal transduction, by providing an ideal environment for membrane-embedded proteins. In addition, the lipids embedded in the bilayer membrane directly participate in the physiological functions of cells. Phosphatidylinositol is especially important among the lipid components in the bilayer membrane, as it is the precursor of a family of lipid second-messengers, known as phosphoinositides (PIs). PIs differ in the phosphorylation status of their inositol group, and play crucial roles in different physiological processes, including cell signaling, intracellular membrane trafficking, cell growth/survival, and cytoskeletal organization, through specific interactions with their effector proteins (Balla, Reference Balla2013; Simonsen et al. Reference Simonsen, Wurmser, Emr and Stenmark2001).
Specific recognition of PIs by PI-binding domains in effector proteins is fundamental for their cellular functions. To date, a number of distinct, PI-binding motifs have been identified and characterized including the epsin amino-terminal homology (ENTH) domain, the Fab1, YOTB, Vac1, and EEA1 (FYVE) domain, the band 4.1, ezrin, radixin and moesin (FERM) domain, the pleckstrin homology (PH) domain and the phox homology (PX) domain (Cullen et al. Reference Cullen, Cozier, Banting and Mellor2001; Hurley & Meyer, Reference Hurley and Meyer2001). These PI-binding domains are found in a diverse array of multidomain proteins, and they recruit their host protein to specific regions in cells via their interactions with PIs. In addition to the spatial and temporal organization of PI signaling, these domains also serve as allosteric regulators of enzyme activity and protein–protein interactions.
Under physiological conditions, PIs interact with effector proteins in the context of lipid bilayers. Thus, the interactions of PI-binding proteins with the PI-containing phospholipid bilayer are not simply the recognition of the head groups of PIs, and the surrounding phospholipid-bilayer environments functionally contribute to the interactions. In fact, the ability of the actin regulatory protein N-WASP to sense the PIP2 density in the membrane was lost when soluble PIP2 or IP3 head groups were used instead of PIP2 embedded in the lipid bilayer (Papayannopoulos et al. Reference Papayannopoulos, Co, Prehoda, Snapper, Taunton and Lim2005). In addition, the lipid components and the lengths of the acyl chain have been shown to significantly affect the affinity of PH domain to phosphotidylinositol-4-phosphate (PI4P) (Lenoir et al. Reference Lenoir, Coskun, Grzybek, Cao, Buschhorn, James, Simons and Overduin2010). Thus, the detergent micelles that are commonly used as membrane mimetics would not be suitable for studying the PI-binding proteins. In addition, their significant curvature is completely different from the planer bilayer structure, and thus may even cause the denaturation of the target protein.
Toward this end, it is essential to use a PI-embedded lipid bilayer for structural studies of PI-binding proteins. It should also be noted that the lipid-bilayer environment is important for interactions of lipid-binding proteins that recognize other lipid components. TCS is an ideal method to analyze the protein–lipid interactions in a bilayer environment, and a few of examples have already proven its applicability to lipid-bilayer systems (Nakamura et al. Reference Nakamura, Takahashi, Takeuchi, Kohno, Wakamatsu and Shimada2005; Takeuchi et al. Reference Takeuchi, Takahashi, Sugai, Iwai, Kohno, Sekimizu, Natori and Shimada2004). In this section, we will describe three recent applications of TCS to the interactions between PI-binding proteins and PI-embedded lipid bilayers, which contributed toward the elucidation of the structural basis of cellular functions mediated by PI.
6.5.1 Interaction of the ceramide transporter (CERT) PH domain with PI4P-embedded membrane
In mammalian cells, a de novo synthesized ceramide in ER membranes is transported to the Golgi in a non-vesicular manner by an ER-to-Golgi-specific CERT (Hanada et al. Reference Hanada, Kumagai, Yasuda, Miura, Kawano, Fukasawa and Nishijima2003). CERT is a cytoplasmic 68-kDa protein, and its N-terminal PH domain specifically recognizes PI4P in membranes. Since PI4P is the most abundant and preferentially distributed PI in trans-Golgi membranes, it is assumed that the PH domain is required for the efficient association of CERT with the Golgi membrane (Hanada et al. Reference Hanada, Kumagai, Yasuda, Miura, Kawano, Fukasawa and Nishijima2003; Kawano et al. Reference Kawano, Kumagai, Nishijima and Hanada2006). However, the detailed mechanism by which the CERT PH domain interacts with PI4P in the Golgi membrane, to exert the transportation activity, remain unclear. To clarify the structural basis of the PI4P interaction by the CERT PH domain in the Golgi membrane, we determined the structure of the CERT PH domain, and separately identified the interaction sites for the PI4P head group and the Golgi membrane in the CERT PH domain (Sugiki et al. Reference Sugiki, Takeuchi, Yamaji, Takano, Tokunaga, Kumagai, Hanada, Takahashi and Shimada2012).
The determined structure of the CERT PH domain (residues 23–117) revealed that the basic residues are clustered in the middle of the molecule, forming a basic groove around the protruding part of the β1/β2 region on the surface of the CERT PH domain (Fig. 20a and b). The site that interacts with the head group of PI4P on the CERT PH domain was mapped onto the tertiary structure of the CERT PH domain by chemical shift perturbation experiments, using a soluble form of PI4P (diC4–PI4P). The mapping clearly defined a phosphatidylinositol phosphate-binding pocket in the CERT PH domain (Fig. 20b), which shares the common phosphatidylinositol phosphate-binding site with the other PH domains (Lemmon, Reference Lemmon2008). However, the affinity of the CERT PH domain for the soluble form of PI4P was quite weak (K D: ∼0.76 mM), as compared to its affinity for the PI4P-embedded Golgi-mimetic liposomes (K D: ∼3 μM). This indicated that the additional interactions between the CERT PH domain and the PI4P-embedded membrane are essential to maintain sufficient affinity for the membrane trafficking function of CERT.
Interaction of CERT PH domain with PI4P-embedded membrane. (a) Ribbon representation of the CERT PH domain, with magnification of the basic groove. The side chains of the basic and aromatic residues in the basic groove and the protruding part of the β1/β2 region are displayed as blue and green sticks, respectively. (b) Electrostatic potential surface of the CERT PH domain. Negative and positive electrostatic surfaces are colored red and blue, respectively. (c) Mapping of the residues that were significantly perturbed by the titration of diC4–PI4P on the surface representation of the CERT PH domain structure. The side chains of the residues with Δδ>0.2 and 0.1–0.2 ppm chemical shift perturbation are indicated by red and orange surfaces, respectively. (d) Schematic representation of the TCS experiment using PI4P-embedded liposomes. The proton resonances originating from the lipid head group were saturated by radiofrequency irradiation, and this saturation was transferred to the residues in the CERT PH domain that were proximal to the PI4P-embedded liposome. (e) Mapping of the residues affected by the TCS on the surface of the CERT PH domain. The side chains of the residues with signal intensity reduction ratios >0.4 and 0.3–0.4 are indicated by red and orange surfaces, respectively. (f) Proposed mechanism of PH domain-mediated CERT translocation to the Golgi apparatus. I, Unbound state of the CERT PH domain. II, Weakly bound CERT PH domain. A non-specific electrostatic interaction occurs between the basic groove in the CERT PH domain and the surface of the phospholipid membrane. III, Orientation of the CERT PH domain for high affinity interaction. The specific high affinity interaction with the PI4P-embedded membrane is shown.
Therefore, we performed TCS experiments with CERT PH domain and the PI4P embedded Golgi-mimetic liposomes, to identify the additional membrane-interaction site in the CERT PH domain (Fig. 20c). The mapping of the residues affected by the rf-irradiation indicated that the membrane interaction surface of the CERT PH domain extends through the entire region of the basic groove, including the PI4P-binding site (Fig. 20d). Based on these observations, we proposed a model that describes the PH domain-mediated Golgi association of the CERT protein (Fig. 20e). The initial membrane association of the CERT PH domain might be driven by a non-specific electrostatic interaction between the basic groove and the phospholipid membrane. The interaction using the basic groove would optimally orient the protruding membrane insertion β1/β2 loop of the CERT PH domain toward the bilayer normal, which would be suitable for the efficient recognition of PI4P in the membrane. In addition, the protruding membrane insertion β1/β2 loop contains multiple aromatic/hydrophobic residues (Fig. 20a), and thus, it would be optimally located deeper in the membrane. Unlike other PH domains that show greater contributions of specific PI recognition in the binding, the specific PI4P-binding and non-specific phospholipid membrane interactions contribute almost equally to the binding of the CERT PH domain to PI4P-embedded liposomes. Indeed, immunofluorescence microscopy experiments using HeLa cells verified the Golgi mislocalization of the CERT with a mutation in the PI4P-binding pocket or the non-specific basic groove. Thus, the multistep interaction model revealed by the TCS methods is crucial for the membrane trafficking activity of CERT, and clearly confirms the methodological advantage of this NMR method.
6.5.2 Atypical membrane-embedded PI(3,4)P2-binding site on p47phox PX domain
An interaction analysis of the PI-embedded lipid-bilayer membrane by TCS also revealed the unique PI-binding site in the p47phox PX domain (Stampoulis et al. Reference Stampoulis, Ueda, Matsumoto, Terasawa, Miyano, Sumimoto and Shimada2012). Both p47phox and p40phox are pivotal components of the phagocyte NADPH oxidase, which is a multicomponent enzyme that produces reactive oxygen species (ROS) as a defense against invading microorganisms. p47phox and p40phox contain PX domains, which are crucial for the recruitment of cytosolic components and the activation of NADPH oxidase (Ago et al. Reference Ago, Takeya, Hiroaki, Kuribayashi, Ito, Kohda and Sumimoto2001, Reference Ago, Kuribayashi, Hiroaki, Takeya, Ito, Kohda and Sumimoto2003). While the p40phox PX domain specifically binds to PI3P, the p47phox PX domain reportedly binds to PI(3,4)P2, PA, and PtdSer (Sato et al. Reference Sato, Overduin and Emr2001).
The crystal structure of p40phox in complex with diC4–PI3P has been solved (Bravo et al. Reference Bravo, Karathanassis, Pacold, Pacold, Ellson, Anderson, Butler, Lavenir, Perisic, Hawkins, Stephens and Williams2001) (Fig. 21a), and the 3D structures of p47phox PX alone have been determined by solution NMR (Hiroaki et al. Reference Hiroaki, Ago, Ito, Sumimoto and Kohda2001) and X-ray crystallography (Karathanassis et al. Reference Karathanassis, Stahelin, Bravo, Perisic, Pacold, Cho and Williams2002). However, the structure of p47phox PX in complex with its ligand has not been reported. The crystal structure of its free form revealed two sulfate molecules bound in two distinct sites (Karathanassis et al. Reference Karathanassis, Stahelin, Bravo, Perisic, Pacold, Cho and Williams2002) (Fig. 21b). One of the sulfates is at the C-terminal end of the β3 strand (Fig. 21b), which coincides with the three-phosphate of the bound PI3P in the crystal structure of p40phox PX (Fig. 21a). The second sulfate is on the surface composed of the α1 helix and the adjacent loop that leads to the distorted left-handed PPII helix. Based on these results and SPR-based mutational analyses, the first sulfate-binding site was proposed to be the PI(3,4)P2-binding site, and the second sulfate-binding site was considered to be the PA-binding site. However, there are no direct structural data that have specified the PI(3,4)P2-binding site as well as the PA and PtdSer-binding sites in p47phox PX. Thus, it was unclear whether these sulfate-binding sites of p47phox PX are the actual ligand-binding sites, and the structural basis of the broad ligand specificity of p47phox PX remained enigmatic.
Interaction of p47phox PX domain with PI(3,4)P2-embedded membrane. (a) Ribbon representation of the p47phox PX domain. The bound diC4–PI3P2 is displayed in a ball-and-stick representation. (b) Left: Ribbon representation of the p47phox PX domain, with mapping of residues displaying strong intensity reductions in the TCS experiment with PI(3,4)P2-containing liposomes. Right: Mapping of residues displaying strong intensity reductions in the TCS experiment with PI(3,4)P2-containing liposomes on the surface of the crystal structure of p47phox PX. Residues are color-coded according to their intensity reduction (IR), with red for strong (IR>0.3) and orange for moderate (0.25<IR<0.3) reduction. The bound sulfates are shown in a ball-and-stick representation. (c) Schematic representation of the TCS experiment using PI(3,4)P2-embedded liposomes. The proton resonances originating from the lipid head group were saturated by radiofrequency irradiation, and this saturation was transferred to the residues in the p47phox PX domain that were proximal to the PI(3,4)P2-embedded liposome. (d) Mapping of residues displaying strong diC4–PI(3,4)P2-induced chemical shift perturbations onto a ribbon representation of the crystal structure of the p47phox PX domain. Normalized chemical shift changes were calculated based on the equation Δδ=((ΔδH)2+(ΔδN/5)2)1/2. Residues that showed strong (Δδ>0.2 ppm) and moderate (0.12 ppm<Δδ<0.2 ppm) normalized chemical shift changes are colored red and orange, respectively.
We applied the TCS experiments to identify the interacting interface of the p47phox PX domain to PI(3,4)P2-embedded liposomes (Stampoulis et al. Reference Stampoulis, Ueda, Matsumoto, Terasawa, Miyano, Sumimoto and Shimada2012) (Fig. 21c). The residues affected by the rf-irradiation coexisted in a well-defined area on the surface of the p47phox PX domain (Fig. 21b). This area is outlined by helix α1, helix α1’, and the following loop that leads to the distorted, left-handed PPII helix, which clearly indicated the interacting interface of the p47phox PX domain with the PI(3,4)P2-embadded membrane near the second sulfate-binding site. In vitro and in vivo mutational analyses corroborated these results. The interface determined for PI differs from those of all of the PX domains elucidated so far, including the p40phox PX domain.
It is notable that the chemical shift perturbation area on p47phox PX, caused by the addition of diC4-PI(3,4)P2, is larger than the PI-binding site determined by the TCS experiments, and includes residues in the site that corresponds to the PI3P-binding site of p40phox PX (Fig. 21d). Considering that chemical shift perturbation is induced by both the direct binding effects and conformational changes (Takeda et al. Reference Takeda, Terasawa, Sakakura, Yamaguchi, Kajiwara, Kawashima, Miyasaka and Shimada2003), the perturbation of the residues in the site that corresponds to the PI3P-binding site of p40phox PX would be a secondary effect, due to a conformational change. Thus, these results confirmed the significant advantage of the TCS experiments, which led to the correct identification of the p47phox PX domain interaction with membrane-embedded PI(3,4)P2.
6.5.3 Remarks for structural analyses of membrane-associating proteins by TCS
We have used liposomes, which provide the physiological characteristic of a cellular membrane, for our NMR studies. However, liposomes are not always amenable for conventional solution NMR studies because they can be quite unstable and precipitate, depending on the lipid composition. In this regard, Yokogawa et al. (Reference Yokogawa, Kobashigawa, Yoshida, Ogura, Harada and Inagaki2012), utilized rHDLs, which have been proved to be useful for the stable reconstitution of membrane proteins by various groups (Gluck et al. Reference Gluck, Wittlich, Feuerstein, Hoffmann, Willbold and Koenig2009; Hagn et al. Reference Hagn, Etzkorn, Raschle and Wagner2013; Raschle et al. Reference Raschle, Hiller, Yu, Rice, Walz and Wagner2009; Ritchie et al. Reference Ritchie, Grinkova, Bayburt, Denisov, Zolnerciks, Atkins and Sligar2009; Shenkarev et al. Reference Shenkarev, Lyukmanova, Paramonov, Shingarova, Chupin, Kirpichnikov, Blommers and Arseniev2010; Yoshiura et al. Reference Yoshiura, Kofuku, Ueda, Yokogawa, Osawa, Terashima, Matsushima and Shimada2010), for their NMR study of the interaction between the FYVE domain of early endosome antigen 1 (EEA1), denoted as EEA1 FYVE domain, and PI3P-embedded in rHDL (Fig. 22a). As discussed above, rHDLs are composed of a lipid bilayer in which the hydrophobic edge is sealed by a pair of engineered human apolipoprotein A-I (apoA-I). Due to their high solubility in water, variability in lipid composition, and lipid bilayer characteristics, rHDLs are also suited to structural studies of membrane–protein interactions in water.
Interaction of EEA1 FYVE domain with PI3P-embedded rHDL. (a) Schematic representation of the TCS experiment using PI3P-embedded rHDL. The proton resonances originating from the lipids were saturated by radiofrequency irradiation, and the saturation was transferred to the residues in the EEA1 FYVE domain that were proximal to the PI3P-embedded rHDL. (b) Mapping of the residues affected by the TCS on the surface of the EEA1 FYVE domain. Residues with differences in the reduction ratio (ΔRR) values larger than 0.10, and within the 0.06–0.10 range are indicated by red and orange surfaces, respectively. The ΔRR value was calculated by the following equation: ΔRR=RRPI3P–rHDL−RRPI-free–rHDL, where RRPI3P–rHDL and RRPI-free–rHDL were obtained from (I unsat−I sat)/I unsat in the presence of PI3P–rHDL and PI-free rHDL. (c) Model for the complex of EEA1 FYVE domain bound to PI3P-embedded in the membrane. The residues on the EEA1 FYVE domain affected in both the TCS and PRE (green), only in TCS (blue), and only in PRE (yellow) experiments are mapped on the surface of EEA1 FYVE domain. The Ins(1,3)P2 bound to EEA1 FYVE is depicted by a stick model, and the residues that were not analyzed in either TCS or PRE experiments are colored black. Lipid molecules within the membrane are schematically shown, with the phosphate and choline head groups depicted as orange and blue spheres, respectively.
In the TCS experiment using the PI3P-rHDLs, the residues affected by the rf-irradiation were mostly located on a specific side of EEA1 FYVE domain (Fig. 22b). Based on the results of TCS analyses, the model of EEA1 FYVE bound to a PI3P-embedded membrane was constructed (Fig. 22c). The authors also used PI3P-rHDLs containing 1,2-dipalmitoyl-sn-glycero-3-phopho(tempo)choline (TEMPO-PC) for a PRE study. The results from the TCS and PRE experiments are largely consistent with each other, and thus PRE can be used as an orthogonal method to confirm the TCS results. The PRE results would be sensitive to the position of TEMPO introduced with the membrane, and it should be carefully noted that TEMPO-PC can unevenly distributed in the rHDLs, due to its rather bulky head group. Nevertheless, it is evident that rHDL can be used as an alternative membrane system for analyses of membrane-protein interactions by the TCS method.
The different patterns of PI recognition between p47phox PX and p40phox PX, despite their similar overall structures, underscore the feat that substitutions of the key residues on the surface of the PI-binding domain can significantly alter its function. It was also shown that a few mutations can completely change the specificity and binding modes of the p47phox PX domain (Stampoulis et al. Reference Stampoulis, Ueda, Matsumoto, Terasawa, Miyano, Sumimoto and Shimada2012), and thus the direct determination of the binding interfaces by structural biological methods is crucial for understanding the function of PI-binding proteins. In addition, the functional interactions of the PI-binding domains are not solely dependent on specific PI-binding. Non-specific phospholipid membrane interactions were equally important for functional PI-binding by the CERT PH domain (Sugiki et al. Reference Sugiki, Takeuchi, Yamaji, Takano, Tokunaga, Kumagai, Hanada, Takahashi and Shimada2012). This might be true for other membrane-associating proteins as well. Currently, NMR techniques are the only structural method to access these interactions at the membrane interface with atomic-resolution. For these purposes, TCS would be the method of choice, due to its accuracy in determining the interfaces of inhomogeneous systems.
6.6 Interactions of proteins in living cells
Investigations of protein–protein interactions inside living cells are crucially important for understanding the biological events actually occurring within the intracellular environment, where the total protein concentration exceeds 200 mg ml−1. To achieve this goal, several ‘in-cell’ NMR methods have been developed to introduce isotopically labeled molecules within living cells (Ito & Selenko, Reference Ito and Selenko2010). Our group reported an in-cell NMR method for mammalian cells, using a pore-forming toxin, streptolysin O (SLO), to introduce target proteins by diffusion (Ogino et al. Reference Ogino, Kubo, Umemoto, Huang, Nishida and Shimada2009) (Fig. 23a).
Determination of binding sites in CG1 for endogenous MTs by in-cell TCS. (a) Schematic representation of the method to introduce the target proteins into mammalian cells by SLO. (b) Schematic of the gel-encapsulated bioreactor system for the long-term in-cell NMR measurements. (c) Time-dependent changes of intracellular ATP concentration monitored by 31P NMR signals of the β P atom of ATP, with (red) and without (blue) the bioreactor. The medium injection was stopped at 5 h (arrow). The error bar is based on the signal-to-noise ratio for each spectrum. (d) The results of the in-cell TCS experiments, mapped on the CG1 structure (PDB code, 2CP5) according to the intensity reduction ratio. Red and light green spheres indicate intensity reduction ratios greater or less than 0.5, respectively, and black spheres represent methyl groups for which TCS data were unavailable. (e) The putative MT-binding region of CG1 indicated by a previous in vitro study. Hydrophobic and basic residues are colored green and blue, respectively.
To perform TCS experiments inside living cells, it is necessary to perform in-cell NMR measurements longer than those just for signal detection. However, the major limitation of the in-cell NMR experiments is the occurrence of cell death during the NMR measurement. To suppress the cell death during NMR measurements, we developed a bioreactor for in-cell NMR spectroscopy (Kubo et al. Reference Kubo, Nishida, Udagawa, Takarada, Ogino and Shimada2013) (Fig. 23b). In this bioreactor, the cells are encapsulated within Mebiol gel, which thermoreversibly forms the gel state at temperatures above 25°C, and fresh culture medium is supplied continuously to the bottom of a 5 mm NMR tube, through a glass capillary. By using a Pasteur pipette, we prepared the Mebiol gel as a coil-shaped string, so that the exchange of the medium and the removal of the leaked protein would be efficient. The effectiveness of the bioreactor was demonstrated by monitoring the time-dependent changes of the ATP concentration inside the HeLa S3 cells by 31P NMR spectroscopy. In the absence of the bioreactor, the signals derived from the three phosphate groups of ATP completely disappeared after a 30 min incubation period (Fig. 23c), suggesting that the intracellular ATP was entirely depleted within 30 min. In contrast, for the 31P NMR spectra acquired in the presence of the bioreactor, the signal intensity of the ATP remained almost constant during the 5 h of measurement, and then rapidly declined when the injection of the medium was stopped (Fig. 23c). Therefore, it was demonstrated the gel-encapsulated bioreactor system can maintain the cells in a metabolically active state during in-cell NMR measurements over a long period of time.
Using this established bioreactor system, in-cell TCS experiments were performed to identify the binding interface of externally introduced CG1, which is the 9 kDa microtubule (MT)-binding domain of CLIP-170, with the endogenous MTs, which are present in the cytoplasm at concentrations greater than 20 μM. In-cell TCS measurements was performed for 5.5 h using the bioreactor. A comparison of the ratios of intensity reduction of the signals in the presence and absence of RF irradiation revealed that Leu77, Ile90, Leu92, Val103, and Ile117 were significantly affected (Fig. 23d). The residues significantly affected by the rf-irradiation are localized on the same side of the CG1 structure, and are consistent with the MT-binding region of the CG domains of CLIP-170 that was identified in the in vitro study (Mishima et al. Reference Mishima, Maesaki, Kasa, Watanabe, Fukata, Kaibuchi and Hakoshima2007) (Fig. 23e). Therefore, it was demonstrated that the in-cell TCS method can identify the binding site of an externally introduced protein for the endogenous macromolecules, which are difficult to reconstitute in an in vitro system.
7. Conclusions and outlook
The CS and TCS methods enable the precise identification of the interfaces of protein–protein complexes, and thus are useful for the construction of accurate protein–protein complex models. TCS is applicable to huge (>150 kDa) and heterogeneous complexes under fast exchange conditions, and thus in situ studies of biologically and medically important systems under physiologically relevant conditions can be accomplished by TCS. Further increases in the sensitivity and the speed of the NMR data acquisition are desired for TCS studies of the targets with low yields and stabilities.
8. Acknowledgements
This work was supported in part by grants from the Japan New Energy and Industrial Technology Development Organization (NEDO) and the Ministry of Economy, Trade and Industry (METI), and by a Grant-in-Aid for Scientific Research on Priority Areas from the Japanese Ministry of Education, Culture, Sports, Science and Technology (MEXT).