

1 Introduction
Agricultural policy in developing countries has gradually shifted for more than 30 years. Previously, governments in several developing countries heavily imposed tax and control programs on agricultural exports in order to accrue revenues from the agricultural sector and transfer them to other economic sectors (Anderson, Reference Anderson and Anderson2009; Bates, Reference Bates1981). They set higher rates of protective tariffs in order to protect domestic industry from international competition. Having subsidized domestic industry and urban consumers, the governments set the commodity price floor much below the global one in order to control for food price increases in the domestic market. While taxing agricultural exports and setting a low price floor were implemented to help the industrial and urban sectors, the policy negatively affected the farmers that had to bear the tax burdens transferred to them.Footnote 1 As importers of agricultural equipment and fertilizers, the farmers were negatively affected by the higher protective tariffs in that they had to bear a higher cost of imported equipment. The state intervention in agriculture was indeed against the producers’ interests.
Nonetheless, agricultural policy in several developing countries has gradually become more liberal since the 1980s. Agricultural export taxes have been greatly reduced or even abolished. Export restrictions and consumer subsidy programs have been out of fashion in that the government has implemented them less frequently. The governments in several developing countries are likely to employ price guarantee and fertilizer-subsidy programs to subsidize farmers. Seemingly, the state intervention during these years is less likely to discriminate against the producers’ interests than the intervention in the past.
Scholars have examined the factors that have contributed to the agricultural policy shift in developing countries, and some have argued that developing countries have abandoned agricultural taxes because their economies have depended less on revenues from agricultural exports (Anderson and Martin, Reference Anderson and Martin2009; Varshney, Reference Varshney1995). In other words, when the countries have become more industrialized, laborers have migrated from the agricultural sector to its industrial counterpart. Thus, the number of agricultural producers (i.e., farmers) has become smaller and the government has imposed fewer taxes on the farmers (Anderson and Hayami, Reference Anderson and Hayami1986; Swinnen, Reference Swinnen1994). Others argue that international organizations have pressured the governments to reduce or abolish the tax barrier in order to receive financial assistance (Anderson, Reference Anderson and Anderson2009). Meanwhile, political scientists argue that political regime types have an influence on agricultural tax policy in terms of whether the policy is likely to be abandoned or increased (Binswanger and Deininger, Reference Binswanger and Deininger1997; Kasara, Reference Kasara2007).
In this paper, which investigates agricultural policy in industrializing Southeast Asian countries, we examine the relation between political and economic conditions and the agricultural policy shifts (i.e., rate of revenue transfer to (or from) agriculture). We argue that autocratic regimes are likely to impose more tax and control programs on agriculture than their democratic counterparts. Elected officials have a political incentive to reduce tax rates on agriculture in order to appeal to organized agricultural interests, such as the agricultural industry or farmers’ associations. Another argument is that an increase in exports (i.e., high percentage rate of trade openness) contributes to the existence of fewer tax and control programs in the sector. A government is likely to reduce or even abandon tax barriers in order to generate export growth by encouraging industry and businesses to export more commodities.
This paper is organized as follows. The second section discusses the relation between the political regimes, trade policy, and agricultural policy in developing countries. The third and fourth sections introduce the main hypotheses, data, and models. To examine the impact of political regimes and trade expansion on agricultural taxes, we employ the fixed-effects ordinary least squares (OLS) and the Driscoll–Kraay standard error correction models for the panel data. The fifth section presents the findings and discusses the results, while the sixth section concludes the paper.
2 Dynamics of agricultural policy, trade policy, and political regimes in developing countries
From the 1950s to the 1970s, most of the governments in developing countries were more likely to implement policies which discriminated against farmers’ interests. First, they usually employed different types of taxes to accrue revenues from agricultural exports, which were the major sources of the countries’ incomes. The revenues were more likely to be transferred to the government agencies and programs. For instance, Bates (Reference Bates1981) pointed out that most African politicians were likely to use the revenues from exports to finance their public-relation programs and to subsidize the state enterprises. In Thailand, the revenues from rice export taxes (i.e., rice premiums) were transferred to subsidize the government's agricultural extension programs for other crops (especially import-competing ones) (Siamwalla and Setboonsarng, Reference Siamwalla, Setboonsarng, Krueger, Schiff and Valdes1991).
Second, the government was likely to set agricultural commodity prices much below the price at the global market in order to control soaring food prices. It usually implemented export restriction measures to prevent commodity shortages in the domestic market, leading to rising food prices. India and Vietnam employed this measure in 2008 (global food price crisis) in order to control soaring rice prices in the domestic markets (Bello, Reference Bello2009). Consumer subsidies were another policy tool which the governments in several countries were likely to implement in order to control food prices. It required farmers to sell their commodities to the government agencies at lower prices. The agencies then sold the commodities to consumers at a price much below the market one. Third, the government set higher protective tariffs in order to protect domestic industry and state enterprises from foreign competition. Setting high tariff rates resulted in higher prices of imported commodities, such as agricultural equipment or fertilizers.
The policies discriminated against farmers’ interests (especially those that produce exportable commodities). When the government imposed more tax barriers or more restriction programs on agricultural exports, it transferred resources (revenues) from agriculture to the industrial, urban, and even import-competing agricultural commodities (Bates, Reference Bates1981; Haggard, Reference Haggard1990). For instance, when the government implemented consumer subsidy programs by requiring farmers to sell their commodities at a cheaper price, it indirectly transferred the farmers’ incomes, which they were supposed to earn, to the consumers. Moreover, the government transferred the tax burdens to the farmers via export taxes in that the agricultural businesses were likely to purchase the farmers’ commodities as cheaply as possible in order to make up for their costs.
These statism programs reflected an influence of import-substitution industrialization (ISI) policy on policymakers in developing countries. The economy was centrally planned in that the state intervened in the market by keeping agricultural commodity prices and labor wages low to reduce the costs of industrial inputs (Bates, Reference Bates1981; Lal, Reference Lal1985; Lin Reference Lin2009). ISI-oriented governments were likely to set higher tariff rates for imported goods, keeping farmers’ earnings and food prices low, and taxing all kinds of expected agricultural commodities. The policymakers expected that these state-controlled programs would generate industrial and urban growth in that domestic industry would have been able to compete with foreign competitors (Lin, Reference Lin2009; Yergin and Stanislow, Reference Yergin and Stanislaw2002). Indeed, while high- and middle-income consumers benefitted from the policies, the urban poor and rural farmers were vulnerable to the high prices of staple food and the fluctuation of the agricultural commodity prices.
Governments in some developing countries have increasingly abandoned those policies and, sometimes, have subsidized agriculture. Direct taxes and consumer subsidies were first abandoned. The governments in Brazil, the Philippines, and Thailand have lifted direct taxes on their major agricultural exports and consumer subsidy programs (Lopes et al., Reference Lopes, Lopes, de Oliveira, Barcelos, Jara, Bogado, Anderson and Valdes2008; Warr and Kohpaiboon, Reference Warr, Achanon, Anderson and Martin2009). Moreover, some have implemented short-term programs such as price guarantees or fertilizer subsidies. These agricultural shifts became more visible after the 1980s, when policymakers in developing countries gradually pursued market reform and trade liberalization. The governments were pressured by the World Bank and the International Monetary Fund (IMF) to reduce protective tariffs and the subsidization of state-owned programs in exchange for financial assistance. Moreover, the establishment of the World Trade Organization (WTO) in 1995 promoted multilateral trade, encouraged the reduction of trade barriers (i.e., tariffs and state subsidies), and put pressure on developing countries to pursue more market-oriented policies (Anderson, Reference Anderson and Anderson2009). To become a member of the WTO, a country had to agree to reduce tariffs and other anti-trade taxes. In other words, the effort to pursue market reform and the promotion of trade liberalization at the international level encouraged the government to reduce direct taxes on agricultural exports and the subsidization of the import-competing commodity sector.
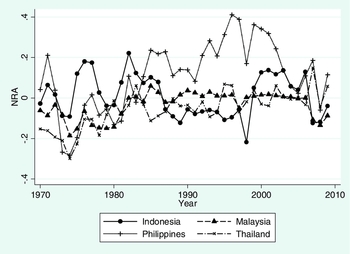
The trend of agricultural tax reduction can be observed by examining the nominal rate of assistance (NRA)Footnote 2 for agriculture for Indonesia, Malaysia, the Philippines, and Thailand. This measure, which captures governmental trade policy for the agricultural sector, emphasizes price distortions on the main exportable commodities. The NRA equals zero under a free-trade regime, has positive values when producers are subsidized by taxpayers or consumers, and is negative when producers are levied by trade policy (i.e., export controls or overvalued exchange rates).
Figure 1, which illustrates the NRA in these Southeast Asian countries from 1970 to 2009, shows that the governments were more likely to impose lower tax and control programs on the agricultural sector. This positive trend is evident in the Philippines (the green line) in that the government increasingly subsidized the sector after the 1980s (i.e., the collapse of the Marcos regime). Although the graph does not clearly indicate the positive NRA trend in Thailand (the orange line), the NRA percentage from the 1990s to the 2000s was generally higher than that of the 1970s to the 1980s. While the figure shows that the NRA trend became more positive, it also suggests that the governments still imposed taxes and restriction measures on the sector via food price controls, import tariffs, or consumer subsidy programs during some periods, regardless of the political regime in power. For instance, in Indonesia, the newly elected government heavily taxed agriculture during 2007–8 (i.e., the global food price crisis).
The nominal rate of assistance (NRA) for all agricultural sectors in Southeast Asian Countries, 1970–2009 Note: The NRA in the graph represents the value of production weighted average for all agricultural sectors (import-competing and tradable commodities). Source: Anderson and Martin (2010).

Although there seems to be a trend of reducing agricultural taxes in those countries, state intervention in agriculture continues to be prevalent. The difference in agricultural policies in developing countries begs us to pay attention to how institutional arrangement supports (or impedes) the governments in terms of reducing (or increasing) taxes on the sector.
Not only has agricultural policy been shifted, but political institutions have also changed. From the 1950s to the 1980s, most developing countries were governed by autocratic regimes. While most Latin American countries were governed by military regimes, Asian countries (except India) were governed by oligarchies. Nonetheless, there was a major political transition from the 1980s to the 1990s in the developing world, when the autocratic regimes in several developing countries collapsed. The military in Latin American countries stepped back from politics. In Asia, the Marcos and Suharto regimes collapsed in 1986 and 1997, respectively. In Thailand, although there was a coup in 1991, its politics in the 1990s was more liberal than that in the 1970s or 1980s.
Seemingly, political transition and trade liberalization are related to tax reduction in agriculture. From the 1950s to the 1980s, several developing countries were governed by autocratic governments while they heavily discriminated against agriculture. The political systems in several developing countries have been more liberal or even transitioned to electoral regimes since the 1980s, while they have nonetheless increasingly imposed lower tax rates and fewer restriction programs on producers. Developing countries were likely to liberalize before transitioning to a democratic regime. As Giavazzi and Tabellini (Reference Giavazzi and Tabellini2005) argued, a liberalized economy tends to abolish trade barriers and restrictions because the government wants to generate the growth of domestic and foreign investment so that it is able to generate more revenue for the redistribution that democracy requires. Therefore, political liberalization tended to be stable in liberalized economies. In the next section, we examine how political regimes and trade openness explain the variation of agricultural policies in developing countries.
3 Political regime type, trade openness, and agricultural policies
In developing countries, the government is more likely to tax agriculture. First, policymakers in developing countries are likely to impose tax and price control programs in order to control raw material prices and labor wages. It does so in order to reduce the transaction and operation costs for domestic industries so that they are able to produce and export more commodities (Swinnen, Reference Swinnen1994). Cheap agricultural commodity prices and labor wages are a comparative advantage development (CAD) strategy for developing countries (Lin, Reference Lin2009). The government subsidizes the industrial sector and encourages them to become more competitive in the global markets at the expense of the agricultural sector. Second, one of the main sources of revenues derives from the exports of agricultural commodities. Agriculture is a sector with comparative advantage for developing countries. The government is more likely to impose taxes on this sector in order to accrue revenues. Third, in developing countries, because land is abundant and immobile, the government is more likely to levy rural farmers (Acemoglu and Robinson, Reference Acemoglu and Robinson2006; Rogowski, Reference Rogowski1989). Meanwhile, industry is less likely to be taxed by the government because it can move the capital to other countries if tax rates are increased (Boix, Reference Boix2003).
The degree of taxes on agriculture nonetheless depends upon the political regime in power. We argue that, in developing countries, democratic regimes are likely to reduce tax and control programs in agriculture. In developing countries, where a large proportion of the citizens live in rural areas, elected politicians want to appeal to rural farmers for their votes (Krueger, Reference Krueger1991; Swinnen, Reference Swinnen1994). Low-income people, including rural farmers, are vulnerable to economic downturns and price fluctuations. They are likely to demand greater redistribution from the government in order to increase their income and to protect themselves from economic dislocation (Boix, Reference Boix2003; Meltzer and Richard, Reference Meltzer and Richards1981). Such voters are likely to support politicians that promise to distribute public resources to them. Given the electoral importance of rural voters, politicians often appeal to them with promises of reducing taxes and providing more governmental assistance programs (Olper and Raimondi, Reference Olper and Raimondi2013).
Autocrats are likely to be responsive to industries’ and consumers’ demands because they perceive that these societal groups are more politically salient to regime stability than farmers. First, autocratic governments are more likely to implement consumer subsidy programs because they are concerned about urban protests and riots (Laiprakobsup, Reference Laiprakobsup2010). When a government cannot control prices, especially food prices, consumers (especially urban ones) are likely to protest against it. Political scientists have argued that urban protests are one of the most important political conditions that can trigger instability (O’Donnell and Schmitter, Reference O’ Donnell and Schmitter1986). To reduce the possibility of urban riots, autocratic governments are likely to implement food price controls and tax the commodities to keep prices low. Second, industries are typically considered to be more economically and politically powerful than farmers (Laiprakobsup, Reference Laiprakobsup2010). Due to their small population and similar policy preferences (i.e., keeping labor wages and raw material prices low), organized interests such as industries are able to be better united and organized. Meanwhile, rural farmers are not able to unite effectively because the policy preferences of the farmers are considerably different (Binswanger and Deininger, Reference Binswanger and Deininger1997).Footnote 3 As a result, the farmers cannot effectively lobby the government compared to industry. The farmers, thus, lack the bargaining power to oppose the policies against their interests. Third, autocrats are less likely to liberalize the economy because they are pressured by the dominant businesses and industries to implement a set of trade policies which protect them from competition with foreign capital (Giavazzi and Tabellini, Reference Giavazzi and Tabellini2005).
We hypothesize that democratic regimes are likely to be associated with an increase in the nominal rate of assistance for the agricultural sector, whereas authoritarian regimes are likely to be associated with a decrease in the NRA percentage. Elected governments have political incentives to support tax-reduction policies in order to appeal to farmer voters. For instance, the Marcos regime heavily taxed its tradable agricultural commodities. After 1986, the newly elected government abolished export taxes and lowered tariffs on imported agricultural inputs (David et al., Reference David, Intal, Balisacan, Anderson and Martin2009). The elected governments have increasingly subsidized rice and sugar while they have reduced export taxes on coconut, for example.
We argue that trade openness has a positive impact on tax reduction in agriculture. First, the government is likely to reduce tax barriers (especially export ones) in order to generate export growth. Indeed, it has to reduce the tax rates on manufacturing and agricultural exports in order to encourage the export of those commodities. Second, when the government imposes lower taxes on exports, the exports of other commodities are likely to increase. Therefore, revenues from the exports are likely to increase so that the government depends less on the revenues from the agricultural exports. The government is less likely to have an incentive to implement export restrictions or premiums, thus negatively affecting agricultural sector. We hypothesize that export growth (i.e., higher percentage of trade openness index) is associated with an increase in the nominal rate of assistance to agriculture. The next section examines the hypotheses empirically.
4 Data and methods
We examine the effect of the political regime and trade openness on agricultural policy in Indonesia, Malaysia, the Philippines, and Thailand. The selected countries provide us with good cases for examining the relation between political and economic factors and public policy. First, the political regimes of these countries are considerably different. While Indonesia's and the Philippines’ democratic regimes have not collapsed for two decades, Thailand's democracy has been broken down by military coups. Meanwhile, Malaysia has been governed by one dominant party system for several decades. As a result of the variation in political regimes, the empirical results should not be biased. Second, these Southeast Asian countries have been the top exporters in agricultural and manufacturing commodities for decades. This indicates that the governments in these countries have abandoned some trade-protectionism programs. Still, the governments have protected the manufacturing industry and subsidized some agricultural of the sector from international competition (Anderson, Reference Anderson and Anderson2009). As a result, the governments do not always reduce taxes on agriculture even though the countries are democratic and exports are growing. Third, the economic structures of these countries have changed from agricultural to industrial-based economies for a few decades. The changing economic structure provides us with a good opportunity for examining the effect of economic transformation on public policies, including agricultural ones.
The dependent variable is the nominal rate of assistance (NRA) of the production value of all agricultural sector from 1970 to 2009. The NRA refers to the annual percentage of governmental subsidies (or taxes) to the sector (Laiprakobsup, Reference Laiprakobsup2010). The NRA values capture whether governments subsidize (or discriminate against) the producers. It is ‘computed as the percentage by which government policies have raised gross returns to farmers above what they would be without the government's intervention’ (Anderson, Reference Anderson and Anderson2009, p. 11). The unit of analysis is the annual percentage of the NRA for agriculture. The total number of observations is 160.
Independent and control variables
The first independent variable is the political regime. To operationalize the regime, we utilize the Polity IV measure of political regimes from 1970 to 2009 (Marshall and Jaggers, Reference Marshall and Jagger2009; Marshall et al., Reference Marshall, Jagger and Gurr2009). It basically measures whether the executive power is balanced by other institutions, such as the legislative or judiciary branches. The Polity IV index goes from –10 (the most autocratic regime) to 10 (the most democratic regime).Footnote 4 The second independent variable is trade openness. We use the Penn World Table's trade openness index from 1970–2009 (Heston et al., Reference Heston, Summers and Aten2009). It is the function of ‘exports plus imports divided by gross domestic product (GDP)’ (Heston et al., Reference Heston, Summers and Aten2009, p. 10). If the percentage is higher, the exports are growing or expanding. We expect to find a positive association between the political regime and trade openness and agricultural policy.
Economic conditions are likely to have an impact on the government's decision regarding agricultural tax policy. In order to control for economic conditions, we employ GDP per capita and inflation. We argue that economic growth has a positive impact on agriculture. When the countries become richer in that people's incomes are expanding, food expenses become a smaller portion of their earnings. Therefore, the government has less incentive to implement price control and consumer subsidy programs, thus affecting agriculture and farmers’ interests. However, when the economy is in a downturn, the government is likely to intervene in agricultural markets by controlling food prices (i.e., launching cheap food programs) in order to ease the consumers’ frustration. Indeed, such programs have a negative impact on the farmers. We use the World Bank's data on GDP growth, GDP per capita, and inflation (World Bank, 2010). A positive association between GDP per capita and the NRA is expected, whereas a negative association between inflation and the NRA is expected.
We also include the variable measuring growth of the agricultural sector. The growth in the sector is likely to account for revenue transfer to the sector. The continuous growth of agricultural commodity exports brings the main source of revenues to the countries. Previously, the government heavily taxed the sector via setting a lower price floor, which hindered the growth of agricultural productivity (Anderson, Reference Anderson and Anderson2009). To sustain the growth of agricultural exports, agricultural productivity has to continue to grow (Laiprakobsup, Reference Laiprakobsup2010). As a result, the government is likely to reduce tax and restriction programs in the agricultural sector in order to encourage the farmers to produce. We use the World Bank's data on the growth of agricultural production (World Bank, 2012). We expected to find a positive association between agricultural growth and the NRA for the agricultural sector.
Subsidizing a particular economic sector is likely to impose costs on other sectors (Anderson, Reference Anderson and Anderson2009; Varshney, Reference Varshney1995). The subsidization of manufacturing is likely to lead to resource transfer from agriculture. Given the typical budgetary constraints of developing countries, industrial subsidization negatively affects the agricultural sector (Laiprakobsup, Reference Laiprakobsup2010). Moreover, when the government subsidizes domestic industries via setting higher protective tariffs, farmers are likely to be negatively affected by the policy because their costs for farm machines increase. We use the World Bank's data on the nominal rate of assistance (NRA) for the import-competing and non-agricultural sectors in each country. Therefore, we expected to find a negative association between the NRA for agriculture and the NRA for the non-agricultural sector.
We also include two variables measuring the size of the agricultural, rural, and urban population in order to control for the effect of the comparative advantage in agriculture and the size of the population in the societal sector on the government's trade policy. Agriculture taxation is susceptible to a comparative advantage in agriculture. The agricultural sector (especially the exportable or tradable one) is the countries’ comparative advantage in that the sector is the main source of the countries’ income. As a result, the governments in developing countries are more likely to impose more tax programs on the agricultural sector (especially the exportable or tradable ones) (Anderson, Reference Anderson and Anderson2009). Moreover, the governments in developing countries are likely to impose taxes on rural producers in order to subsidize urban dwellers. In developing countries, urban dwellers are more politically powerful and dominant than the rural producers in that they are more capable of pressuring and lobbying the government to comply with their interests. This is because the size of the urban population is smaller so that they are able to collaborate with each other, and their economic interests are similar to those of industry (i.e., controlling primary agricultural material and food prices). Therefore, the government is likely to impose taxes on rural producers and transfer the tax revenues to the urban and industrial sectors. Operationalizing the variables, we use the World Bank data (Anderson and Nelgen, Reference Anderson and Nelgen2012) on the size of the agricultural, rural, and urban population in each country to create three variables; namely, the ratio of agricultural, rural, and urban population to total population ratio.
To control for the effect of economic ideology shifts, the statistical model includes a series of categorical variables capturing the effect of different time periods. As explained in the second section, economic ideas have shifted over time. From the 1970s to the 1980s, many developing countries in Asia and Latin America faced a decline in economic growth and hyperinflation (Yergin and Stanislaw, Reference Yergin and Stanislaw2002). During the mid-1980s to the 1990s, policymakers in developing countries tried to pursue market reform (even though incompletely) by cutting government spending and reducing the protection of domestic industry (Haggard, Reference Haggard1990; Weyland, Reference Weyland2004; Yergin and Stanislaw, Reference Yergin and Stanislaw2002). The gradual abandonment of ISI policies and the increasing acceptance of market mechanisms should be reflected in the higher NRA values starting in the 1990s.
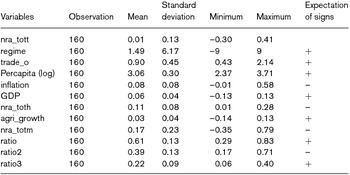
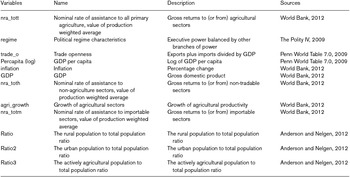
Table 1 represents the summary statistics of the dependent and independent variables.Footnote 5 The average NRA for all agricultural sectors (nra_tott) is 1%, while the average NRA for non-agricultural commodities (nra_totx) is 11%. This indicates that the governments in selected Southeast Asian countries still imposed taxes on the agricultural sector. Nonetheless, the minimum and maximum numbers suggest that there was variation in the degree of the government's intervention programs in the economic sector. The average political regime score was 1.50, which indicates that the democratic regimes in these countries are not stable. However, the minimum (–9) and maximum (9) numbers indicate that the political regimes of the selected countries range from totalitarianism to full democracy. The average trade openness index is 90%, which indicates that the countries, to some extent, aim for trade expansion.
Summary statistics and expectation of signs

We use the ordinary least squares (OLS) method to examine the effect of political and economic factors on agricultural trade policy. Since we examine the policies of four Southeast Asian countries from 1970 to 2009, the data are structured as a time-series cross-section (TSCS). The fixed-effects method is employed to control for factors specific to each country. It makes sense to assume that each country exhibits some unknown and unobserved factors that affect the level of state intervention in agriculture (Laiprakobsup, Reference Laiprakobsup2010). The introduction of the fixed-effects method allowed us to control for those omitted factors that were not a part of the models. The statistical analysis focuses on explaining the impact of the independent variables within countries, not cross-country variations. We also employ the Wald Test for groupwise heteroskedasticity and the Wooldridge Test for autocorrelation to check whether the models are severely plagued by heterskedasticity of error and serial correlation. In this study, agricultural protection is persistent with strong autocorrelation. In other words, the NRA for the agricultural commodities of selected countries can be contemporaneously correlated with each other. Thailand's NRA percentage for agricultural commodities in 1983 could have been shaped by the NRA in 1982 or 1981. The NRA observations for the selected countries are hierarchically structured and are likely to be autocorrelated. Thus, the NRA of the selected countries is not randomly sampled and is subject to observable and unobservable common disturbances (Driscoll and Kraay, Reference Driscoll and Kraay1998).
Acknowledging that serial correlation can yield an inefficient estimator, several political scientists have been inclined to use residual correction techniques. Some use the panel-corrected standard error (PCSE) proposed by Beck and Katz (Reference Beck and Katz1995). This residual correction technique aggregates the data from different units (countries) into one data set and adjusts for autocorrelation by transforming the data based on an estimate of the autocorrelation of the error terms, assumed to be common across panels (Wilson and Butler, Reference Wilson and Butler2007). It imposes a set of common factors on all independent variables (Granato, Reference Granato1991; Hendry and Mizon, Reference Henry and Mizon1978). Applying a restriction term (ρ) to the error terms of all panels, the analyst assumes that a common intercept (а) is equal for all panels (ai = a). He or she obtains the corrected standard errors by weighing the NT x NT block diagonal matrix data with the variance–covariance matrix of error terms (Ω) (Wilson and Butler, Reference Wilson and Butler2007).Footnote 6 He or she then applies the corrected error terms to all. However, the PCSE technique can be problematic when more observations (N) are included. The analyst has to accept the fact that the PCSE estimators are likely to perform poorly when the observation dimension increases exponentially, whereas they do not with respect to the time dimension (Hoecle, Reference Hoechle2007).
As an alternative, Driscoll and Kraay (Reference Driscoll and Kraay1998) proposed a non-parametric covariance matrix estimator that produces heteroskedasticity in consistent standard errors that are robust to very general forms of spatial and temporal dependence (Hoechle, Reference Hoechle2007).Footnote 7 Relying on large T asymptotics, the Driscoll–Kraay standard error modification strategy aims to transform the orthogonality condition and construct a covariance matrix estimator, which is robust to either a balanced or unbalanced panel (Driscoll and Kraay, Reference Driscoll and Kraay1998).
5 Findings and discussion
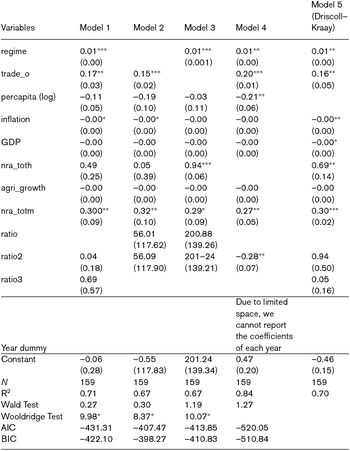
Table 2 presents the results derived from running four different models with country fixed-effects. The first model tests the effects of the political regime and trade openness variables together on the NRA. Models 2 and 3 test the effect of trade openness and the political regime on the NRA, respectively. In Model 4, the effects of the regime and trade openness variables together are tested, including the categorical variables, capturing the effects of time periods. Model 5 tests the effects of the political regime and trade openness on the NRA with the Driscoll–Krayy robust standard error model. Generally, the statistical models perform considerably well in terms of prediction (adjusted R2 within-model). The F-statistics of the Wald heteroskedasticity and Wooldridge autocorrelation tests indicate that the models were not severely affected by the heteroskedasticity of errors or serial correlation.
Effects of political regime and economic conditions on agricultural sectors in Indonesia, Malaysia, the Philippines, and Thailand

Notes: *p < 0.10; **p < 0.05; ***p <0.01. The numbers in parentheses in models 1–4 are robust standard errors, while the numbers in parentheses in model 5 are Driscoll–Kraay standard errors. Wald Test stands for Wald test groupwise heteroskedacity. Wooldridge Test stands for Wooldridge test autocorrelation in panel data. AIC stands for Akeike Information Criterion while BIC stands for Bayesian Information Criterion.
The results of the statistical analysis are consistent with the main hypotheses. The political regime and trade openness variables were statistically significant at p < 0.01, and in the expected direction in all of the models.Footnote 8 Increases in the Polity IV score were associated with higher NRA values. Holding other factors constant, a unit increase in the Polity IV index was associated with approximately a 1 percentage point increase in the NRA for all agricultural sectors. Similarly, increases in the trade openness index were associated with higher NRA values. Holding other factors constant, a unit increase in the trade openness index was associated with an increase in the NRA for the sectors equal to approximately 17 percentage points (see model 1). The empirical results suggest that elected governments are more likely to impose lesser taxes on the sectors, and export expansion has a positive effect on the farmers in terms of tax reduction.
The control variables also showed some interesting results. High and volatile inflation is likely to lead to lower NRA values. Nonetheless, when some categorical variables were included, the impact of inflation was greatly reduced. The results show that, in the context of high inflation, governments are more likely to control commodity prices and impose higher taxes on agriculture. The economic condition variables did not always have a significant effect on the NRA for the agricultural sectors, and their impacts were inconsistent. The inconsistency of the GDP per capita and GDP growth probably resulted from the fact that this study focused on the agricultural policies of newly industrializing Southeast Asian countries. The governments, to some extent, maintain food-price control programs in order to appeal to high-income consumers and industries. Nonetheless, we should not conclude that there is no significant difference between the NRA of developed and developing countries since governments in advanced economies are more likely to subsidize agriculture.
The subsidization of non-agriculture sectors seems to have a positive impact on agriculture. Increases in the NRA for the non-agriculture sectors (nra_toth) were associated with higher NRA for the agricultural sector. The results indicate that the more likely the non-agricultural sector was to be subsidized, the more likely the agricultural sector benefited from the subsidization of other economic sectors. In these emerging, industrializing countries, several industries were the agricultural-exporting and food-processing industries, which were previously taxed by the governments. They were likely to transfer the tax burdens to farmers. When the governments abandoned the taxes, the tax burdens, transferred to the farmers, were likely to be reduced. However, the variable did not always have a significant effect on the NRA for the sectors. Therefore, it should not be concluded that the subsidization of other economic sectors does not account for resource transfers from agriculture.
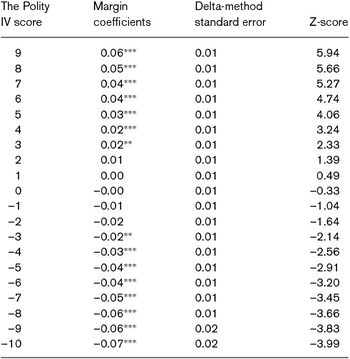
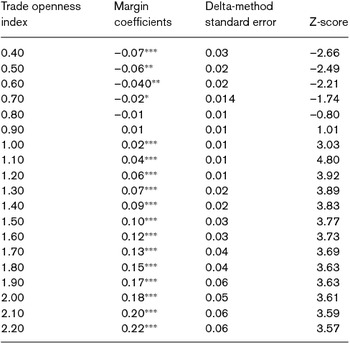
To further illuminate the effect of political regimes and trade openness on agricultural policies, their marginal effects are shown. Table 3 and 4 represents how the predicted NRA for the agricultural sectors varied according to the Polity IV score and trade openness index. Table 3 shows that, when political regimes in the selected countries become more democratic, governments are likely to impose lower taxes on agriculture Nonetheless, the marginal effects coefficients in some regimes were not statistically significant. It can be argued that because those regimes are prone to break down, the governments are likely to maintain some control programs, such as price control, in order to appeal to politically powerful interests, such as bureaucratic agencies or industries, thus supporting low food price policy. Similarly, Table 4 shows that, when exports in the countries are expanding, the governments are likely to impose lower tax and control programs on the sectors.
Marginal effects of political regimes and the nominal rate of assistance (NRA) to the agricultural sectors

Note: *z < 0.10; **z < 0.05; ***z < 0.01.
Marginal effects of trade openness and the nominal rate of assistance (NRA) to the agricultural sectors

Note: *z < 0.10; **z < 0.05; ***z < 0.01.
These results are in accordance with the results of Giavazzi and Tabellini (Reference Giavazzi and Tabellini2005), Olper and Raimondi (Reference Olper and Raimondi2013), and Olper, Falkowski, and Swinnen (Reference Olper, Falkowski and Swinnen2009). Democratic regimes are associated with an increase in agricultural subsidization or protection. This illustrates the redistributive characteristics of democratic institutions, where elected politicians are likely to implement policies appealing to the majority (i.e., reducing taxes imposed on rural producers and redistributing resources to the producers). Indonesia and the Philippines represent the positive association between a transition to democracy and a shift in agricultural policy. From the 1960s to the late 1990s, the authoritarian regime of Indonesia (the Suharto regime) imposed higher taxes on unprocessed agricultural commodities to promote industrialization and economic growth (Fane and Warr, Reference Fane, Warr, Anderson and Martin2009). Although the Suharto government subsidized rice producers by guaranteeing paddy rice prices, the government heavily controlled rice prices in the domestic market. From the 1960s to the 1990s, the NRA percentage of Indonesia's rice sector showed a negative sign, indicating the heavy government regulation on the rice market (Fane and Warr, Reference Fane, Warr, Anderson and Martin2009). After the transition to democracy in 1998, successive elected governments reduced taxes on agricultural commodities. The governments have continuously subsidized the rice sector and guaranteed paddy rice prices in order to increase rice production.
Similarly, the Philippines heavily taxed its agricultural tradable commodities during the Marcos regime. After 1986 (the collapse of the Marcos regime), the newly elected government abolished export taxes and lowered tariffs on imported agricultural inputs (David et al., Reference David, Intal, Balisacan, Anderson and Martin2009). The elected governments have increasingly subsidized rice and sugar, while they have reduced export taxes on coconut.
6 Conclusion
Agricultural policies in developing countries have shifted from discriminating against farmers to increasingly subsidizing them for decades. This paper argues that political liberalization and trade expansion contribute to the agricultural policy shift in developing countries. Elected governments have a political incentive to support tax reduction policy in order to appeal to farmer voters; and they are likely to abandon export tax barriers in order to induce foreign investment and generate export growth. Indeed, governments have to abandon agricultural export taxes in order to encourage private exporters to increase their export volumes.
The statistical results show that democratic regimes are likely to impose lower taxes on agriculture. Elected politicians (especially rural ones) have a political incentive to abandon agricultural taxes. They want to appease the farmers, who comprise the majority of the electorate and are increasingly mobilizing to pressure the government for assistance. Although the elected governments often control food prices, which hurts the farmers’ interests, they are less likely to maintain the measure for a long time. The results also indicate that trade openness has a positive impact on agriculture. When exports are growing, the government is likely to impose lower taxes on the farmers. This indicates that an increase in exports has a positive impact on farmers’ interests.
About the author
Thanapan Laiprakobsup is a lecturer at the Graduate School of Public Administration (GSPA), the National Institute of Development Administration (NIDA). His research interests include comparative political institution and public policy, state and development, and Southeast Asian politics.
Appendix
Description of variables