


I. Introduction
Ice-sheet flow models are based on a relation describing the mechanical response of ice to an applied stress at a given temperature. Most models use the same relation which is based both on a power-creep law (the “Glen” flow law) and on the “shallow-ice approximation” (Hutter, 1983; Morland, 1984) that takes advantage of the small thickness to length ratio of the ice sheet to simplify the equilibrium equations. The derived equation (Vialov, 1958) links the vertical derivative of the horizontal velocity to the effective shear stress τ to the power n, τ being proportional to the surface slope and to the depth in the ice sheet. The coefficient of the Glen flow law, B(T), depends on the ice temperature T via an Arrhenius-type relation involving an activation energy Q.
Although the flow law is well supported by mechanical experiments, its use in models sets a few problems:
-
1. A very large set of empirical values for the flow law is found in the literature: values of the Glen exponent n vary from 1 to 4.5, with a mean value of 3 (Paterson, 1994). Homer and Glen (1978) reviewed 23 values between 40 and 135 kJ mol−1, for activation energy Q.
-
2. n and Q seem to vary with temperature and/or stress and/or strain rate. A quasi-Newtonian viscosity (n ≈ 1) is suggested for polar ice while grain growth occurs (Pimienta and Duval, 1987). Such creep occurs in the first hundreds of metres at the top of the ice sheets. A power-law creep with n = 3 is expected when continuous recrystallization occurs: this is tertiary creep. In the intermediate ice layers the results are uncertain. Several interpretations of field data suggest a flow with n = 3 (Paterson, 1983; Reeh and others, 1985), whereas others give n from 1 to 2 (Lliboutry and Duval, 1985; Pimienta and Duval, 1987). Furthermore, the exact boundary between different types of creep and their relative importance is not very well known.
-
3. The pre-exponential factor (B 0) seems to vary with respect to the orientation of c axes, to the crystal structure, to concentrations of impurity and/or to other factors (Dahl-Jensen and Gundestrup, 1987; Budd and Jacka, 1989).
-
4. The computational calculation of shear stress needs both a precise topography and a well-defined characteristic scale. Budd (1970) showed that the longitudinal stress would be negligible if the stress is smoothed over a distance of 20 times the ice thickness. Young and others (1989) suggested an averaging over a larger scale and using a thermomechanical model. Dahl-Jensen (1989) showed that longitudinal stress has the same order of magnitude as the shear stress everywhere.
-
5. Are we looking for “the” flow law or for “a” flow law (Alley, 1992)? More exactly, does a general behaviour of the ice deformation actually exist? Or, do local anomalies such as sliding or other anomalies in basal condition represent a general trend or a particular case?
The use of a precise surface topography appears to be a promising way to understand ice-sheet flow behaviour. This has been attempted by Young and others (1989) and by Hamley and others (1985) using the topography computed by Zwally and others (1983), Both studies ignored temperature effects and found a high value of n for the whole data set. Using Seasat altimetric maps from Rémy and others (1989). Rémy and Minster (1993) found a value of n = l and an activation energy Q = 70 ± 4 kJ mol−1 for ice temperature lower than −10°C.
For the first time, ERS-1 provides altimetric measurements over 80% of the Antarctic continent. Brisset and Rémy (1996) explained why and how these data must be carefully corrected for the principal errors (retracking, orbit and slope errors). They used an inverse technique in order to separate the topographic signal from errors. A metric a posteriori error over distances of some tens of kilometres is achieved (Fig. 1). They also showed that the curvature of the small-scale features such as undulations, related to bedrock features and to basal conditions, can be directly mapped from the variation of back-scattered energy, which allows limitations from the linear altimetric sampling to be avoided.
ERS-1 altimeter topography map of Antarctica, north of 82° S. Contour interval is 100 m. This map is obtained by inversion of 3 000 000 altimetric data, from one 35 d ERS-1 repeat cycle (Brisset and Rémy, 1996). The flowlines are also displayed in the 70–160° E sector.
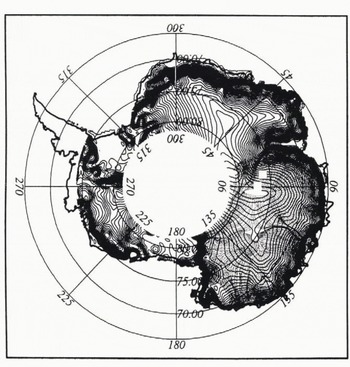
The aim of this paper is to use this precise topography in order to improve both our knowledge of the ice-flow behaviour and the estimation of the rheological parameters. We focus on the area between 160° and 70°E, where the ice thickness is well documented (Drewry, 1983) and located north to 81.4° S which is the ERS-1 satellite inclination. We will assume a steady state and will further discuss the validity of such an assumption.
II. Constitutive Relation and Computational Scheme
In this section, we will set the basic equations to be used in the computation of the main geophysical parameters involved in ice-sheet modelling.
From the shallow-ice approximation (Hutter, 1983; Morland, 1984), the ice flow at any depth is directed along the steepest slope of the surface. The flowlines can then be derived from the surface-elevation map. The mean velocity U is estimated from the steady-state continuity equation applied step by step between two flowlines, in the area displayed in Figure 1, from the relationship

where X is the flow direction from the ice divide to the coast and dx is the curvilinear step, chosen as 20 km, the overbar designing the mean value between x and x + dx. l(x) is the distance between two flowlines (20km at the starting point). This scheme takes into account the convergence or divergence of the flow. Ice thickness H(x) is derived from Drewry (1983) and accumulation rate b(x) from Radok and others (1987).
The “deformation velocity” v(z) is a function of the height above ice bottom z. It is related to temperature Τ(z) and basal shear stress τ(z) through (Vialov, 1958)

T m is the melting temperature at the bottom of the ice sheet (T m = 273 − H/1503, where Τ m is expressed in Κ) and R, is the gas constant, τe is the effective stress and τxz is the shear stress, namely τ = ρɡΗα, where ρ is the ice density, ɡ is the acceleration of gravity and α is the surface slope in the flowline direction. In the shallow-ice approximation, the other stress components are neglected and τe = τ. To smooth the effect of longitudinal stresses due to the irregular bedrock topography, the shear stress is calculated over a distance of the order of 50 km (Young and others, 1989). We also avoid domes and coastal regions where shear stress may not dominate. Equation (2) will be numerically integrated but the analytical expression of Lliboutry (1981) will also be used for qualitative analysis. This stales that

where V is the averaged deformation velocity of the ice column (V = U (Equation (1)), if there is no sliding),  is the mean bottom temperature averaged over the first 5% of the bottom ice (which corresponds to about the first hundred metres); G
0 is the bottom temperature gradient, taken as 0.022°Cm−1 corresponding to a 50mWm−2 geothermic flux, while G
d is a flux introduced to take into account the energy dissipation, G
d = Uτb (Lliboutry, 1987). Equation (3) is not valid if T
b reaches the melting temperature. Furthermore, because the (p + 2) term takes into account the basal gradient temperature. B
0 remains independent of ice-column characteristics. If the rheological parameters are constant within the column, then the correlation coefficient between mean velocity from Equation (3) and mean velocity from a numerical integration of Equation (2) is 0.95. The bottom temperature must be estimated from the thermodynamic equation (Lliboutry, 1987) which, under the steady-state assumption, reads

k is the thermal diffusivity, C is the specific heat capacity and w is the vertical velocity. In this equation, we consider vertical diffusion (first term), horizontal advection (second term), vertical advection (third term) and dissipation (last term). More details can be found in Ritz (1987) or Rémy and Minster (1993).
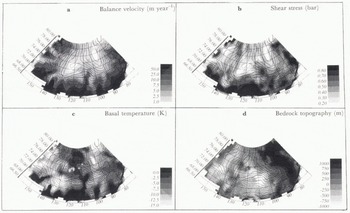
For the whole sector, we then compute U, τ and T b, which are mapped in figure 2a, b and c; this yields 13 500 data points. The mean velocity map displays the expected behaviour with values increasing from dome to coast. One can observe high local anomalies in the convergence zone (e.g. 72° S, 110° E) or weak local anomalies in the divergence zone (74° S or 77° S, 150° E), which shows the importance of taking convergence or divergence of the flow lines into account (Equation (1)). The shear stress also shows well-known features: it is less than 0.2 bar near domes or ice divides and increases downslope to 1 bar. It also shows local anomalies such as low values at the Vostok “lake” (76–78° S, 105° E) or the Astrolabe “lake” (70° S, 137° E), and high values at 135° E, for instance, which corresponds to well-identified bedrock features (Drewry, 1983) (see Fig. 2d). The basal temperature map looks like the one in Huybrechts (1990): values are close to the melting point, either inside the continent (e.g. Dome C) where vertical advection is weak, or near the coast where dissipation is important.
Maps of balance velocity (a), basal shear stress (b), basal temperature (c) and bedrock topography (d), in the 70–160° E sector.
III. Behaviour of Geophysical Parameters
a. Observations
To first order, Equation (3) shows that the parameter X (V/H)(p + 2) is only related to the basal values of τ and T b. One can thus compute the average X0(τb0, τ0) for all the data whose T b, and τ are equal to T b0 and τ0. Numerically, T b0 is sampled in degree bins, whereas τ0 is sampled by bins of size 0.05 bar. We expect X0(T b0, τ0) to be noisy because we ignore the whole vertical profile contribution. Nevertheless, it should be representative of a given pair (τb0, τ0) to first order. For the whole data set, we can then map the ratio between the observed local value and the averaged one. X(T b, τ)/X0(T b, τ) (Fig. 3a). This ratio should be seen as an anomaly of X with respect to the local values of T b and τ. A strong signal of amplitude ɓ is displayed, meaning that some areas with the same basal temperature and stress can be given values of X different by a factor of ɓ. This has already been observed by McIntyre (1983). It cannot be due to bad sampling; indeed, if the pair (T b, τ) is unique, the ratio will be equal to 1. Note also that even if n, Q or B>0 vary with τ or T b, the same pair will give the same X. Such a strong signal cannot be due to uncertainty on the stress or temperature computation, nor can it be due to the assumptions used to derive Equation (3). Indeed, a factor ɓ should be due either to a very strong error of 18°C in T b, (if Q = 6 kJ mol−1) or of 0.4 bar in stress (if τ = 0.5 and n = 3), and this is not realistic. This signal is thus really significant.
The same analysis scheme is applied to the shear stress. The difference between the local stress and the average shear stress corresponding to the local values of X and T b is displayed on figure 3b. The differences may reach 0.25 bar and are thus significant. The most remarkable pattern is the alternation of positive and negative bands in the across direction of the ice flow, suggesting that the longitudinal stress gradient is still present.
Maps of the X(T
b, τ)/X0(T
b, τ) ratio (a), of the τ
0(X, T
b) difference (b), and of the T
b(X, τ) −T
b0(X, τ) difference (c), and of the  horizontal stress gradient (d). At the first order, the existence of a flow law should ensure a link between X, τ and T
b. These maps display the geographical anomalies of each parameter. Note that X mostly shows a large-scale signal, while τ shows local across-slops anomalies.
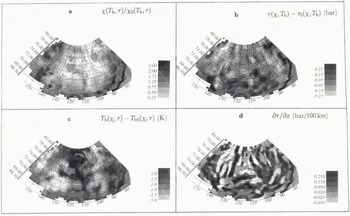
Finally, the same scheme is also applied to temperature. In figure 3c, the pattern looks like the T b, pattern (Fig. 2c): this means that for a given (X, τ) any value of T b, can be found; the averaged value is neither significant nor representative of a given (X, τ). First, temperature profiles are mostly controlled by other parameters: for instance, as already mentioned, warm temperatures can be found both in the central part where vertical advection is weak and in the coastal regions where dissipation is important. Secondly, the velocity and the X dependence on temperature is relatively weak: for n = 3 and τ = 0.5 bar (a typical mean value), a stress variation of 0.1 bar leads to a change by a factor of 2 in the estimate of the velocity, whereas the temperature must vary by 6°C to produce the same effect for a 60 kJ mol−1 activation energy. The great sensitivity on the stress component decreases the temperature effect. As a consequence, temperature does not play an important numerical role, as already suggested by Young and others (1989).
b. Discussion
We are looking both for a long-wavelength mechanism (see the gradient between interior and coast on figure 3a) and for a medium-range wavelength (see alternative bands on figure 3b). There are three main explanations for these discrepancies: 1. Some erroneous assumptions have affected the flow-law parameters estimation; 2. We effectively omit some particular physical processes acting on ice flow (see point 5 in the introduction); 3. An external parameter has a systematic effect on B 0, Q or n. We now examine the impact of these mechanisms on the estimation of the different geophysical parameters.
1. Velocity
Sliding may play a major role, decreasing the estimate of the deformation velocity (U(Equation (1)) > V (Equation (3))). Sliding or any other cause of local velocity enhancement creates a positive anomaly on X(X(T b, τ)/X0(T b, τ) > 1) and a negative one on τ. This is indeed what we observe near the outlet glaciers (see at 76° S or 80° S, 150° E or near lakes (see Astrolabe lake, 69° S, 137° E; or Vostok lake, 77° S, 105° E).
2. Bedrock
The presence of the bedrock (Fig. 2d) also plays a role in the behaviour of ice flow. If basal ice meets a bedrock obstacle, its flow direction may not be in the surface-flow direction, so that the computed balance velocity is overestimated (Equation (1)), while the true deformation velocity is decreased. Bedrock channels (for instance, near 72° S, 108° E) or along 145° E (see Fig. 2d)) create basal convergence zones. This would induce positive anomalies on X and negative stress anomalies.
3. Stress
The accuracy of the altimetric topography is submetric when the surface slope is weak but may only be of the order of 5 m when the surface slope is steeper. Thus, in the central part of Antarctica, for a 3000 m thickness and a slope estimated over a 20 km characteristic length scale, the accuracy of the retrieved stress is 0.015 bar, whereas it is only 0.33 bar at a lower altitude and a 1500 m thickness. If one assumes a 100 m error bar on the ice thickness, the same order of accuracy is reached on the stress. Notice that since the accuracy of the ERS-1 altimetric topography is about ten times better than the accuracy of previous maps, it is the first time that such anomalies have been mapped with confidence.
An important source of error is the shallow-ice approximation: (τe, may not be equal to τ). This is probably the mechanism that produces the along-slope alternative signal (Fig. 3b), with a 100–200 km wave-length, if such stress can be transmitted over distances larger than 200 km. Point 4 mentioned in the introduction is then true: longitudinal stress must be taken into account, even when working at a 50 km scale, as is done in this paper.
As we have already mentioned, a local enhancement of the flow velocity (because of sliding, for instance) will reduce the local shear stress. A first possible explanation is that, in order to compensate for ice-flow variation, a negative anomaly on τ is surrounded by both an upslope and a downslope positive anomaly (see, for instance, near the Vostok “lake”). A second possible explanation is that a local enhancement of velocity will drag away upslope ice (extension) and push ice down (compression), also leading to both upslope and downslope stress anomalies. The same phenomenon is true in the case of bedrock presence and thus leads to the same alternative structure.
Figure 3d displays the horizontal upslope gradient of the shear stress: one can observe the same across-slope alternate bands related to the anomalies. It seems as though stress undulations of 200 km wavelength are typical features of Antarctic ice flow. This supports the second explanation. First, the wavelengths are regular: by smoothing the strain, longitudinal stress may prevent a small-scale signal. Secondly, this effect is too frequent to be due to local sliding only and it is thus probably due to other causes.
Finally, if longitudinal stress plays a role at a small scale, one can wonder whether the large-scale behaviour of longitudinal stress also contributes to the large-scale X signal. We will discuss this further.
4. Temperature
The primary cause of error in T b, is the steady assumption which is erroneous (Huybrechts and Oerlemans, 1988). The interior regions are probably still warming as a consequence of the last climatic warming, while the coastal regions are already stable1. The true interior temperature, for instance at Vostok, should then be colder by 2τ or 3τC than the computed one (Ritz, 1992), leading to a reduction in the velocity by 30%. A second cause of error in T b, lies in the computation of the dissipation term. Close to the ice-column base, this term increases strongly and the numerical discretization could be inadequate to describe the rapid variation. This will affect the temperature in proportion to both the basal velocity and the shear stress. By reducing the deeper-temperature grid size by a factor 2 or more, the maximal difference on the basal temperature only reaches 1.5τC.
At last, a third cause of error in T b, is the uncertainty of the geothermal flux value. This factor plays a role where the geothermal flux is dominant, e.g. in the interior. Assuming a 55 mW m−2 geothermal flux instead of a 50mW m−2 one enhances the temperature up to 5°C in the interior regions.
This last effect is the dominant one. The observed ratio X(T b, τ)/X0(T 0, τ) is lower than 1 in the interior region, suggesting colder temperatures for these regions or a smaller geothermal flux, which does not seem to be the case (Ritz, 1989). Although these effects would alter the large-scale basal temperature, they cannot explain the whole large-scale signal.
5. Thickness
An incorrect estimate of this parameter induces cumulative undesirable effects at each step in the computation process. For instance, from radio-echo-sounding observations, Robin and Millar (1982) suggested that we sometimes overestimate the active part of the ice thickness. Let us assume that the 10% basal-ice layer does not play any role in ice flow. Then, the continuity equation (Equation (1)) will lead to underestimates of the mean velocity by 10% and X will be underestimated by 20%. In contrast, the deformation velocity will be overestimated by 30% if n = 3. There will thus be an additional 50% disagreement between the mean velocity and the deformation velocity. This phenomenon produces a negative anomaly on X or a positive one on τ, as is observed at 73.5° S, 104° E where the bedrock shows a depression (Fig. 2d).
6. External parameter acting B0, Q or n
As already mentioned, the pre-exponential B 0 factor seems to vary with respect to the orientation of c axes, to crystal structure and to the concentration of impurities. For instance, from radio-echo-sounding observations, Robin and Millar (1982) suggested that ice grains are deposited with random crystal orientation al centres of outflow. As the flow increases, a strongly oriented fabric develops, which enhances the flow in its turn (Pimienta and Duval, 1987). The fabric develops away from the dome. The enhancement factor is roughly between 2 and 10 (Alley, 1992) for a 1% strain. This mechanism is thus qualitatively in good agreement with the X large-scale anomaly map but the lack of basal-fabric estimations prevents us from undertaking a more complete study.
IV. Behaviour of Rheological Parameters
a. Estimation of temperature-dependence
Equation (3) can also be written as

where T b includes T m (T b = T b – T m). The large density of data allows us to sample the temperature variable at a 1° rate. We then get from 800 to 1000 data points for each basal-temperature sample from 0° to –10°C and around 500 data points for each colder temperature sample. Moreover, the stress values arc well distributed at each temperature level. For each T b0, value, one can calculate n(T b0) and ln(B 0) + kT b0 using a linear regression. Both values exhibit a temperature-dependence (Fig. 4). lnB 0 + kT b0 increases lineally with basal temperature T b0; the linear regression coefficient is 0.115, leading to k = 0.115 or to a 70 kJ mol−1 activation energy, as already found by Rémy and Minster (1993); this corresponds to the classical value used in models. Note that B 0 and Q may vary together, leading to a more complex temperature function but Figure 4 suggests that the variations are roughly compensated. The index n also varies with temperature; it is around 1 for temperatures lower than −10°C and increases with temperature.
Glen exponent n value and ln(B 0) + kT b, value with respect to basal temperature. Small points are directly obtained from regression of Equation (5). The linear behaviour ln(B 0) + kT b suggests that B 0 and k or Q are constant with temperature. The fitted straight line then gives k = 0.11 or Q = 70 kJ mol−1; the open circles are obtained by integrating Equation (2) and assuming B 0 and Q constant.
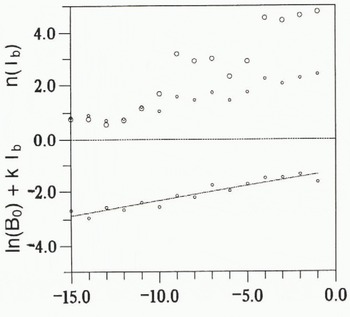
If n varies with temperature, Lliboutry’s (1981) analytical expression (Equation (3)) may be unsatisfactory and Equation (2) must then be numerically integrated. By looking at Figure 4, one can assume that n ≈ 1 for temperatures colder than −10°C and that B 0 and Q are constant. Because the basal temperature is the warmest one in the column, we selected data points from increasing basal temperature, at a 1° rate. We then looked for the best fit for n(T), sample by sample, from the colder basal-temperature sample to the warmer one. The new n(t) values increase to 3 for temperatures from −10° to −4°C and up to 4.5 for warmer temperatures (see Fig. 4), These values are in good agreement with other estimations (see point 2 of the introduction).
b. Behaviour of rheological parameters against the X large-scale signal
In order to understand the origin of the large-scale signal and/or its effect on the retrieval of the rheological parameters, we separate tbe data set into two sub-sets defined by X(T b, τ)/X0(T b, τ) > 1 or < 1; then we look for the behaviour of Equation (5) with temperature. Variations of n and k values (k is tbe slope of the term ln(B 0) + kT b) with temperature are identical for the two sub-sets, whereas B 0) (the constant term of ln(B 0) + kT b) values differ by a factor of 3 (Fig. 5). This suggests that the retrieval of n and k (or Q) is not affected by this large-scale signal. This also suggests that the X large-scale trend is mostly due to variation of the pre-exponential factor B 0 (see point 3 of the introduction). As a matter of fact, a significant signal of longitudinal stress would affect the estimation of the Glen exponent because the effective shear stress includes both the shear stress and the longitudinal stress. In the same way, a significant non-steady-state signal or a wrong temperature calculation would affect the estimate of Q.

Conclusion
From the very accurate surface topography of the Antarctic ice sheet deduced from inversion of ERS-1 altimeter data, we can determine the ice-flow direction, the balance velocity and the basal shear stress. The Vialov (1958) equation and Lliboutry’s (1981) assumption yield a relation linking the three following geophysical parameters: (V/H)(p + 2) (where p includes ice-column characteristics and temperature profile), shear stress τ and basal temperature T b. If one assumes that the rheological parameters n, Q and B 0 only vary with one of these three geophysical parameters, this relation allows us to map the behaviour anomalies of each geophysical parameter.
Several medium-scale anomalies affect the shear-stress map. The medium-scale anomalies are mostly explained by the longitudinal stress, which can be due either to sliding or bedrock presence and which shows effects on a 100–200 km scale. This longitudinal stress must then be taken into account in the ice-flow modelling.
A strong large-scale anomaly is observed in (V/H)(p + 2): ii seems to be mostly due to a variation in B 0 but it certainly is partially affected by the poor knowledge of the geothermal flux and by the large-scale longitudinal stress signal.
Finally, one can show that the Glen exponent increases from 1 for temperature below −10°C to 3–4 for higher temperatures. The behaviour of the Arrhenius relation with respect to temperature suggests that the values of B 0 and of Q (Q = 70 kJ mol−1) do not depend on temperature.
The above results obtained with the help of the first global and accurate surface topography of Antarctica prove the power of the approach. A next step should be the direct assimilation of altimetric data into ice-flow models.
Acknowledgements
We are grateful to Dr P. Duval, of the Laboratoire de Glaciologie et Géophysique de l’Environnement, and to Dr P. Vincent from the Centre National d’Études Spatiales, for helpful discussions and comments. Also, we are grateful to Dr R. G. A. Hindmarsh of the British Antarctic Survey, for his comments.



