Introduction
Land-use pattern terms indicate the interaction of human activities with natural environment (such as forest) and their utilization by man in time and space. Information on land-use changes is important for planning and implementation of schemes for the welfare of people and natural resources (Rawat & Kumar Reference Rawat and Kumar2015). Conversion of the important resource of forest land into different land-use types is a primary cause of resource degradation, which in turn alters nutrient and carbon cycles, land productivity and diversity of species (Borrelli et al. Reference Borrelli, Robinson, Fleischer, Lugato, Ballabio, Alewell, Meusburger, Modugno, Schütt, Ferro, Bagarello, Oost, Montanarella and Panagos2018). All these factors are intrinsically related. It also accelerates soil degradation in the tropics (Bustamante et al. Reference Bustamante, Roitman, Aide, Alencar, Anderson, Aragao, Asner, Arlow, Berenguer, Chambers, Costa, Fanin, Ferreira, Ferreira, Keller, Magnusson, Morales-Barquero, Morton, Ometto, Palace, Peres, Silverio, Trumbore and Vieira2016), where the combination of climate and poor soil management practices speeds up the process of decomposition and soil nutrient loss. In Indian dry tropical regions, land-use change (LUC) causes deterioration of soil quality and stability (Singh et al. Reference Singh, Singh and Ghoshal2017), which affects agricultural productivity, food security and the overall resilience of the socio-ecological system. Conversion of dry tropical forest into degraded forest or any other simplified ecosystem is mainly due to the overutilization of various forest products, cultivation and cattle grazing (Singh et al. Reference Singh, Astley, Smith and Ghoshal2015). An estimated 6 million km2 of forest/woodland and 4.7 million km2 of grassland areas have been converted into cropland worldwide since 1850 (Lambin et al. Reference Lambin, Geist and Lepers2003) to obtain food and other essentials.
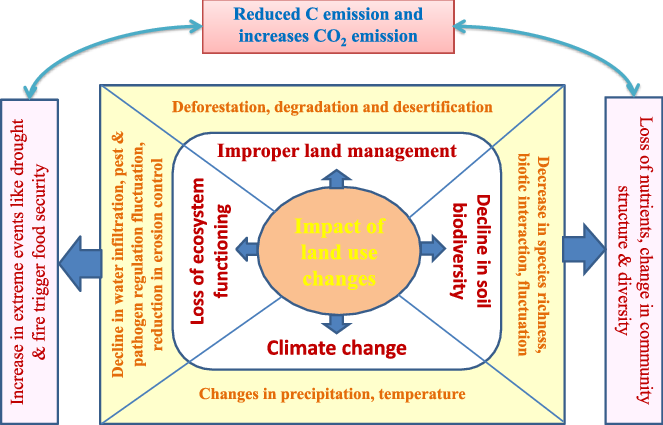
Various factors influence human activity, including local culture, economics and environmental conditions. There is a direct relationship among LUC, soil quality, biodiversity and climate (Figure 1). The impact of land-use changes is reflected in a loss of ecosystem functioning, decline of biodiversity and climate change. Soil organic carbon (SOC) is an important component of the global carbon cycle and there is significant variation in SOC with LUC (Ali et al. Reference Ali, Begum, Hayat and Bohannan2017, Maurya et al. Reference Maurya, Singh, Dhyanib and Kashyap2014). SOC drastically decreases as natural forest is converted into plantation or other LUC (Guillaume et al. Reference Guillaume, Damris and Kuzyakov2015, Manpoong & Tripathi, Reference Manpoong and Tripathi2019).
Interlinking of land use changes with soil, biodiversity and climate.

Land-use changes can have either direct or indirect effects on native biodiversity. Species diversity is an indicator of soil fertility and ecosystem stability, one of the major drivers of ecosystem sustainability. Land-use changes into a monoculture cropping system resulted in greater loss of species numbers than a mixed cropping system (Reidsma et al. Reference Reidsma, Tekelenburg, Van Den Berg and Alkemade2006). A change in practices from grazing to broad acre cropping would have negative outcomes on native biodiversity. Grazing increases the bulk density and moisture content through compaction and exposure of soil to the sun but reduces most soil nutrients through feeding and subsequent erosion due to the reduced ground cover. Land disturbance particularly by grazing, mining and urban development causes removal of native vegetation and disturbed soil generally promotes invasive alien species. Tilman et al. (Reference Tilman, Fargione, Wolff, D’Antonio, Dobson, Howarth, Schindler, Schlesinger, Simberloff and Swackhamer2001), Gaston (Reference Gaston2000) and Wilson et al. (Reference Wilson, Abernethy, Murphy, Adam, McCracken, Downie, Foster, Furness, Waterhouse and Ribera2003) showed a strong correlation between land-use intensity and biodiversity loss.
Previous studies suggest that there are many driving forces behind LUC, leading to soil fertility degradation and species production deterioration (Szoboszlay et al. Reference Szoboszlay, Dohrmann, Poeplau, Don and Tebbe2017, Wolde Yohannes et al. Reference Wolde Yohannes, Cotter, Kelboro and Dessalegn2018), especially in tropical forest regions (Sagar et al. Reference Sagar, Raghubanshi and Singh2003). There is scarcity of information about land-use changes (in four land-use types) and their effect on relationship of soil quality and species diversity at landscape level in the Vindhyan dry tropical region. Tropical dry forest occupies only 7% of overall land surface but constitutes more than half of the species globally (Galley Reference Galley and Monson2014). Presently, total forest cover in India is 21.54% (FSI, Forest Survey of India 2017). Of this, tropical forest covers 81% and tropical dry deciduous forest accounts for 41.87% of total forest. This forest is continuously decreasing in the Vindhyan region (Chaturvedi & Raghubanshi Reference Chaturvedi and Raghubanshi2011). The Vindhyan dry tropical forest region is characterized by deciduous trees such as Shorea robusta, Anogeissus latifolia, Lagerstroemia parviflora, Terminalia tomentosa, Hardwickia binata, Boswellia serrata, Buchanania lanzan, Acacia catechu. Continuous monitoring of patterns and trends of changes in soil quality and biodiversity under different LUC at local, regional and global scale is important as it provides evidence-based support to improve land management of restoration practices. The objective of the present study is to evaluate the impact of land-use changes on soil physicochemical qualities and the influence of these qualities on species diversity and organic matter accumulation, and also to establish the relationship between soil quality indicators and species diversity parameters.
The present study addresses the following questions:
1. What is the (major) driving force that impacting on land conversion, decreasing land fertility along with decline in productivity?
2. How do land-use changes alter soil quality?
3. What are the trends of species diversity under different land-use changes?
Materials and methods
Study area
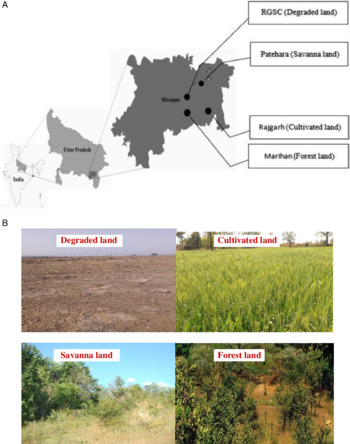
The experiment was conducted in four different land use types (with three replicate sites, total 12), situated in the Vindhyan region of district Mirzapur, India, which comes under the vicinity of Rajiv Gandhi South Campus (RGSC) (25°10′N, 82°37′E; 146 m asl) occupying an area of about 2600 acres (Figure 2). The forest land (FL) and cultivated land (CL) sites are in the Marihan and Rajgarh range of Mirzapur, ∼8–10 km away from RGSC, whereas the savanna land (SL) lies 1 km away from RGSC and the degraded land (DL) is in the RGSC campus. The dominant species of the FL are Acacia nelotica (Linn.), Boswellia serrata var. glabra (Roxb.), Butea monosperma (Lam.), Terminalia arjuna (Roxb.), Tectona grandis L.f., Dalbergia sissoo Roxb. The region is undergoing rapid changes due to human disturbance, deforestation and construction. The degraded sites are undergoing unplanned land use, intensive farming, and harvesting of forest resources leads to conversion of forest to degraded forest; dominant species are Ziziphus mauritiana Lam. and Ziziphus glaberrima L. The CL lies in the Rajgarh area which has been used for 25–30 years to fulfil the requirements of expanding human populations. The SL lies in Patehara, characterized by very few trees, with dominant species being Cynodon dyctylon L., Ziziphus mauritiana Lam. and Solamum nigrum L. The DL was in RGSC, the dominant species was Ziziphus mauritiana Lam. (Figure 2).
Study sites. (A) Map of Mirzapur district, Uttar Pradesh, India, showing locations of different land-use patterns. Degraded land (DL), located at Rajiv Gandhi South Campus (RGSC), Banaras Hindu University; Savanna land (SL), at Patehara; Cultivated land (CL) at Rajgarh; and Forest land (FL) located at Marihan range. (B) Four different land changes (LUC).

Climate
The climate of Mirzapur is predominantly dry (sub-tropical to dry) characterized by extremes of temperature both in summers and winters with low rainfall and humidity. Maximum temperature in summer is as high as 48°C and minimum temperature in winter drops to 4°C during December and January. Winter season is short (December–February) but summer is long (March–November). The normal period of onset of monsoon in this region is third to fourth week of June, then ending in September or sometimes extending to the first week of October. Winter showers are often experienced in between December to mid-February. However, March to June is generally very dry. The average annual rainfall of Mirzapur is 1059 mm, of which 90% is received in the south-west monsoon. On average, out of total annual rainfall, the major fraction (75%) is received from July to September, but it is highly erratic and unpredictable, at times causing drought spells of varying degrees and durations.
Soil
The soil of this region is sandy loam red laterite in texture with low drainage made from Vindhyan rocks. Vindhyan soil comes under rainfed, invariably poor fertility status. The soil is slightly acidic in reaction (pH 6.5–6.8), poor in nitrogen as well as phosphorus and moderate in potash. The soil has poor amounts of organic carbon, below 0.8%. The slope orientation is shallow rocky and is badly affected by rain water and wind erosion. Therefore, the vegetation is scarce in this region due to poor nutrient availability in the soil and extreme dry climatic conditions. However, a better vegetation status is observed during rainy season.
Experimental design and analysis
The experiment was designed in a randomized block manner of four different land-use types. All the land-use type sites are near to Rajiv Gandhi South Campus, BHU. Each land-use area was divided into three sites (∼1.5 km area under each). Further, sites were divided into 9 sub-sites (3 in each site) in a randomized block manner in FL, SL, CL and DL. For soil and vegetation analysis, samples were taken from 9 sub-sites in each land use type. Samplings were done in all three seasons, that is in rainy, winter and summer seasons. For vegetation analysis, the size of quadrat was 0.5 km × 0.5 km at the FL site. The size of quadrats in SL, CL and DL were 5 m × 5 m. After taking the values, all were calculated at 100 m × 100 m (per hectare). Vegetation analysis was done only once in a year at all four study sites between April to March (2017–18).
For analysis of soil moisture, soil was excavated at a depth of 10 cm and oven dried at 105°C. Bulk density (dry weight per unit volume of soil) was determined by inserting metallic tubes (of known internal volume) in soil up to 10 cm soil depth and oven drying the enclosed soil core. Soil pH, soil temperature and EC were done in the laboratory using digital pH, thermometer and EC meter. Water-holding capacity of soil was measured by the brass cup method described by Piper (Reference Piper1966). Soil porosity was determined using bulk density (BD) and soil particle density (PD; 2.53 g cm−3) with the equation: (1–BD/PD) × 100. For all physicochemical analysis 9 replicates were used. For chemical analysis of soil, soil was collected at 10 cm depth from the four land-use types. All chemical analysis was done at the soil analysis laboratory, RGSC. Soil organic carbon was estimated by the Walkley & Black (Reference Walkley and Black1934) method and total nitrogen by the micro-Kjeldahl method (Jackson Reference Jackson1958).
Diversity indices were also calculated using the following equations:
Species diversity by Shannon-Weaver index, H’ = −Σ pi log pi (Shannon & Weaver 1963)
Species richness, d = (S − 1) / ln N (Margalef 1958)
Species evenness by Pielou’s evenness index, E = H’/lnS (Pielou 1966)
Where, S is the total number of species in the sample, N is the total number of individuals of all species and pi is the proportion of all individuals that belong to species I (the number of individuals of each species i/N).
Statistical analysis
Statistical analysis of data was done using SPSS package (version 16) All the values are expressed as mean ± standard error. Mean values were compared using least significant difference (LSD) range test procedure at 5% level of significance. Two-tailed Pearson correlation coefficients between soil properties and diversity indices of species at four study sites were calculated to observe the relationship between species diversity and soil properties.
Results
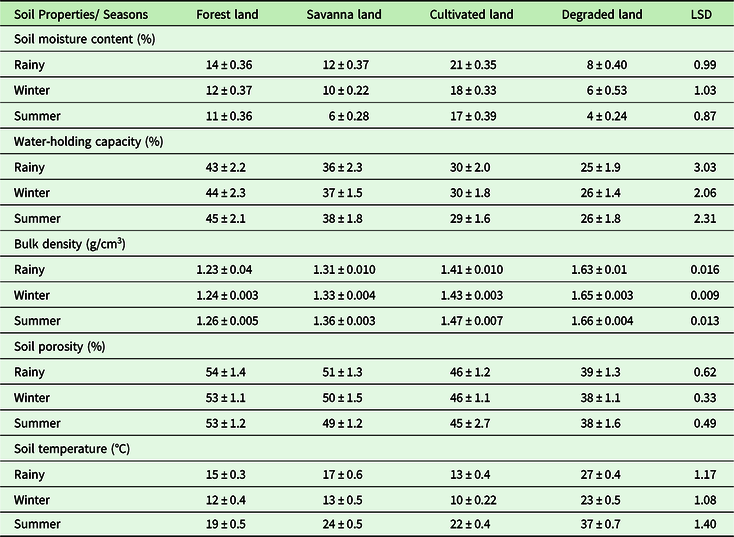
The soil physical properties under three seasons were found to be significantly different across the land-use types (P < 0.05) (Table 1). Bulk density values ranged from 1.23–1.66 g/cm3, with maximum density in degraded land (DL) which was followed by cultivated land (CL), savanna land (SL) and forest land (FL). Along with the increase in soil bulk density, soil porosity showed marked declines in DL (38–39%) compared with FL, SL and CL. Water-holding capacity (WHC) was greater in FL (43–45%), followed by SL and CL. WHC was significantly less in DL (25–26%). Only minor seasonal variations were noted in some soil attributes (e.g. bulk density, WHC and soil porosity). However, for soil moisture and soil temperature, seasonal variations were large. Soil moisture ranges from minimum 4% in DL during summer season and maximum 14% in FL in rainy season. Minimum soil temperature was 10°C during winter season in CL and maximum 37°C during summer season in DL. CL and SL showed maximum 22°C and 24°C temperature during summer season.
Variations in soil physical properties under different land-use types. Values are replicate mean ± SE and significant at 0.05 (P < 0.05)

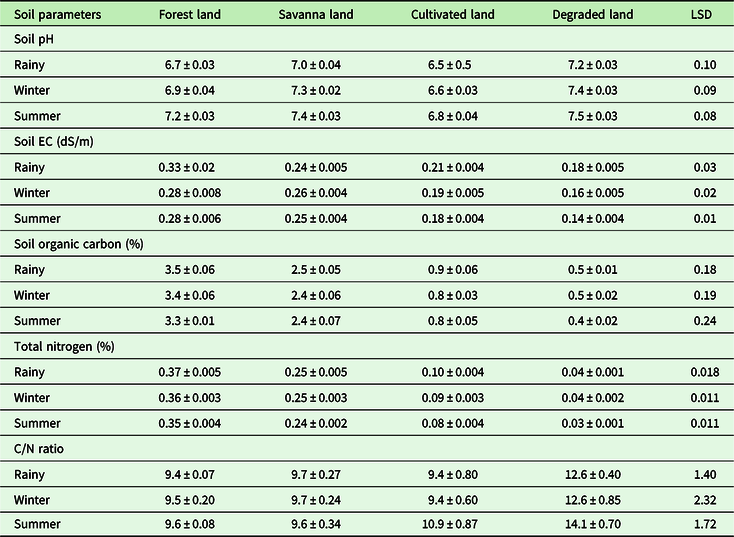
Table 2 shows the effect of the LUC from a forest and savanna to cultivated and degraded land system on soil chemical properties. The transition from a natural forest system to SL, CL and DL showed significant differences among land-use types in most of the soil properties. Soil pH varies from slightly acidic to neutral in reaction in all land-use types. Soil organic carbon (SOC) was higher in FL (3.3–3.5%) in all three seasons. Conversion from FL to SL resulted in decreased SOC by ∼27%, annually. This decrease were more pronounced in CL and DL (75% and 87%, respectively). In the case of total N, there was 33% reduction in SL and 75% in CL. Maximum decrease in total N was noted in DL, at 89% as compared with FL. Under different LUC, C/N ratio also varies. Maximum C/N ratio was observed in DL (12.6–14.1) compared with FL, SL and CL. Little variation of C/N ratio was seen in the remaining three LU types.
Variation in soil chemical properties under different land use changes. Values are replicate mean ± SE and are significant at 0.05 (P < 0.05)

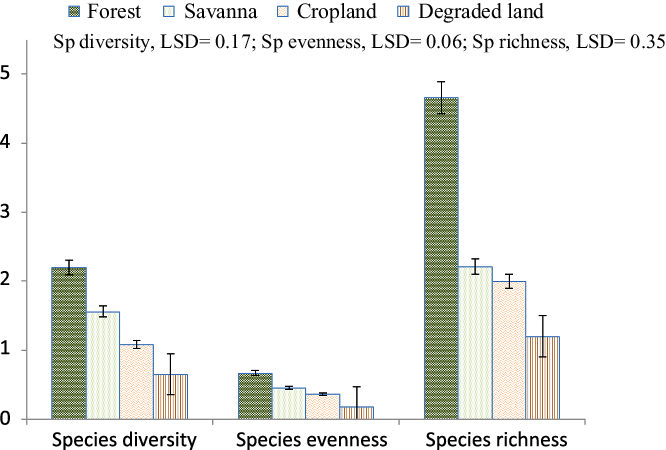
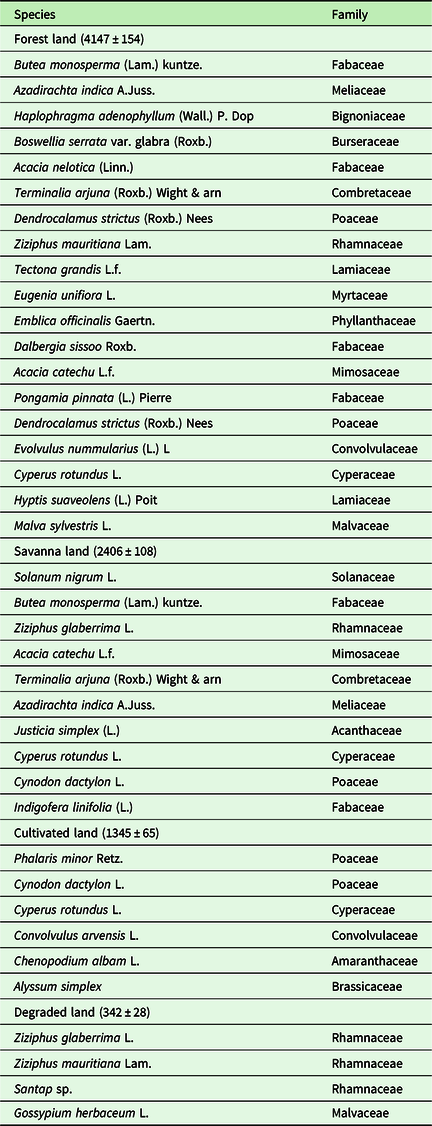
Variations in species diversity, species richness and evenness under four land use types are shown in Figure 3. Species diversity was higher in FL, followed by SL > CL > DL. Conversion from forest to savanna decreases diversity by 27%. This decrease was more in CL (51%) and maximum in DL (71%). Decrease in species richness and species evenness was more pronounced from conversion from FL to SL (decrease of 53% and 31%). DL has 73% and 75% less species evenness and species richness in comparison to FL. Comparable species evenness and species richness were recorded in SL and CL but species composition is different under the two land types. In CL, the majority of species were annuals and grasses whereas in SL there were few trees with herbaceous species present. This study shows not only the high rate of changes in soil quality under different LUC but also species diversity from forest and savanna to cultivated and degraded land. A list of dominant plant species and their density under different LUC in the study area is given in Table 3. Densities of plant communities vary from 4147 species in forest land, 2406 in savanna land, 1345 in cultivated land and only 342 species in degraded land per hectare in a year. FL was dominated by total 42 tree/shrub species such as Butea monosperma, Azadirachta indica, Haphophragma adenophyllum, Boswellia serrate, Acacia nelotica, Terminalia arjuna, Dalbergia sissoo, Tectona grandis and Hyptis suaveolens. Cultivated land was dominated by grasses, annual herbs and shrub species. DL was dominated by a few thorny species, for example Ziziphus glaberrina, Ziziphus mauritiana, with grasses (Table 3).
Variations in species diversity, species richness and evenness in four land-use types.

List of dominant plant species present under four different land-use types. Values in parentheses are density of plant per hectare area

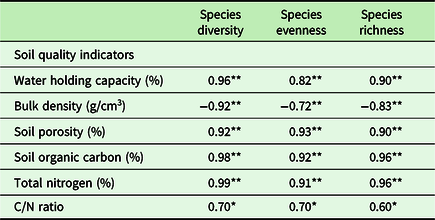
Pearson’s correlation coefficient analysis was performed among major soil quality indicators and species diversity parameters (Table 4). There was a positive correlation between water-holding capacity and species diversity. The reverse was true in the case of bulk density – as bulk density increases, species diversity, evenness and richness decreases. A strong positive correlation is seen between species diversity and soil organic carbon and total N. High organic carbon and nitrogen support species richness and diversity, under different LUC. A significant correlation was also noted among C/N ratio and species diversity, species evenness and species richness.
Pearson’s correlation coefficient analysis among major soil quality indicators and species diversity parameters. All values are significant at the 0.01 (**) and 0.5 (*) level

Discussion
This study showed significant impacts of different land-use changes on soil quality and species diversity in dry tropical region of India. Land-use change may lead to altered soil physical and chemical properties through its influence on various ecological processes. That bulk density was higher in DL and CL, and minimum in FL, could be due to profuse root growth and dense root distribution in forest compared with other land uses. In comparison to FL, 50% reduction in soil moisture content, porosity and water-holding capacity were noted in DL. There was also a decrease in CL, but in CL external water supply through irrigation was given time to time to maintain soil moisture, whereas porosity and water-holding capacity decreased drastically. An increase in bulk density as a result of conversion of forest to CL and DL is an indication of the level of soil degradation and has been demonstrated by many researchers (Guilser Reference Guilser2006, Manpoong & Tripathi Reference Manpoong and Tripathi2019, Singh et al. Reference Singh, Mishra, Singh, Ghoshal and Singh2009). High bulk density is a reflection of low soil porosity and soil compaction. It may cause restrictions to root growth and poor movement of air and water through the soil (Osakwe & Igwe Reference Osakwe and Igwe2013). The conversion of natural forest to CL and DL is probably due to loss of soil organic matter (SOM) that caused higher bulk density in these sites. In CL due to repeated events of sowing and harvesting, little accumulation of SOM occurred that caused higher bulk density. High water-holding capacity in FL and SL was due to greater accumulation of soil organic carbon. In DL and CL due to loss of top litter layer (indicating organic carbon) water-holding capacity decreased. It has been reported that water-holding capacity is closely linked to soil organic carbon (Singh et al. Reference Singh, Mishra, Singh, Ghoshal and Singh2009, Srivastava & Singh Reference Srivastava and Singh2002), as soil water accumulates in pore spaces and is adsorbed onto the mineral surface and SOM particles. This explains the 34% decrease in water-holding capacity in CL and 40% in DL relative to FL. The decrease was low in the case of SL compared with FL due to little accumulation of SOM. Soil organic carbon acts as an indicator of soil nutrient supply in tropical ecosystem.
There was little variation in pH in all types of land studied, except in CL, possibly due to accumulation of water through irrigation. Highest organic carbon and total nitrogen were reported in FL, followed by SL and then CL. CL showed an approximately four times decrease in organic carbon compared with FL. This lower organic carbon in CL was due to tillage operation and lack of soil cover, which accelerates erosion and decomposition processes (Cates et al. Reference Cates, Ruark, Hedtcke and Posner2016, Lemenih et al. Reference Lemenih, Karltun and Olsson2005). Seven times less organic carbon and nine times lower total nitrogen were present in DL compared with FL. Highest organic carbon in forest land might be due to regular addition of litter materials from above- and below-ground plant biomass (Ouyang et al. Reference Ouyang, Zhou, Wei, Huang, Li and Zhang2007). In forest and savanna, the contribution of below-ground biomass in organic carbon accumulation was more than above-ground. The expanded root system of perennial trees and grasses, lack of tillage and livestock addition also contributed more in organic carbon storage (Singh et al. Reference Singh, Mishra, Singh, Ghoshal and Singh2009) in these land-use types. It has been reported that organic carbon present in soil is proportional to biomass addition which in turn is dependent on biodiversity of that area (Catovsky et al. Reference Catovsky, Bradford and Hector2002, Lambers et al. Reference Lambers, Harpole, Tilman, Knops and Reich2004).
The results suggested that the changes in land-use types generated changes in soil physicochemical properties which resulted in alteration in species diversity. Highest species density (4147/hectare) and diversity (2.19) were noted in FL compared with SL and CL. DL showed minimum species density (342/hectare) and diversity (0.65). Lower soil organic carbon, total nitrogen and low soil moisture content support lower levels of species diversity. The same trend is reflected in case of species evenness and richness. Compared with other land-use types, SL showed more than a two times decrease in species richness. The species diversity parameter showed a negative relation with bulk density – as bulk density increases diversity and richness decrease. This may explained by the fact that higher bulk density supports lower porosity that provides less space for water in pore spaces. Low soil moisture supports selected thorny vegetation and a few grasses only. It was reported that salinity, soil texture, effective soil depth, potassium, organic matter, available nitrogen, lime and soil moisture criteria were the main soil parameters responsible for diversity in vegetation patterns in the Shahriyar rangelands, Iran (Zare et al. Reference Zare, Jafari, Tavili, Abbasi and Rostampour2011). Water-logging conditions also accelerated accumulation of organic matter in soil (Jafari Reference Jafari2006). The higher densities of dominant species can also result in more organic matter in the soil. In the present study, soil organic carbon and total nitrogen are projected to be the two most influential soil fertility indicators for plant species to establish their diversity, richness and evenness in all land-use types. Hersak (Reference Hersak2004) studied sand dunes of the northern parts of Croatia and suggested that soil organic matter and nitrogen content should be considered as the most important factors to define plant succession. It has also been reported that conversion of natural grasslands to other land-use types dramatically alters habitat characteristics, including vegetation type, plant community composition, diversity, productivity and soil properties (Fahrig Reference Fahrig2017, Mortelliti et al. Reference Mortelliti, Amori, Capizzi, Cervone, Fagiani, Pollini and Boitani2011). Conversion of natural forest land into savanna or cultivated land and ultimately into degraded land in this study was due to anthropogenic activities. Just to fulfil the demand of the local population for fuel wood, fodder and agricultural products, complex sustainable ecosystems such as forest were converted into simpler ones such as agroecosystems. Due to loss of the top fertile layer by erosion and tillage, loss of the native soil seed bank occurred, causing biodiversity loss. Less diversity and richness and a low fertility layer leads towards formation of degraded land. So, in this study anthropogenic pressure acts as a major driver of land-use changes. A long-term study is needed to understand the chronological sequence of effects due to land-use changes in the Vindhyan dry tropical region.
Conclusion
The study highlights the changes in soil properties under different land-use changes in Vindhyan dry tropical region. The results showed a distinct change in soil physicochemical properties with land-use change. These changes ultimately lead to species density and diversity loss. The present study recommends that for management and restoration of land resources, planning strategies should consider the current landscape structure, with land-use planning.
Acknowledgements
We are highly indebted to Dr Ashish Latare, Soil science, Institute of Agricultural Sciences, RGSC, Banaras Hindu University for supporting laboratory facilities. We are also thankful to the other MSc students for extending their heartfelt cooperation and support for doing the experiments and helping us in preparing this paper.