Implications
Reducing phosphorus supply in pigs’ diets is a crucial step for addressing environmental and economic concerns associated with this mineral in the field. The present study contributes to better understand the consequences of a phosphorus and calcium depletion and repletion on growth performance and bone mineralization in growing pigs. It showed that pig producers can reduce dietary phosphorus supply during a 28-day feeding period without modifying growth performances and bone mineralization at slaughter due to an increased digestible phosphorus and calcium utilization efficiency when a dietary phosphorus and calcium depletion–repletion strategy is applied. The results will help to formulate environmentally friendly and low-cost diets and improve pig production sustainability.
Introduction
The intensification of livestock production systems in recent decades, especially in countries with dense animal populations, has led to increasing environmental awareness, searching for alternatives, and the introduction of legislation to limit nutrients excretion and land manure application. Dietary phosphorus (P), the third-most expensive ingredient after protein and energy, is mainly supplied in cereal-based diets as phytic P, a form poorly available to monogastric animals, leading to the excretion of more than 50% of the ingested P (Jondreville and Dourmad, Reference Jondreville and Dourmad2005). The diet is therefore supplemented with additional inorganic P, a limited non-renewable source that increases feed costs (Cordell et al., Reference Cordell, Drangert and White2009). For these reasons, minimizing dietary P has become an important objective for a sustainable pig production system.
Lowering P content in pig diets can increase its utilization efficiency by improving digestive and metabolic P utilization to cope with the dietary shortage of this nutrient (Underwood and Mertz, Reference Underwood and Mertz1987). This metabolic adaptation can be a way of reducing the dietary P supply, feed costs and the environmental impact associated with this mineral. Previous studies in pigs have shown that a mineral restriction (i.e. depletion) followed by a diet that fulfilled or exceed requirements (repletion) improves the efficiency of mineral retention during both the depletion and subsequent repletion phases (Aiyangar et al., Reference Aiyangar, Au, Crenshaw and Ploeg2010). A higher P retention efficiency due to a depletion–repletion sequence can rectify mineral deficiencies without affecting pig growth performance (Ryan et al., Reference Ryan, Lynch and O’Doherty2011; Varley et al., Reference Varley, Sweeney, Ryan and O’Doherty2011; Létourneau-Montminy et al., Reference Létourneau-Montminy, Lovatto and Pomar2014). However, the extent and impact of this metabolic conditioning on animal performance and bone mineralization may vary depending on pig genetics, age, and the length or intensity of the dietary modifications. Elucidation of the mechanisms involved in the response of pigs to depletion and repletion sequences is needed to maximize pig dietary P and Ca retention efficiencies and thus reducing dietary P supply. The objective was to study the impact of using concomitant P and Ca depletion and repletion feeding sequences on pig growth performance and body mineral composition.
Material and methods
Animals and feeding
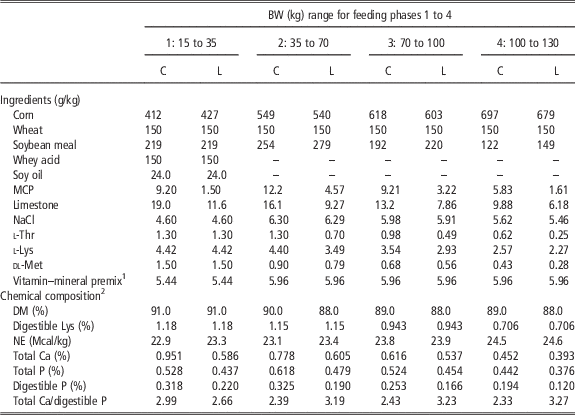
The pigs had free access to feed and fresh water and were cared for in accordance with the recommended code of practice (Agriculture and Agri-Food Canada, 2012) and the guidelines of the Canadian Council of Animal Care (2009). In all, 60 castrated male pigs ((Large White×Landrace)×Pietrain) with an initial BW of 14±1.6 kg and final BW of 132±10.3 kg were used. The pigs were housed in two separate pens and received a low (L) or control (C) diet. The C diet was formulated to fulfill all nutrient requirements. The L diet was similar to the C diet but contained only 60% of the estimated (apparent) digestible P requirements (National Research Council, 2012; Table 1) in a fixed Ca:dig P ratio (Jondreville and Dourmad, Reference Jondreville and Dourmad2005). Animals were fed according to a four-phase feeding program, each phase being 28 days long (15 to 35, 35 to 70, 70 to 100 and 100 to 135 kg BW). The optimal digestible P concentrations in the C diets were estimated at 3.6, 3.2, 2.6 and 1.9 g/kg for feeding phases 1, 2, 3 and 4, respectively, whereas the L diets were estimated at 2.2, 1.9, 1.5 and 1.1 g/kg, respectively, with a constant Ca:digestible P ratio of 2.9 in all phases. Diets were steam-pelleted into 4-mm pellets, and a representative sample of each diet was collected every 2 weeks for subsequent analysis. Each of the two experimental treatments per phase (L or C) was supplied in a pen measuring 48 m2. Over the four growing phases, six dietary sequences were tested: CCCC, CCCL, CCLC, CLCC, LCLC and LLLL (for each sequence, letters indicate the diet received in phase 1, 2, 3, and 4, respectively). Pigs receiving an L diet during a given phase are identified as depleted pigs and the phase as a depletion phase. Pigs receiving a C diet after an L diet are identified as repleted pigs and the phase as a repletion phase. Pigs were randomly assigned to one of the six feeding sequences (10 animals/sequence) and moved to the appropriate dietary treatment pen at the beginning of each feeding phase. Pigs were housed in two groups of 20 to 40 pigs/pen depending of the phases. When pigs were moved from one pen to another, they were observed during 2 h to ensure any fighting. Moreover, pens presented isolated hallways around, in such a way pigs could isolated themselves from the others or be isolated if needed. Individual BW was recorded weekly, and individual feed intake was recorded daily using an automated recording system (IVOG feeding stations; Insentec B.V., Marknesse, the Netherlands), except during the first growing phase, when the pigs were too small for an accurate feed intake measurement with this system.
Ingredients and chemical composition of experimental pig diets (as-fed basis)

C=control diet; L=low diet; MCP=monocalcium phosphate; DM=dry matter; NE=net energy; Ca=calcium; P=phosphorus.
1 Vitamin and mineral premix composition, supplied per kg of diet: corn, 673 g/kg; iron sulfate mono 30%, 65.98 g/kg; copper sulfate, 23.99 g/kg; manganese sulfate 32%, 6.24 g/kg; zinc sulfate 36%, 55.53 g/kg; EDDI 80%, 0.08 g/kg; selenium 1%, 6.00 g/kg; no mold, 100 g/kg; Endox, 25 g/kg; vitamin A 1 000 000 cross-linked, 2.28 g/kg; vitamin D3 500 000, 0.46 g/kg; Calpan 98%, 3.33 g/kg; riboflavin 80-SD, 0.75 g/kg; vitamin E 50%, 24.0 g/kg; vitamin K3 MNB 96%, 0.92 g/kg; vitamin B12, 6.0 g/kg; supra folic acid 96%, 0.15 g/kg; pyridoxine 98%, 0.49 g/kg; biotin 2%, 1.5 kg/tm; thiamin 98%, 0.47 g/kg; niacin, 3.8 g/kg.
2 DM, total P and Ca were analyzed, the other variables were calculated from Sauvant et al. (Reference Sauvant, Perez and Tran2004); digestible P has been adjusted using the difference between total P analyzed and calculated.
Measurements
At the beginning and end of each growing phase, pigs were weighed and anesthetized, and the whole-body and lumbar vertebrae 2 to 4 (L2 to L4) were scanned by dual-energy X-ray absorptiometry (DXA) using a Lunar-DPX densitometer (GE Lunar Prodigy; Lunar Corp., Madison, WI, USA) to quantify the whole-body bone mineral content (BMCb) and the bone mineral content in lumbar vertebrae L2 to L4 (BMCv). The pigs were anesthetized by mask inhalation of sevoflurane (Sevorane; Abbott Laboratories, North Chicago, IL, USA) at an oxygen concentration of 7% until sleepiness. When sevoflurane was not enough to induce sleepiness, animals received an injection of azaperone (2.2 mg/kg BW; Stresnil; Jansen-Cilag, Neuss, Germany). Sevoflurane was then replaced by isoflurane (IsoFlo; Abbott Laboratories) at an oxygen concentration of 5% in order to keep the pigs anesthetized during scans. For the whole-body and L2 to L4, respectively, the animals were scanned in prone position in standard small-animal mode and standard spine mode at 15 kg, in standard total-body mode and standard spine mode at 35 kg, and in thick total-body mode and thick spine mode at 70, 100 and 135 kg. After the scan, the pigs were awakened in a quiet room and then returned to their pens.
Calculations
Total daily feed consumption for each pig was obtained as the sum of every meal recorded individually by the IVOG feeding station, and was used to calculate the average individual daily feed intake (ADFI). Average daily gain (ADG) was obtained every 4 weeks as the difference between the final and initial BW, divided by 28, the duration of each period. Feed efficiency (gain to feed, G:F) was calculated for each pig as the ratio between ADG and ADFI. Body P and Ca were calculated as the sum of the P and Ca present in the bones, proteins and lipids of the body based, respectively, on the BMCb, lean tissue and fat tissue values obtained by DXA scan. The content of P and Ca in bone were assumed to represent 18% and 36% of the BMCb, respectively, in protein were assumed to be associated with lean tissue containing 1.04% P and 0.042% Ca, and in lipid were associated with fat tissue containing 0.05% P and 0.005% Ca (Nielsen, Reference Nielsen1973; Létourneau-Montminy et al., Reference Létourneau-Montminy, Narcy, Dourmad, Crenshaw and Pomar2015). Daily gains in BMCb, BMCv, Ca and P were then calculated for each phase as the difference between the final and initial values, divided by 28 days. The digestible P and total Ca retention efficiencies were calculated by dividing P and Ca gains by digestible P and total Ca ingestion, respectively.
Chemical analysis
Representative samples of each diet were taken upon delivery and once weekly throughout the experiment. The samples of each diet were mixed together at the end of each phase to obtain a representative composite sample and analyzed thereafter using Association of Official Analytical Chemists (1990) standard methods for dry matter (Method 950.46) and ash (Method 920.153). Calcium concentration was obtained by inductively-coupled plasma spectrometry (ICP-ES Perkin-Elmer Optima 3000; PerkinElmer, Whaltham, MA, USA; Method AOAC 984.27), whereas P concentration by colorimetric analysis (Lambda-35 spectrometer; PerkinElmer; Method AOAC 995.11).
Statistical analysis
The effects of the dietary treatments and their interactions were evaluated separately for each of the four feeding phases with a priori polynomial contrasts using the SAS MIXED procedure (v9.1) with the pig as the experimental unit providing 10 replicates/treatment, after the normality of the variables were checked using the Shapiro–Wilk test. Orthogonal contrasts were used during the first feeding phase to compare C and L diets; thereafter, contrasts were used to study depletion duration (linear and quadratic polynomial contrast: CC v. CL v. LL) and repletion (orthogonal contrast: CC v. LC) during the second feeding phase; one depletion phase (orthogonal contrast: CCC v. CCL), depletion duration (linear and quadratic polynomial contrast: CCL v. LCL v. LLL) and one repletion phase (orthogonal contrast: CCC v. CLC) in the third growing phase; and depletion duration (linear and quadratic polynomial contrast: CCCC v. CCCL v. LLLL), two non-consecutive repletions (orthogonal contrast: CCCC v. LCLC) and repletion duration (linear and quadratic polynomial contrast: CCCC v. CCLC v. CLCC) in the fourth feeding phase. Differences were considered significant when P<0.05, and P<0.10 indicated a statistical trend.
Results
The analyzed values of Ca were, respectively, higher than expected in L diet and lower than expected in C diet resulting in induced deficiency lower than the 40% expected, with a 38%, 22%, 13% and 13% reduction in Ca, whereas that of digestible P was close to what expected (respectively, 31%, 40%, 34% and 38%; Table 1).
First growing phase
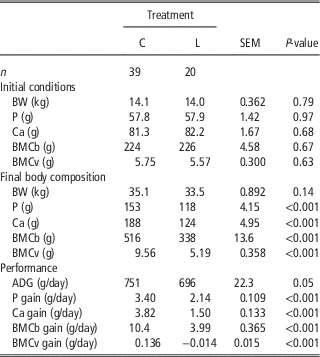
As the BW of the pigs was too low for accurate measurement of feed intake by the automated system used, the ADFI and G:F were not available for this phase (Table 2). Initial BW and body composition did not differ among dietary treatments. At the end of the phase BW was not different among treatments, and depleted animals (L treatment) had a lower ADG (P=0.05) compared with C pigs. A 28-day depletion reduced body P and Ca content and BMCb and BMCv (P<0.001) compared with C animals. Lower gains in body P and Ca content and in BMCb and BMCv (P<0.001) were also found in depleted pigs than in non-depleted pigs.
Growth performance and bone mineralization in pigs from 15 to 35 kg BW

C=control diet; L=low diet; P=phosphorus; Ca=calcium; BMCb=whole-body bone mineral content; BMCv=lumbar vertebrae L2 to L4 bone mineral content; ADG=average daily gain.
SEM, the highest value was reported; number of pigs=C: 39, L: 20.
Second growing phase
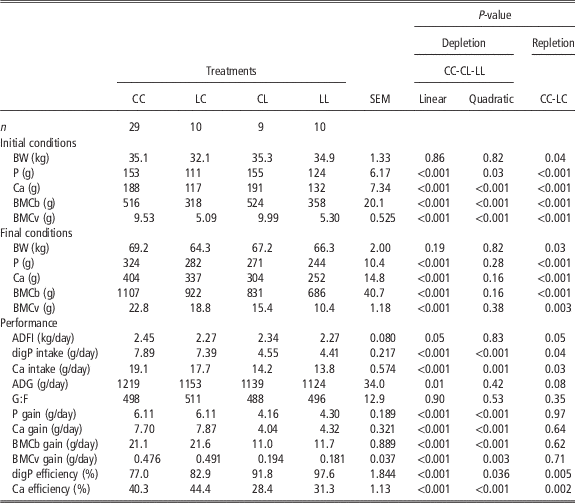
Pigs depleted during the second phase (CL and LL treatments) had no difference in G:F and initial and final BW, and presented a lower ADFI (4% and 7%, respectively; linear: P=0.05; Table 3) and ADG (7% and 8%, respectively; linear: P=0.01) compared with CC pigs, where CL pigs were intermediate. The initial body P and Ca content in LL pigs were lower (linear: P<0.001; quadratic: P=0.03 and linear: P<0.001; quadratic: P<0.001, respectively) than in CC and CL pigs, as were the initial BMCb and BMCv (linear: P<0.001; quadratic: P<0.001). At the end of the phase, LL pigs had lower body P and Ca content and BMCb and BMCv (linear: P<0.001) than CC pigs, whereas CL was intermediate. Reduced gains in body P (31%; linear: P<0.001; quadratic: P<0.001) and Ca (46%; linear: P<0.001; quadratic: P<0.001) content, and BMCb (46%; linear: P<0.001; quadratic: P<0.001) and BMCv (61%; linear: P<0.001; quadratic: P=0.003) were observed in depleted compared with control pigs. Depletion reduced (linear: P<0.001; quadratic: P⩽0.001) digestible P and Ca intake compared with the control diet, and CL and LL pigs had higher body digestible P efficiency (linear: P<0.001; quadratic: P=0.03) but lower Ca efficiency (linear: P<0.001; quadratic: P<0.001) than CC pigs.
Growth performance and bone mineralization in pigs from 35 to 70 kg BW

C=control diet; L=low diet; P=phosphorus; Ca=calcium; BMCb=bone mineral content in total body; BMCv=bone mineral content in lumbar vertebrae L2 to L4; ADFI=average daily feed intake; digP=digestible P; ADG=average daily gain; G:F=gain to feed ratio.
SEM, the highest value was reported; number of pigs=CC: 29, LC: 10, CL: 9, LL: 10.
At the beginning of the phase, repleted pigs (LC treatment) had lower initial BW (9%; P=0.04), P and Ca body, and BMCb and BMCv (P<0.001) than CC pigs. At the end of the phase, final BW (7%; P=0.03), and ADFI (7%; P=0.05) were lower in LC than CC pigs, and a similar tendency was observed for ADG (P=0.08), with no differences in G:F among treatments. A reduction of the final BMCb (17%, P<0.001) and BMCv (18%; P=0.003) was also observed in LC v. CC pigs. No differences among treatments were found in gains of P and Ca body content and BMCb and BMCv. Digestible P and Ca intake were lower (P=0.02 and P=0.03, respectively) in repleted pigs (LC v. CC pigs), and an increase in digestible P (P=0.004) and Ca (P=0.002) retention efficiency was observed in repleted pigs compared with control pigs.
Third growing phase
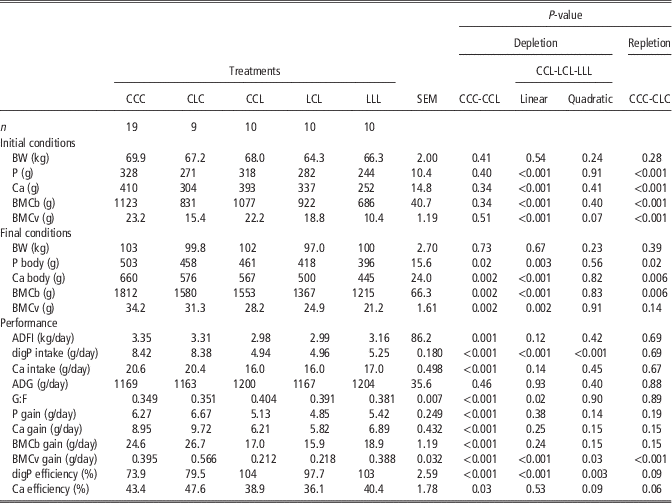
Pigs receiving the L diet in the third growing phase (CCL, LCL and LLL treatments) had no difference in ADFI, ADG and the initial and final BW. CCL animals had a lower (P=0.001; Table 4) ADFI than CCC pigs, and a higher G:F than CCC (P<0.001) and LCL and LLL (linear: P=0.02) pigs. Compared with CCL pigs, LCL and LLL had a lower initial body P and Ca content (linear: P<0.001) and a lower BMCb (linear: P<0.001) and BMCv (linear: P<0.001; quadratic: P=0.07). The final body P (P=0.02) and Ca content, BMCb and BMCv were lower (P=0.002) in CCL than in CCC pigs and were higher (linear: P=0.003; linear: P<0.001; linear: P<0.001; linear: P=0.002, respectively) in CCL than in LCL and LLL pigs. Gains in body P and Ca content, BMCb and BMCv were lower (P<0.001) in CCL than in CCC pigs. Compared with LLL pigs, CCL and LCL pigs had lower BMCv gains (linear: P<0.001; quadratic: P=0.03), and no differences among depleted pigs were found in gains in P and Ca body content and BMCb. Reductions in digestible P and Ca intake (42% and 23%, respectively; P<0.001) were observed in CCL pigs compared with control pigs. The digestible P retention efficiency was higher in CCL than in CCC pigs (104% v. 73.9%; P<0.001) and a linear (P<0.001) and quadratic (P=0.003) contrast showed that LCL had the lowest digestible P efficiency among depleted pigs. For Ca retention efficiency, it was lower in CCL compared with CCC pigs (38.9% v. 43.4%, P=0.03), and CCL and LLL tended to be higher (quadratic: P=0.09) than LCL pigs. Digestible P intake was lower in CCL (P<0.001) than in CCC and a linear (P<0.001) and quadratic (P<0.001) effect showed that LLL consumed more digestible P than CCL and LCL pigs. The intake of Ca was not different among depleted pigs.
Growth performance and bone mineralization in pigs from 70 to 100 kg BW

C=control diet; L=low diet; ADFI=average daily feed intake; ADG=average daily gain; G:F=gain-to-feed ratio; P=phosphorus; Ca=calcium; BMCb=whole-body bone mineral content; BMCv=lumbar vertebrae L2 to L4 bone mineral content; ADFI=average daily feed intake; digP=digestible P.
SEM, the highest value was reported; number of pigs=CCC: 19, CLC: 9, CCL: 10, LCL: 10, LLL: 10.
A repletion period in the third phase (CLC treatments) did not modify growth performance when compared with control pigs. Because of previous depletion, initial body P and Ca content and BMCb and BMCv were lower in CLC compared with CCC pigs at the beginning of the phase (P<0.001). Although the consumption of a repletion diet during 28 days, body P (P=0.02) and Ca content (P=0.006) and BMCb (P=0.006) remained lower at the end of the third phase in CLC than in CCC pigs, whereas BMCv did not differed. Gains in body P and Ca content and BMCb were not different between CLC and CCC pigs, whereas BMCv gain was higher (43%; P<0.001) in CLC than in control pigs. Repletion did not modify digestible P and total Ca intake, and CLC pigs tended to have higher Ca (P=0.06) and digestible P (P=0.09) retention efficiencies than control pigs.
Fourth growing phase
In the fourth phase, no differences in growth performance were found among control (CCCC) and depleted (CCCL, LLLL treatments) pigs. Both CCCC and CCCL pigs presented a higher initial body P and Ca content (linear: P<0.001; quadratic: P<0.001; Table 5) and higher BMCb (linear: P<0.001; quadratic: P<0.001) and BMCv (linear: P<0.001; quadratic: P=0.001) than LLLL pigs. At the end of the phase, depleted animals had a lower (linear: P<0.001) body P content and BMCv compared with control pigs, and body Ca content and BMCb were higher (linear: P<0.001;quadratic: P=0.04) in control and CCCL than in LLLL pigs. Gains in body P and Ca content, BMCb and BMCv were lower (21%, 29%, 29% and 37%, respectively; quadratic: P⩽0.001) in CCCL than in CCCC and LLLL pigs. Digestible P and total Ca intake were lower (linear: P<0.001; quadratic: P=0.001) in depleted than in control pigs, digestible P retention efficiency was higher (linear: P<0.001) in CCCL and LLLL pigs, and Ca retention efficiency was lower (linear: P=0.05; quadratic: P<0.001) in CCCL than CCCC and LLLL pigs.
Growth performance and bone mineralization in pigs from 100 to 130 kg BW

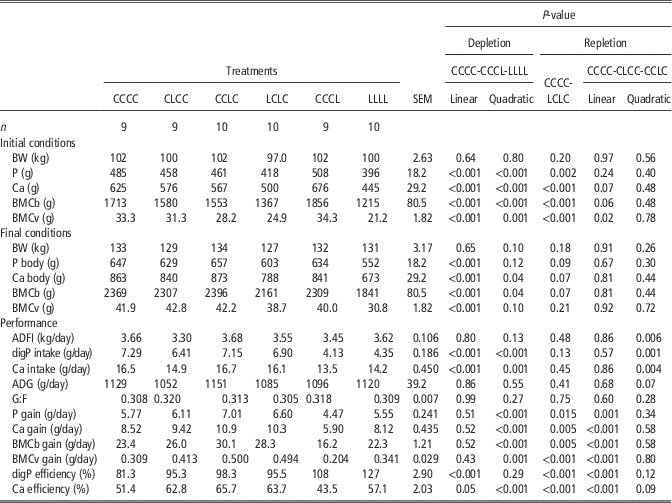
C=control diet; L=low diet; P=phosphorus; Ca=calcium; BMCb=whole-body bone mineral content; BMCv=lumbar vertebrae L2 to L4 bone mineral content; ADFI=average daily feed intake; digP=digestible P; ADG=average daily gain; G:F=gain-to-feed ratio.
SEM, the highest value was reported; number of pigs: CCCC: 9=CLCC: 9, CCLC: 10, LCLC: 10, CCCL: 9, LLLL: 1.
Animals depleted for two phases (LCLC treatment) did not present differences in the initial and final BW, ADFI, digestible P and total Ca intake, ADG and G:F compared with CCCC pigs. Initial body P (P=0.002) and Ca content and BMCb and BMCv were lower (P<0.001) due to the previous depletion. At the end of the phase, body P and Ca content as well as BMCb tended to be lower (P⩽0.09) than CCCC pigs, whereas BMCv was similar between treatments. Daily gains of body P (P=0.02) and Ca (P=0.005) and BMCb (P=0.005) and BMCv (P<0.001) were higher in LCLC than CCCC pigs. Digestible P and Ca efficiencies were higher in LCLC than CCCC pigs (95.5% v. 81.3% and 63.7% v. 51.4%, respectively; P<0.001).
Animals depleted for one phase and fed the control diet in phase 4 (CLCC, CCLC) had no difference in initial and final BW and P body content and G:F, but CLCC pigs had a lower ADFI and digestible P and total Ca intake (quadratic: P<0.01) and tended to have a lower ADG (quadratic: P=0.07) than control and CCLC pigs. At the beginning of the phase, Ca content and BMCb tended to be lower (linear: P=0.07) and BMCv was lower (linear: P=0.03) in CLCC and CCLC compared with control pigs, and no differences were found among CCCC, CLCC and CCLC pigs. Compared with control pigs, CLCC and CCLC pigs had higher gains in body P content (linear: P<0.01) and Ca content, BMCb and BMCv (linear: P<0.001). Retention efficiencies of digestible P (linear: P<0.001) and Ca (linear: P<0.001 and quadratic: P=0.09) were lower in CCCC than CLCC and CCLC pigs.
Discussion
Impact of calcium and phosphorus depletion
Dietary P and Ca are bound together in bones, with a constant Ca/P ratio of 2.2 : 1, and the skeleton constitutes more than 95% of body Ca and 70% of body P reserves (Crenshaw, Reference Crenshaw2001). The rest of the P is deposited in soft tissues (Nielsen, Reference Nielsen1973), which have priority over P deposition in bones (Brautbar et al., Reference Brautbar, Lee, Coburn and Kleeman1979). For this reason, reducing dietary P and Ca levels reduces whole-body mineralization; however, different responses are observed in pig’s growth performance. In fact, in phase 1, only ADG was measured, and the reduction observed in depleted pigs was probably the result of the reduction of ADFI caused by the P deficiency. In phase 2, there was a reduction of ADFI and ADG that was proportional to the length of depletion with no effect on G:F. In phase 3, the reduction in ADFI in depleted pigs had no effect on ADG. In phase 4, no differences in growth performance (BW, ADFI, ADG, G:F) were found between depleted and control pigs. Phosphorus-deficient diets frequently reduce feed intake and growth (e.g. Ekpe et al., Reference Ekpe, Zijlstra and Patience2002; Létourneau-Montminy et al., Reference Létourneau-Montminy, Jondreville, Sauvant and Narcy2012), but in some studies (e.g. Dritz et al., Reference Dritz, Tokach, Sargeant, Goodband and Nelssen2000; Alexander et al., Reference Alexander, Qu, Cutler, Mahajan, Lonergan, Rothschild, Weber, Kerr and Stahl2008) of acute and long-term mineral deprivation, dietary P did not modify growth performance. According to the present study, digestible P deficiency affects ADFI and then ADG more significantly in younger pigs. Létourneau-Montminy et al. (Reference Létourneau-Montminy, Lovatto and Pomar2014) showed that younger animals were more sensitive to mineral depletion than older pigs, possibly due to lower body mineral reserves in the first ones, which is consistent with the findings of the present study. Younger pigs can be also more affected by depletion considering a reduced response to vitamin D regulation pathways with aging (Xu et al., Reference Xu, Bai, Collins and Ghishan2002).
Growing pigs have an acute requirement for dietary Ca and P to support skeletal development. It is thus not surprising to find bone demineralization of about 25% at the end of a depletion phase in both the overall skeleton and vertebrae L2 to L4, which BMC decreases when growing phase increases. In terms of gains in body P and Ca, a reduction was observed in depleted pigs in all feeding phases, except during the last one, in which LLLL pigs did not present differences in the deposition of Ca and P compared with CCCC pigs. This may be the result of a greater efficiency at depositing those minerals; digestible P efficiency was increased by 56% and Ca by 11% compared with control pigs. A greater efficiency in dietary Ca retention (>25%) was observed by Aiyangar et al. (Reference Aiyangar, Au, Crenshaw and Ploeg2010) in 10 kg BW pigs that received a Ca-depleted diet (70% requirement for 6 weeks) compared with non-depleted pigs, and by Gutzwiller et al. (Reference Gutzwiller, Hess, Adam, Guggisberg, Liesegang and Stoll2011), who observed a 40% higher Ca retention efficiency in 25 to 50 kg BW pigs receiving a diet with a 32% Ca deficiency. Varley et al. (Reference Varley, Sweeney, Ryan and O’Doherty2011) also observed a 14% higher total P efficiency in 10 to 100 kg BW pigs receiving 45% of the P requirement. This is probably the result of the establishment of new digestion and metabolic regulation processes that allowed the pigs to increase intestinal absorption, renal reabsorption and retention efficiencies of Ca and P, as previously observed (Schröder et al., Reference Schröder, Breves and Rodehutscord1996; Saddoris et al., Reference Saddoris, Fleet and Radcliffe2010; Létourneau-Montminy et al., Reference Létourneau-Montminy, Lovatto and Pomar2014). Moreover, an oversupply of Ca in L diet was observed; considering analyzed values, a ratio of 3.1 Ca/digestible P was found on average for LLLL compared with 2.5 for CCCC. Therefore, due to this imbalance between dietary Ca and P, the deficiency of P was probably aggravated that contributed to increase digestible P and Ca efficiencies in LLLL allowing them to present similar Ca and P gains than CCCC pigs. It is worth noting that digestible P efficiency in pig fed L diet in phases 2 to 4 was close or higher than 100%, indicating that P digestibility was higher than assumed in feed tables (e.g. Sauvant et al., Reference Sauvant, Perez and Tran2004). This result again confirms an increased digestive P utilization in L compared with C fed pigs in phases 2 to 4 of the present study and that P was the most limiting mineral implicating therefore vitamin D regulations (Crenshaw, Reference Crenshaw2001).
In addition, bone demineralization was more marked in vertebrae than in the overall skeleton, with an average deficit for the whole body of 23% and 30% in lumbar vertebrae in depleted pigs compared with control pigs. A negative value in BMCv gain was even found in pigs fed a first-phase-L diet, probably due to the low bone reserves of these young pigs. The vertebra is composed of cortical and trabecular bone tissue in a ratio of 25 : 75, in comparison with long bones, such as the femur, which has a 50 : 50 ratio (Clarke, Reference Clarke2008). Trabecular bone is known to be typically more metabolically active than cortical bone tissue and contributes more significantly to mineral homeostasis and metabolism (Bullock et al., Reference Bullock, Boyle and Wang2001). In addition, the surface-to-volume ratio of trabecular bone tissue is 10 times higher than that of cortical bone tissue which make the first tissue to decrease sooner in mineral deficiency conditions (Kim and Park, Reference Kim and Park2013). In agreement with the results of the present study, Schanler et al. (Reference Schanler, Abrams and Sheng1991) also observed greater changes in the vertebrae of neonatal piglets deficient in P and Ca than in their tibia or cranium, the latter two bones being principally composed of cortical bone tissue.
Impact of calcium and phosphorus repletion
The repletion period allowed the negative impact of the precedent depletion on growth performance to be rectified from the third period, with no differences between CLC and CCC pigs, except for ADFI at the end of the experiment, for which a quadratic effect among CCCC, CLCC and CCLC was found. A dietary P restriction reduces phosphatemia, which results in the activation of regulatory mechanisms that increase intestinal absorption, renal reabsorption and bone resorption in order to increase P blood concentration (Schröder et al., Reference Schröder, Breves and Rodehutscord1996; Suttle, Reference Suttle2010). This is corroborated in the present study, where repleted pigs presented higher gains of BMCb and BMCv, and body Ca and P in the fourth phase (20%, 52%, 20% and 14%, respectively) due to better total Ca and digestible P retention efficiencies (25% and 19%, respectively). In consequence, both CCLC and CLCC pigs did not differ from CCCC pigs at the end of the experiment in terms of BMCb and BMCv, and this was even true for LCLC pigs for BMCv. With growing pigs receiving the L70 diet (70% of P and Ca requirements) or H150 diet (150% of P and Ca requirements) for 4 weeks followed by a 6-week growing phase (constituting H150 to H150, L70 to H150, H150 to L70 or L70 to L70 diets), Aiyangar et al. (Reference Aiyangar, Au, Crenshaw and Ploeg2010) obtained similar femur volume and mass but also a reduced femoral mineral density and whole-body BMC in L70 to H150 compared with H150 to H150 pigs. Ryan et al. (Reference Ryan, Lynch and O’Doherty2011) found no mineral differences in metacarpal bones but did not find mineralization recovery of total body and spine in pigs from 35 to 100 kg BW fed a LH diet (64% during 35 days gain followed by 92% digestible P requirements until slaughter) compared with HH diet (112% during 35 days followed by 92% digestible P requirements until slaughter). Lastly, in a similar experiment with three growing phases beginning at 25 kg BW, where depleted pigs received 60% Ca and digestible P requirements, Létourneau-Montminy et al. (Reference Létourneau-Montminy, Lovatto and Pomar2014) observed a recovery in BMCv in LCC and LLC pigs. It therefore appears likely that the bone region and repletion intensity and duration influenced the extent of the mineral recovery in all the phases of the present study.
According to the results of this study, CLCC and CCLC pigs, respectively, had 11% and 29% higher BMCb gain, 6% and 22% higher body P content gain, 11% and 28% higher body Ca content gain, 17% and 21% higher dietary digestible P retention efficiency, and 22% and 28% higher Ca retention efficiency compared with CCCC pigs. Therefore, mineral retention efficiency remained higher during repletion, as observed by Aiyangar et al. (Reference Aiyangar, Au, Crenshaw and Ploeg2010) (25%) or Létourneau-Montminy et al. (Reference Létourneau-Montminy, Lovatto and Pomar2014) (9%).
In conclusion, the objective of this study was to better understand the consequences of mineral depletion and repletion diets on growing-finishing pigs as a possible strategy for increasing dietary P and Ca utilization and reducing mineral excretion and feeding costs. Results indicate that a P–Ca depletion reduces BMC mass and gain but might increase dietary digestible P efficiency. A subsequent P–Ca repletion might also increase digestible P efficiency which might recover BMC at the end of the growing period as a result of a physiological readjustment to cope with P and Ca deficiency. In addition, a P and Ca depletion–repletion does not affect similarly all skeletal bones. More concretely, in the present study vertebrae were more affected by depletion–repletion probably due to its higher proportion of metabolically active trabecular bone. The consequences of a P and Ca depletion–repletion on growth performance is unclear and inconsistent in the literature, however dietary treatments did not affect overall growth in the present study. Moreover, the CCLC treatment can be seen as a potential alternative for improving the sustainability of pig production systems given that allowed the reduction of 13% of Ca and 34% of digestible P intake without affecting final body weight or total body mineral content. However, further research is required to better understand the underlying mechanisms to precisely adjust the age of the animals and the duration and degree of depletion in order to optimize P and Ca utilization by growing-finishing pigs, whereas minimizing the duration of the deleterious effect on bone mineralization and growth performance.
Acknowledgments
The authors thank Aliment Breton, which provided the diets and pigs, and Swine Innovation, which supported the study. CP and MPLM designed the research; Normande Ouellet, Sophie Horth and EG conducted the study with the help of the employees of the Agriculture and Agri-Food Canada swine complex; EG and MPLM analyzed the data; EG, MPLM and CP wrote the paper, and MPLM and CP had primary responsibility for the final content. All authors read and approved the final manuscript.