Implications
The findings aid in understanding the function of fatty acid transporters and provide some novel candidate markers for breeding or nutrition regulation, which could be used to improve meat quality.
Introduction
Recently, consumers have become increasingly concerned about the nutritional quality of meat (Scollan et al., Reference Scollan, Dhanoa, Choi, Maeng, Enser and Wood2001). The optimum intramuscular fat content and the fatty acid (FA) composition of muscle greatly contribute to certain aspects of meat quality, such as marbling, juiciness and flavor (Chizzolini et al., Reference Chizzolini, Zanardi, Dorigoni and Ghidini1999; Cameron et al., Reference Cameron, Enser, Nute, Whittington, Penman, Fisken, Perry and Wood2000). For example, polyunsaturated FAs (PUFA) have been reported to decrease the plasma cholesterol, whereas saturated FA (SFA) seem to increase it, which may be related to the potential health risks of obesity and other metabolic disturbance (Monteiro et al., Reference Monteiro, Santos-Silva, Bessa, Navas and Lemos2006; De Luis et al., Reference De Luis, Conde, Aller, Izaola, Sagrado, Castrillon, Duenas and Romero2009; Heinen et al., Reference Heinen, Verhage, Goldbohm and van den Brandt2009). Therefore, the regulation of FA composition has been a research focus of improving meat quality.
It has been reported that the FA composition of chicken varies among breeds and anatomical location, primarily because of the interaction of heredity and myofiber type (Shu et al., Reference Shu, Lin, Wu and Ouyang2001; Cortinas et al., Reference Cortinas, Villaverde, Galobart, Baucells, Codony and Barroeta2004). In avian models, the liver, but not adipose tissues, is the main site of de novo FA synthesis (Griffin et al., Reference Griffin, Guo, Windsor and Butterwith1992). Therefore, FAs are obtained chiefly from the intestine and liver in the form of chylomicrons and very-low-density lipoproteins, respectively (Mossab et al., Reference Mossab, Lessire, Guillaumin, Kouba, Mourot, Peiniau and Hermier2002). The free FAs are released by lipoprotein lipase and then transported by several membrane proteins, such as FA transport protein-1 (FATP-1), membrane FA-binding protein (mFABP), FA translocase (FAT/CD36) and caveolin-1 (Berk et al., Reference Berk, Wada, Horio, Potter, Sorrentino, Zhou, Isola, Stump, Kiang and Thung1990; Trigatti et al., Reference Trigatti, Mangroo and Gerber1991; Harmon and Abumrad, Reference Harmon and Abumrad1993; Schaffer and Lodish, Reference Schaffer and Lodish1994). In the context of such a multiprotein-mediated process, whether these transporters selectively transport various FA across the cell membrane remains to be determined. Certain reports have demonstrated that mice exhibited a spontaneous preference for linoleic acid (LA), but FAT/CD36-null mice did not exhibit such a preference (Laugerette et al., Reference Laugerette, Passilly-Degrace, Patris, Niot, Febbraio, Montmayeur and Besnard2005). The incorporation of arachidonic acid (AA) in brain decreased if FABP was ablated (Murphy et al., Reference Murphy, Owada, Kitanaka, Kondo and Glatz2005). These clues suggest the preferences of FA transporters, but direct evidence is lacking.
To investigate the correlation of FA profile and FATP function, gas chromatography–mass spectrometry and Q-PCR were used to analyze the FA composition and the expression of FA transporters (FATP-1, mFABP, FAT/CD36 and caveolin-1) in two anatomical locations (m. biceps femoris and m. ipsilateral pectoralis) of Avian farm broiler breeder and local Silky fowl breeder. Overexpressing cell models were then used to confirm the FA preference of the transporter by dynamic absorption detection at the cellular level.
Material and methods
The animals in the experiments were reared and slaughtered with the approval of the College of Animal Science, South China Agricultural University; the experiments were also conducted in accordance with ‘the instructive notions with respect to caring for laboratory animals’ issued by the Ministry of Science and Technology of the People's Republic of China. Chinese hamster ovary (CHO) cell line was donated from Ming Liao (College of Veterinary Medicine, South China Agricultural University, Guangzhou 510640, P.R. China).
Animals and sampling
Ten 100-day-old Avian farm broiler breeder (♂) and local Silky fowl breeder (♂), raised in the same standard conditions and fed ad libitum with identical diets were selected at random from among the population at Wen's Group Breeding Farms. According to Chinese animal welfare rules, the animals were slaughtered to excise the m. biceps femoris and m. ipsilateral pectoralis and then frozen in liquid nitrogen and stored at −80°C for subsequent use.
FA composition of muscle samples and of CHO cells
The total FA content of each sample was extracted (Cortinas et al., Reference Cortinas, Villaverde, Galobart, Baucells, Codony and Barroeta2004) and methyl-esterified (Morrison and Smith, Reference Morrison and Smith1964); the FA composition was detected by GC–MS (Trace DSQ, Thermo, CA, USA) using a fused silica capillary column DB5 (30 m × 0.25 mm). The temperature was initially set at 50°C for 3 min and then increased up to 180°C at a rate of 10°C/min; after 20 min, the temperature was increased to 250°C and maintained for 2 min. The injected volume was 1 μl, and the flow rate of helium was 30 : 1.
mRNA expression of FA transporters
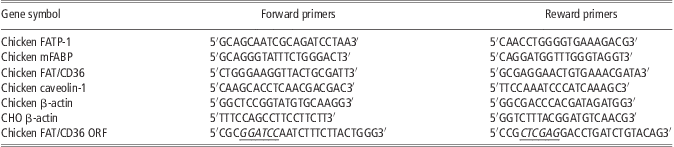
The total RNA of each sample was extracted with TRIZOL Reagent (Saibaisheng, Beijing, China). Quality and quantity of RNA was estimated using the ratio of absorbance at 260 to 280 nm. Next, 2 μg of RNA were DNase treated (Promega, Madison, WI, USA) and reverse-transcribed using random primers (Invitrogen, Carlsbad, Guangzhou, China) and Moloney murine leukemia virus reverse transcriptase (Promega) according the manufacturer's protocol. A total of 1 μL of cDNA was used in a 20 μL PCR. The real-time PCR was performed with an ABI 7500 Sequence Detection System (Applied Biosystems, CA, USA) using a two-step PCR procedure with the following protocol. Temperature was held at 95°C for 1 min. Forty PCR cycles of 95°C (15 s), 58°C (15 s) and 72°C (40 s) were completed, followed by melt curve analysis to confirm a single PCR product repeated twice each reaction. Fragments (75 to 150 bp) of the target genes (including FATP-1, mFABP, FAT/CD36, caveolin-1 and β-actin) were cloned and inserted into pMD18-T simple vectors as standard plasmids. Table 1 presents the forward and reverse primers for the tested genes and for the internal reference gene (β-actin; Yun et al., Reference Yun, Seo, Kim and Ko2005). Q-PCR (SYBR Green Kit, TOYOBO, Osaka, Japan) technology was employed to detect the mRNA expression level. The mRNA expression levels of the target genes were normalized by that of β-actin according to the 2−Δct method.
Primer sequences used in Q-PCR and gene cloningFootnote *
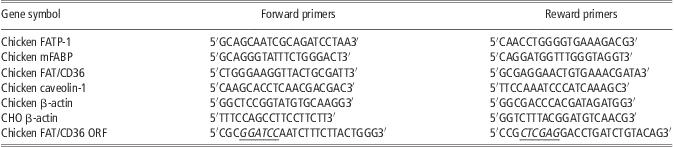
FATP-1 = fatty acid transport protein-1; mFABP = membrane fatty acid-binding protein; FAT = fatty acid translocase; CHO = Chinese hamster ovary; ORF = open reading frame.
* Underlined sequence indicated site of BamHI and XhoI.
Cell culture
Chinese hamster ovary (CHO) cells were grown in 1640 (Hyclone, Logan, UT, USA) medium supplemented with 10% fetal bovine serum (GIBCO, Grand Island, NY, USA), 2 mM glutamine, 10 μg/ml streptomycin and 10 units/ml penicillin in a 5% CO2/95% air atmosphere at 37°C.
Stable transfection of chicken FAT/CD36 in CHO cells
To determine the FA transport preference of chicken FAT/CD36 at the cellular level, a stable chicken FAT/CD36 overexpressing CHO cell line was created. The sequence of the chicken FAT/CD36 open reading frame (ORF) was cloned by Ex Taq (Takara Bio Inc., Shiga, Japan) and then inserted into pcDNA3.1 (+) via BamHI and XhoI restriction enzyme sites. After sequencing, the recombinant plasmid was extracted by Endo-free Plasmid Kit (MN, Germany) and transfected into CHO cells with the Polyfect Kit (Qiagen, Hilden, Germany). After a 10-day selection with 1250 mg/l G418 and serial dilutions, the monoclonal strain was obtained and cultured in 24-well plates with 1640 including 10% fetal bovine serum for cellular uptake tests. The pcDNA3.1 (+)-transfected CHO cells were used as a control.
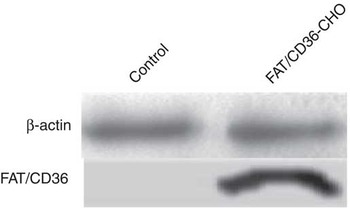
Q-PCR (for primers, see Table 1) and western blot were employed to confirm the stable transfection of chicken FAT/CD36. For use in western blot, the FAT/CD36 (sc-9154) antibody was purchased from Santa Cruz Biotechnology, Santa Cruz, CA, USA. The internal reference, β-actin (bs-0061), was provided by Biosynthesis, Beijing, China.
FA uptake
The FA transport preference of chicken FAT/CD36 was evaluated using the chicken FAT/CD36-CHO cell model. For this purpose, various FAs (palmitic acid (PA), stearic acid (SA), oleic acid (OA), LA and AA, Sigma, St. Louis, MO, USA) were combined and added to the cellular experiments, as follows. After washing twice with 1640, the chicken FAT/CD36-CHO cells and the pcDNA3.1 (+)-transfected CHO cell controls were treated with 0.5 ml serum-free medium (GIBCO) containing mixed FA (at a final concentration of 0.5 mM PA, SA, OA, LA and AA, respectively) and 2.5 mM bovine serum albumin (Gao and Serrero, Reference Gao and Serrero1999; Eyre et al., Reference Eyre, Cleland, Tandon and Mayrhofer2007; Lobo et al., Reference Lobo, Wiczer and Bernlohr2009; Sigma, USA) for 15, 30 and 60 min, respectively, with six replicates for each treatment. The supernatant was collected to detect FA composition by GC–MS. FA methyl esters were identified by comparing retention times with external standard, methylated pentadecanoic acid (C15:0). The chromatographic peak area of various FAs was counted and converted into absolute content of them. The decrease of FA in supernatant was considered as the molar weight of FA uptake. Then, the uptake of total FAs in each treatment was normalized by the quantity of total cell protein as ‘mol/g cell protein’ (Bruce et al., Reference Wong, Kyle, Croft, Quinn, Jessup and Yeap2011). The uptake of each FA was compared with its proportion in total FAs.
Statistical analysis
The data were described as X ± s.e. and analyzed statistically with SPSS 17.0 software by univariate Student–Newman–Keuls comparison. The significance level was considered at P < 0.05. The Spearman method was used to assess the significance of correlation between FA composition and membrane transporters, with significance levels at P < 0.01 and P < 0.05.
Results
Correlation between FA composition and respective membrane transporter expression
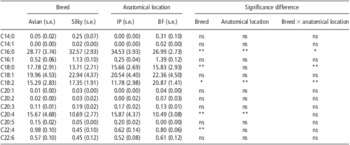
The FA composition of muscle samples is presented in Table 2. Together, PA (C16:0), SA (C18:0), OA (C18:1), LA (C18:2) and AA (C20:4) represented more than 96% of the total long-chain FAs (LCFA) in chicken. Compared with Avian farm broiler breeder chickens, local Silky fowl breeder had significantly higher (P < 0.05) proportions of LA (C18:2) and PA (C16:0) but much lower (P < 0.05) proportions of SA (C18:0) and AA (C20:4). With regard to the anatomical locations, myristic acid (C14:0), myristoleic acid (C14:1) and eicosenoic acid (C20:1 and C20:2) were specifically detected in m. biceps femoris, whereas eicosapentaenoic acid (C20:5) was found only in pectoralis. Of the five major FAs of chicken, LA (C18:2) represented a greater (P < 0.05) proportion of the total LCFA in the m. biceps femoris than in the m. ipsilateral pectoralis, whereas PA (C16:0) and AA (C20:4) followed the opposite trend (P < 0.01).
FA composition in muscle samples

FA = fatty acid; IP = m. ipsilateral pectoralis; BF = m. biceps femoris; GC–MS = gas chromatography–mass spectrometry.
100-day-old Avian farm broiler breeder (♂) and local Silky fowl breeder (♂) were slaughtered to excise the BF and IP. The total FA content was detected by GC–MS (n = 10).
Data are presented as mean (s.e.) for breed and anatomical location. s.e. is standard error of difference between means.
ns = no significant difference (P > 0.05); *P < 0.05, **P < 0.01.
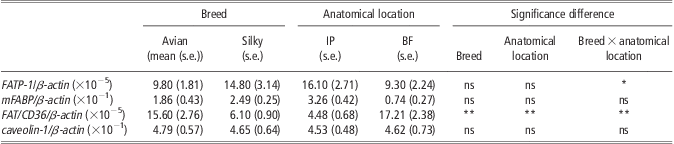
FATP-1, mFABP, FAT/CD36 and caveolin-1 mRNA were all observed to be abundantly expressed in skeletal muscles from both anatomical locations of Avian farm broiler breeder chickens and local Silky fowl breeder. Among these four FA transporters, only FAT/CD36 showed significant differences (P = 0.007) in expression (Table 3), whereas the other three genes exhibited no significant difference (P > 0.05) with regard to either breed or anatomical location.
mRNA abundance of transporters in muscle samples
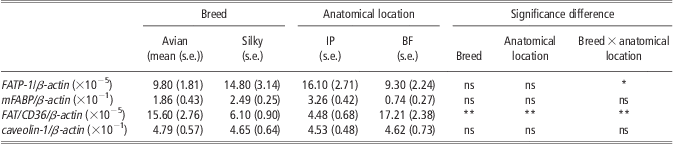
IP = m. ipsilateral pectoralis; BF = m. biceps femoris; FATP = fatty acid-binding protein; mFABP = membrane fatty acid-binding protein; FAT = fatty acid translocase.
The total RNA of BF and IP samples was extracted with TRIZOL Reagent for quantitative PCR. The mRNA expression levels of the target genes were normalized by that of β-actin according to the 2−Δct method (n = 10).
Data are presented as mean (s.e.) for breed and anatomical location. s.e. is strandard errror of difference between means.
ns = no significant difference (P >0.05); *P < 0.05, **P < 0.01.
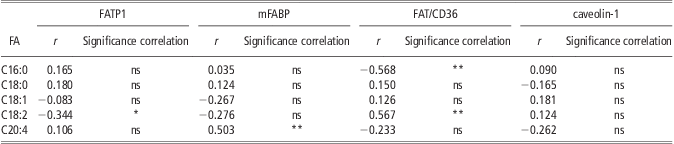
The correlation analysis revealed that there was a positive significant correlation (P < 0.01) between FAT/CD36 and LA (C18:2), whereas a negative correlation (P < 0.01) between FAT/CD36 and PA (C16:0; Table 4).
The correlations of FA composition and membrane transporters were analyzed with Spearman correlation coefficient
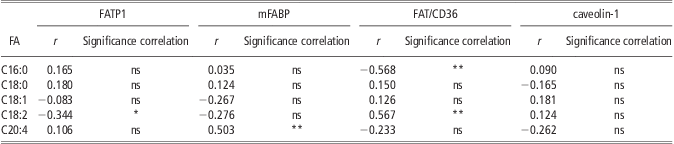
FA = fatty acid; FATP = FA-binding protein; mFABP = membrane FA-binding protein; FAT = FA translocase.
Correlation coefficient with P < 0.05 are significant.
ns = no significant difference (P > 0.05); *P < 0.05, **P < 0.01.
Construction and validation of the chicken FAT/CD36-CHO cell model
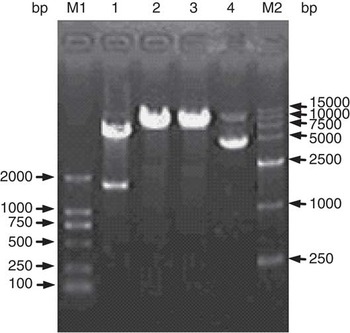
As shown in Figure 1, 1460 bp chicken FAT/CD36 ORF was cloned and the FAT/CD36-pcDNA3.1 (+) was further constructed. As shown in Figure 2, the monoclonal CHO strain transfected with FAT/CD36-pcDNA3.1 (+) was confirmed by western blot. The results showed that FAT/CD36 protein was highly expressed in FAT/CD36-pcDNA3.1 (+)-transfected CHO cells, whereas were not detected in pcDNA3.1 (+) negative control cells.
The identification of chicken FAT/CD36-pcDNA3.1 (+). M1: DL2000 molecular weight marker; Lanes 1, 2 and 3: chicken FAT/CD36-pcDNA3.1 (+) digested by BamHI and XhoI, BamHI, XhoI, respectively; Lane 4: chicken FAT/CD36-pcDNA3.1 (+); M2:D15000 molecular weight marker.

The expression of chicken FAT/CD36 protein in chicken FAT/CD36-CHO.

FA uptake of the chicken FAT/CD36-CHO cell model
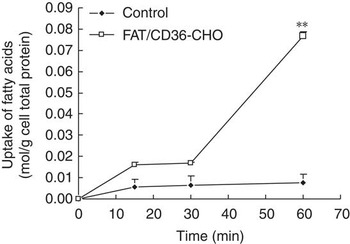
As shown in Figure 3, the uptake of FA in the control group increased slowly as the duration of treatment increased. In contrast, the chicken FAT/CD36-CHO cell model demonstrated enhanced FA uptake throughout the experiment, especially at the 60th min, when the FA uptake was dramatically increased (P < 0.01). The amount of total FA uptake in the FAT/CD36-CHO cell model was nearly 10 times greater than that of the control.
The cellular uptake of fatty acids in chicken FAT/CD36-CHO. The chicken FAT/CD36-CHO cells and the pcDNA3.1 (+)-transfected CHO cell controls were treated with 0.5 ml serum-free medium containing mixed FA (0.5 mM PA, SA, OA, LA and AA, respectively) and 2.5 mM bovine serum albumin for 15, 30 and 60 min, respectively. The supernatant was collected to detect FA composition by GC–MS with external standard. The uptake of FA was considered as the decrease of FA content in supernatant at each time, which was presented as the difference between the original FA content and that in each in supernatant at each examined time point. The FA uptake amount was also normalized by the quantity of total cell protein as ‘mol/g cell protein’. Data represented mean ± s.e. (n = 6). **Represented the significant differences of uptake of fatty acids between FAT/CD36-CHO and control at the same time point. **P < 0.01.

As shown in Figure 4, the proportion of palmitic acid (C16:0) was higher than SA (C18:0), OA (C18:1), LA (C18:2) and AA (C20:4) in the total cellular uptake of FAs. Compared with pcDNA3.1-CHO control, FAT/CD36-CHO took up a higher proportion of LA (C18:2) and lower proportion of PA (C16:0) both in 30 min (P < 0.05) and 60 min (P < 0.01). In addition, the uptake of AA (C20:4) in FAT/CD36-CHO was also significantly greater (P < 0.01) than that in pcDNA 3.1-CHO control in 60 min. With regard to the uptake of SA (C18:0) and OA (C18:1), no significant difference was observed (P > 0.05).
The proportion of palmitic acid (C16:0), stearic acid (C18:0), oleic acid (C18:1), linoleic acid (C18:2) and arachidonic acid (C20:4) in the total cellular uptake of fatty acids (n = 6). The chicken FAT/CD36-CHO cells and the pcDNA3.1 (+)-transfected CHO cell controls were treated with 0.5 ml serum-free medium containing mixed FA (0.5 mM PA, SA, OA, LA and AA, respectively) and 2.5 mM bovine serum albumin for 15, 30 and 60 min, respectively. The uptake of each FA was compared with its proportion in total FAs (n = 6). □, pcDNA3.1 (+) control, ▪ FAT/CD36-CHO. **P < 0.01, *P < 0.05.

Discussion
Normally, the FA composition was determined by several factors including species, age and nutrition. To analyze the relationship between transcriptome and some commercial traits, the broiler breeder of chicken was generally adopted to maintain the consistency of specific genetic background (Lyon et al., Reference Lyon, Lyon and Savage2003; Trindade et al., Reference Trindade, Felício and Castillo2004). In this paper, we also used the broiler breeder of Avian farm and Silky fowls. With regard to the age at the first egg and the growth curve, the physiological age of the broiler breeder of Avian farm and Silky fowls does not have much differences. Therefore, we selected the birds at 100 days of age to compare their FA composition and gene expression level, which was similar to other publications (Li et al., Reference Li, Wen, Chen, Zhao and Zheng2003). FA composition results demonstrated that PA, OA, LA, AA and SA were consistently observed to be the major components of muscles, consistent with the regularity and stability of FA composition in chicken. However, different FAs varied in terms of the relative proportion between anatomical locations and breeds. In this experiment, OA and LA were observed in a higher proportion in Silky fowl breeder than in Avian farm broiler breeder chickens; however, Silky fowl breeder had less SA than Avian farm broiler breeder chickens, which was consistent with the consensus that local breeds are superior to fast-growing chickens in terms of meat quality (Shu et al., Reference Shu, Lin, Wu and Ouyang2001; Wang et al., Reference Wang, Liu and Li2004). Compared with the m. ipsilateral pectoralis, the m. biceps femoris had significantly less PA and more LA proportion. The FA composition in muscles had been reported to be associated with myofiber type. Here, the main type of muscle fiber in m. biceps femoris was different from that in m. ipsilateral pectoralis (Belichenko et al., Reference Belichenko, Korostishevskaya, Maximov and Shoshenko2004). The presence of fast-twitch glycolytic fibers, rich in chicken m. ipsilateral pectoralis, was positively correlated with SFAs such as PA and SA, whereas slow-twitch oxidative fibers abundant in chicken m. biceps femoris were positively correlated with unsaturated FAs (Fiedler et al., Reference Fiedler, Nurnberg, Hardge, Nurnberg and Ender2003).
Caveolin-1, FATP-1 and mFABP mRNA expression levels between breeds and anatomical locations were not different. In particular, the level of caveolin-1 was nearly the same in both breeds and anatomical locations. It was not difficult to understand these observations given that caveolin-1 is a kind of scaffold protein with the highest expression level among these transport proteins. Caveolin-1 also had no correlation with any FA. The transport preference of mFABP for AA is shown by the finding that mFABP mRNA was highly expressed in the brain and correlated with the concentration of AA, which has an important physiological function in brain development (Murphy et al., Reference Murphy, Owada, Kitanaka, Kondo and Glatz2005; Motohashi et al., Reference Motohashi, Yamamoto, Shioda, Kondo, Owada and Fukunaga2009). This opinion was also supported by our results that mFABP had a positive correlation with AA. We also found that FAT/CD36 demonstrated differences between breeds and anatomical locations. Its mRNA expression level was higher in the m. biceps femoris than in the m. ipsilateral pectoralis, which was in accordance with recent reports (Marotta et al., Reference Marotta, Ferrer-Martinez, Parnau, Turini, Mace and Foix2004; Feng et al., Reference Feng, Song, Shu, Zhu, Jiang, Gao, Xu, Wang and Feng2007). Interestingly, FAT/CD36 was found to positively correlate with the LA content but negatively correlate with PA content, which is significant for its effect on meat quality. However, if we separately contrasted the relationship between FAT/CD36 mRNA expression and LA content in different species, the result may well be different. The differences may be caused by the following two reasons. First, many publications had reported the translocation of FAT/CD36 both to the plasma membrane for transport of FAs and to the mitochondria for increasing FA oxidation (Koonen et al., Reference Koonen, Glatz, Bonen and Luiken2005; Bezaire et al., Reference Bezaire, Bruce, Heigenhauser, Tandon, Glata, Luiken, Bonen and Spriet2006). For example, exercise induces the translocation of FAT/CD36 to mitochondria, thus increasing muscle FA oxidation (Campbell et al., Reference Campbell, Tandon, Woldegiorgis, Luiken, Glatz and Bonen2004). Furthermore, FAT/CD36 co-immunoprecipitated with carnitine palmitoyltransferase 1 (CPT1) in cells, and its overexpression increased mitochondrial FA oxidation efficiency, showing an additive effect when co-overexpressed with CPT1 (Campbell et al., Reference Campbell, Tandon, Woldegiorgis, Luiken, Glatz and Bonen2004). Second, mitochondria show the highest oxidation rates with C12:0-C16:0 and with C18:2 (Alexson and Cannon, Reference Alexson and Cannon1984). Thus, in summary, FAT/CD36 expression in a certain range could increase transport of LA into cells. However, it may also promote β-oxidation when FAT/CD36 expression levels are significantly higher.
By using the overexpressing CHO model, it was demonstrated that FAT/CD36 did enhance cellular FA uptake. Among the five major FAs, PA represented a greater proportion than SA, OA, LA and AA both in the FA composition of chicken and in the cellular uptake experiment, suggesting that PA itself traverses the cell barrier more easily than the other four FAs. Interestingly, in the uptake experiment, PA represented a lower proportion of total FA uptake in FAT/CD36-CHO than in the control, whereas LA represented a greater proportion in FAT/CD36-CHO, with a significant difference at both 30 and 60 min. On the basis of equimolar FA within physiological range, FAT/CD36-CHO revealed a preference for LA over PA relative to the control group. We speculated that the preference of FAT/CD36 might be due to anatomical differences. First, the recognition of FA by FAT/CD36 might have structure differences. FAT/CD36 was found abundantly at the apical region of the taste cell (Fukuwatari et al., Reference Fukuwatari, Shibata, Iguchi, Saeki, Iwata, Tani, Sugimoto and Fushiki2003), and as a transmembrane glycoprotein it was even considered to be a fat sensor (Dransfield, Reference Dransfield2008). These assumptions were strongly supported by the experiments in FAT/CD36-null mice. The FAT/CD36-null mice were unable to discriminate the LA-enriched solutions from the control, whereas the wild-type mice could (Laugerette et al., Reference Laugerette, Passilly-Degrace, Patris, Niot, Febbraio, Montmayeur and Besnard2005). Second, FAT/CD36 and LA might interact with each other. As we know, FAT/CD36 also plays an important role in mitochondrial oxidation, which involves CPT I as a key enzyme (Holloway et al., Reference Holloway, Bezaire, Heigenhauser, Tandon, Glatz, Luiken, Bonen and Spriet2006; Holloway et al., Reference Holloway, Luiken, Glatz, Spriet and Bonen2008). When LA was added to the diet, the mRNA expression of CPT I increased significantly in red muscles, and its half-life was prolonged by 50% (Morash et al., Reference Morash, Bureau and McClelland2009). As a ligand of peroxisome proliferator-activated receptor-γ (Belury et al., Reference Belury, Moya-Camarena, Lu, Shi, Leesnitzer and Blanchard2002), LA influenced the level of activation, resulting in increased FAT/CD36 (Teboul et al., Reference Teboul, Febbraio, Gaillard, Amri, Silverstein and Grimaldi2001).The preceding line of reasoning demonstrates the close interaction between FAT/CD36 and LA. In addition, LA is an essential FA and a primary member of the ω-6 PUFA family, which can be transformed to γ-linolenic acid and AA by elongation/desaturation. The increased levels in chicken are of great value in the improvement of meat quality.
Furthermore, chicken FAT/CD36-CHO significantly enhanced the proportion of AA during the uptake of FA, but no positive correlation was detected in the FA composition in this study. The difference might be due to the difference of an in vivo v. an in vitro environment, and further experiments are required to elucidate this phenomenon. In conclusion, the cellular uptake of FAs by the chicken FAT/CD36-CHO model, together with the correlation between different types of FAs and transporters, demonstrated selectivity in FA transport by different transporters.
Acknowledgments
This study was supported by the Joint Funds of the National Natural Science Foundation of China (u0731004), National Basic Research Program of China (2009CB941601), National Natural Science Foundation of China (30901058 and 30972157), the Natural Science Foundation of Guangdong Province of China (9451064201003790 and 9151064201000056) and Specialized Research Fund for the Doctoral Program of Higher Education of China (20094404120012).