INTRODUCTION
Toxocarosis is a zoonotic infection caused by the nematode Toxocara canis, which is common in dogs. Human infection is produced by the ingestion of eggs eliminated by dogs in their faeces, which contaminate the environment. Larvae in human hosts do not reach the adult stage, remaining as second-stage larvae and migrating around different tissues and viscera. Clinically, the infection depends on the parasitic load, the age of the patient and the migratory route of larvae in tissues. Among these, Visceral Larva Migrans (VLM) is the most frequently diagnosed (Overgaauw, Reference Overgaauw1997). The pathology of VLM is a consequence of a general migration of larvae, detected mainly in children between 2 and 7 years old, and associated with a history of pica and contact with puppies. Ocular Larva Migrans (OLM) is another important manifestation of toxocarosis. It is produced by the migration of larvae to the ocular chamber. Manifestations including uveitis, endophthalmitis, papilitis and retinal granulomas have been described (Gass and Braunstein, Reference Gass and Braunstein1983; Gillespie et al. Reference Gillespie, Dinning, Voller and Crowcroft1993). In a minority of cases, partial or total blindness may occur in one or both eyes (Benitez del Castillo et al. Reference Benitez del Castillo, Herreros, Guillen, Fenoy, Banares and Garcia1995).
As in other parasitic diseases, the monitoring of antibody responses involved in the different stages of the infection may elucidate the mechanisms of the immune system control over the parasite (Anderson et al. Reference Anderson, Vetter, Kreuzer and Bauer1994; Lutz et al. Reference Lutz, Ward and Gray1994; Ferreira et al. Reference Ferreira, Kimura, de Souza and Katzin1996; Paul, Reference Paul1999; Marcipar et al. Reference Marcipar, Risso, Silber, Revelli and Marcipar2001). In the case of toxocarosis, the parasite can survive during long periods of time and the antigenic stimulation is sufficient to maintain high levels of immunoglobulins (Fenoy et al. Reference Fenoy, Cuellar, Aguila and Guillén1992). This fact makes the differentiation between acute and chronic infection difficult. Currently, the ELISA with excretory-secretory (ES) antigen (ES-ELISA) (de Savigny, Reference de Savigny1975) is the method chosen, because of its high sensitivity and specificity, although it does not completely eliminate cross-reactions with other helminths (Magnaval et al. Reference Magnaval, Glickman, Dorchies and Morassin2001; Perteguer et al. Reference Perteguer, Cuéllar, Guillén, Águila, Fenoy, Chivato and Laguna2003). Furthermore, positivity criteria show high variability because standard controls are not available, making the comparative studies between different groups difficult (Matsumura and Endo, Reference Matsumura and Endo1982; Speiser and Gottstein, Reference Speiser and Gottstein1984; Aguila et al. Reference Aguila, Cuéllar, Fenoy and Guillén1987). Moreover, this method does not allow us to distinguish between acute and chronic infections. Therefore, the use of alternatives to the classic ELISA, such as methods measuring antibody avidity, is being proposed (Hubner et al. Reference Hubner, Uhlikova and Leissova2001; Uhlikova et al. Reference Uhlikova, Hubner and Leissova2002; Forstl et al. Reference Forstl, Buchta, Psohlavec, Cermak, Cermakova, Urban and Chrzova2004). The study of the avidity in human T. canis infection has shown high IgG avidity in the chronic phase and low IgG avidity in recently acquired toxocarosis (Hubner et al. Reference Hubner, Uhlikova and Leissova2001).
The optimization of methods that measured the antibody binding properties in long-term infections has been described (Nossal, Reference Nossal1992). During infection, the avidity of antibodies changes from low avidity, early in the infection, to high avidity as the infection progresses. Based on this progression, a simple method based on the selective unbinding of antibodies with chaotropic agents has been developed to establish the age of a variety of infectious diseases (Hedman et al. Reference Hedman, Lampalainen, Söderlund and Hedman1993). In our study, evolution of antibody avidity in T. canis-infected BALB/c mice was carried out to confirm whether antibody avidity permits an identification of acute and chronic infections.
MATERIALS AND METHODS
Toxocara canis embryonated eggs
T. canis eggs were obtained by dissection of gravid females from experimental infection in Beagles. The purified eggs were embryonated under sterile conditions at 37°C, under light, and preserved at 4°C until use (Cuéllar et al. Reference Cuellar, Fenoy, Aguila and Guillen1986).
Experimental animal sera
Sera from mice experimentally infected with T. canis embryonated eggs (EE) were used. Four-week-old BALB/c mice were infected with single or multiple doses of EE by intragastric intubation. Adequate measures were taken to minimize pain or discomfort in experimental animals. Experiments were carried out in accordance with the European Communities Council Directive of 24 November 1986 (86/609/EEC and RD 1201/2005) on protection of experimental animals.
Single dose (SD)
Six groups of 6 BALB/c mice were orally inoculated with 6, 12, 50, 100, 200 or 1000 EE/mouse. Animals were bled periodically after the first inoculation, and sera from each group of 6 animals were pooled and stored.
Multiple doses (MD)
Two groups of 6 BALB/c mice were orally inoculated with 200 or 1000 EE/mouse, administered in doses of 50 or 250 EE/mice on days 0, 7, 21 and 28. Animals were bled periodically after the first inoculation, and sera from each group of 6 animals were pooled and stored.
Production of excretory/secretory antigen from Toxocara canis larvae
To obtain ES antigen, the de Savigny (Reference de Savigny1975) method was used, with slight modifications (Guillén et al. Reference Guillén, Cuéllar and Águila1986; Aguila et al. Reference Aguila, Cuéllar, Fenoy and Guillén1987). Larvae were cultivated in Eagle's Essential Minimum Medium with Earle Salts and supernatants were collected weekly and pooled. The protein content was estimated using the Bradford method (Reference Bradford1976), and the ES antigen was frozen at −20°C until use.
Avidity ELISA
Avidity ELISA was based on the dissociative method using urea as a denaturing agent (Hedman et al. Reference Hedman, Lamppalainen, Seppälä and Mäkela1989). Plates were coated with ES T. canis antigen at 1μg/ml overnight and incubated for 30 min with 6m urea in PBS at room temperature. Microplates were washed and blocked with BSA for 1 h. Each serum was studied in quadruplicate (2 with urea treatment and 2 without), diluted 1:150 in PBS-Tween 20, BSA 0·1% and incubated for 2 h at 37°C. After incubating and washing, 2 of the quadruplicate sera were treated with PBS-6m urea for 30 min at room temperature and the remaining sera were incubated with PBS for 30 min. After washing, anti-mouse peroxidase conjugates (IgM+G, IgG, IgG1 and IgM Caltag Laboratories) were used. The reaction was developed with o-phenylene-diamine with hydrogen peroxide and read at 492 nm.
The AI was defined as the mean optical density (OD) of urea-treated wells/mean OD urea-untreated wells×100. Values over 50% were ranked as Ig with high avidity (Marcipar et al. Reference Marcipar, Risso, Silber, Revelli and Marcipar2001). In all cases, the AI was worked out with values of OD higher than 0·100.
Avidity WB
The T. canis ES antigen was electrophoresed in sodium dodecyl sulfate-12·5% polyacrylamide gels (Laemmli, Reference Laemmli1970) and then electroblotted onto nitrocellulose membranes. Strips were washed in PBS for 5 min and incubated with PBS-6m urea for 30 min. The membranes were blocked for 1 h at room temperature with PBS-5% non-fat milk. Membranes were washed 3 times for 5 min with PBS and incubated with BALB/c sera in duplicate at 1:500 in PBS-5% non-fat milk at room temperature for 60 min. Membranes were washed 3 times for 5 min and incubated for 30 min with PBS-6m urea at room temperature, while the other duplicate was incubated with PBS. All the strips were washed 3 times with PBS, and then membranes were incubated with peroxidase conjugate anti-mouse IgM+IgG, IgG1 and IgM. After a new cycle of washing, the strips were treated with 0·4% hydrogen peroxide 3,3′-diaminobenzidine tetrahydrochloride (Marcipar et al. Reference Marcipar, Risso, Silber, Revelli and Marcipar2001).
RESULTS
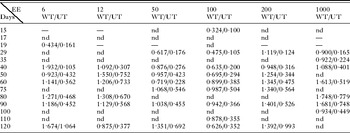
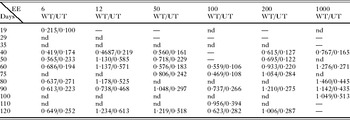
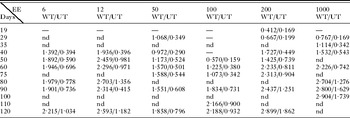
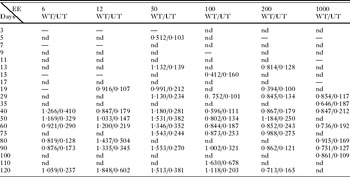
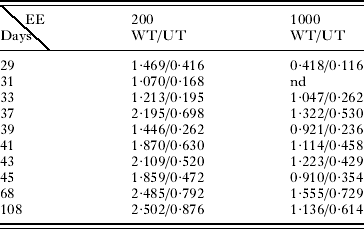
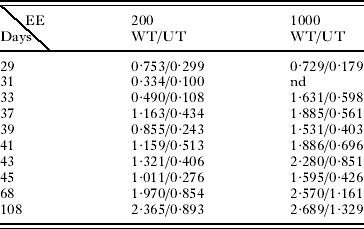
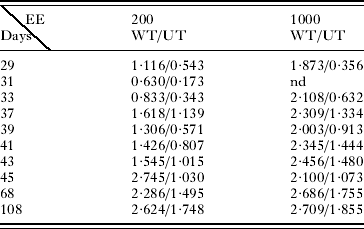
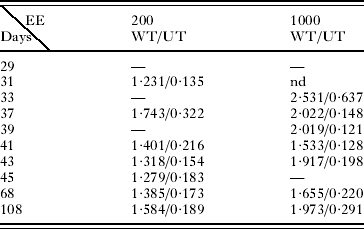
Specific antibodies against T. canis were detected in the presence or absence of urea, in sera of BALB/c mice inoculated with 6, 12, 50, 100, 200 and 1000 EE in SD or 200 and 1000 in MD (Tables 1, 2, 3, 4, 5, 6, 7 and 8).
Mice inoculated with a single dose of Toxocara canis embryonated eggs (EE)
(Sera were incubated with peroxidase-conjugated anti-mouse IgM+G. Optical density (OD) values of sera without treatment with urea (WT) and with urea treatment (UT) on days where values of OD were higher than 0·100, once the non-specific reaction with the BSA had been substracted are given. nd, not done.)

Mice inoculated with a single dose of Toxocara canis embryonated eggs (EE)
(Sera were incubated with peroxidase-conjugated anti-mouse IgG. Optical density (OD) values of sera without treatment with urea (WT) and with urea treatment (UT) on days where values of OD were higher than 0·100, once the non-specific reaction with the BSA had been substracted are given. nd, not done.)

Mice inoculated with a single dose of Toxocara canis embryonated eggs (EE)
(Sera were incubated with peroxidase-conjugated anti-mouse IgG1. Optical density (OD) values of sera without treatment with urea (WT) and with urea treatment (UT) on days where values of OD were higher than 0·100, once the non-specific reaction with the BSA had been substracted are given. nd, not done.)

Mice inoculated with a single dose of Toxocara canis embryonated eggs (EE)
(Sera were incubated with peroxidase-conjugated anti-mouse IgM. Optical density (OD) values of sera without treatment with urea (WT) and with urea treatment (UT) on days where values of OD were higher than 0·100, once the non-specific reaction with the BSA had been substracted are given. nd, not done.)

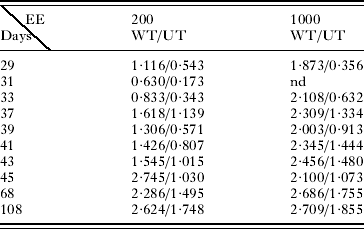
Mice inoculated with multiple doses of Toxocara canis embryonated eggs (EE)
(Sera were incubated with peroxidase-conjugated anti-mouse IgM+G. Values of optical density (OD) in sera without treatment with urea (WT) and with urea treatment (UT), on days where values of OD were higher than 0·100, once the non-specific reaction with the BSA had been subtracted are given. nd, not done.)
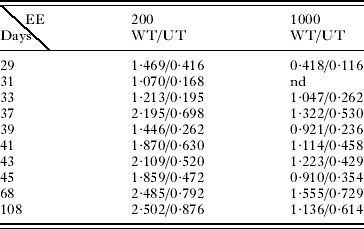
Mice inoculated with multiple doses of Toxocara canis embryonated eggs (EE)
(Sera were incubated with peroxidase-conjugated anti-mouse IgG. Values of optical density (OD) in sera without treatment with urea (WT) and with urea treatment (UT), on days where values of OD were higher than 0·100, once the non-specific reaction with the BSA had been subtracted are given. nd, not done.)
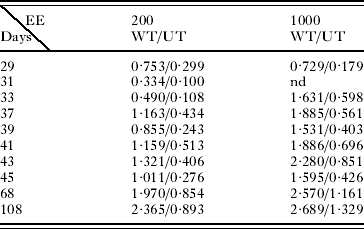
Mice inoculated with multiple doses of Toxocara canis embryonated eggs (EE)
(Sera were incubated with peroxidase-conjugated anti-mouse IgG1. Values of optical density (OD) of sera without treatment with urea (WT) and with urea treatment (UT), on days where values of OD were higher than 0·100, once the non-specific reaction with the BSA had been subtracted are given. nd, not done.)
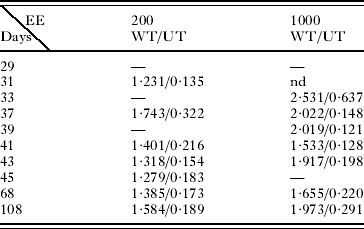
Mice inoculated with multiple doses of Toxocara canis embryonated eggs (EE)
(Sera were incubated with peroxidase-conjugated anti-mouse IgM. Values of optical density (OD) in sera without treatment with urea (WT) and with urea treatment (UT), on days where values of OD were higher than 0·100, once the non-specific reaction with the BSA had been subtracted are given. nd, not done.)
In SD, including the low doses of 6 and 12 EE, an increase in the AI was observed over time. Levels of AI over 50% in SD were detected in all the infective doses. The highest levels of AI were obtained with the IgM+G and with the IgG and the IgG1 isotypes. Antibodies of high avidity (over 50%) were detected earlier in the case of the low doses of eggs (6 and 12 EE) (around day 40 p.i.). In the case of the doses of 50, 100, 200 and 1000 EE, the highest AI were observed from day 60 p.i. (Fig. 1).
Evolution of the AI in sera from a single dose. (A) Six EE/mouse BALB/c; (B) 12 EE/mouse BALB/c; (C) 50 EE/mouse BALB/c; (D) 100 EE/mouse BALB/c; (E) 200 EE/mouse BALB/c; (F) 1000 EE/mouse BALB/c. ■ IgM+G; □ IgG; ▲ IgG1; △ IgM. Each point represents sera from all mice/group.

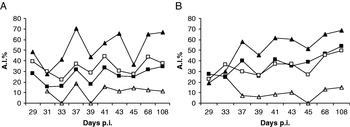
In MD with 200 or 1000 EE, high AI levels (over 50%) were observed in both cases, mainly with the IgG1 isotype from the early part of the study (days 29 and 37, p.i., respectively) (Fig. 2).
Evolution of the AI in sera from a multiple doses. (A) Six EE/mouse BALB/c; (B) 12 EE/mouse BALB/c; (C) 50 EE/mouse BALB/c; (D) 100 EE/mouse BALB/c; (E) 200 EE/mouse BALB/c; (F) 1000 EE/mouse BALB/c. ■ IgM+G; □ IgG; ▲ IgG1; △ IgM. Each point represents sera from all mice/group.

The study by WB was carried out with only 3 sera from each group, which were selected among those with the highest AI in ELISA: days 40, 80 and 120 with 6 EE; days 40, 60 and 90 with 12 EE; days 40, 90 and 120 with 50 EE, days 40, 90 and 120 with 100 EE; days 50, 75 and 90 with 200 and days 29, 60 and 100 with 1000 EE with SD and days 29, 37 and 41 with 200 EE and days 29, 37 and 45 with 1000 EE in MD. The study showed a variable number of bands: a group of bands over 250 kDa, a band of 100 kDa, other bands of 75 kDa, 50 kDa and 37 kDa and a group of bands of low molecular weights with a triplet between 37 and 25 kDa. The presence of these bands was more intense with the highest doses of 200 or 1000 EE in SD and in MD.
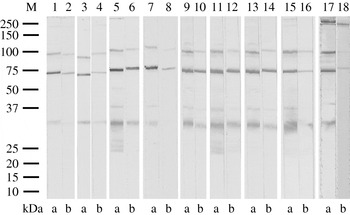
The urea treatment showed the presence of high avidity antibodies bound to 100 kDa and 75 kDa proteins in all the cases when the IgM+G and the IgG1 antibodies were investigated. Antibodies of variable avidity were observed in those sera that recognized the group of bands of low molecular weights (LMW), between 37 kDa and 25 kDa. High avidity antibodies were observed with high doses and in the last days of infection (Fig. 3).
WB of sera incubated with peroxidase-conjugated anti-mouse IgG1 (G1). Strips 1–12, SD; strips 13–16, MD; strips 17–18 sera with antibodies of low avidity. 1, 2: 6 EE (day 80). 3, 4: 12 EE (day 90). 5, 6: 50 EE (day 120). 7, 8: 100 EE (day 50); 9, 10: 200 EE (day 120); 11, 12: 1,000 EE (day 100); 13, 14: 200 EE MD (day 40); 15, 16: 1000 EE MD (day 45). Non urea-eluted antibodies (A) and urea-eluted antibodies (B).

With doses of 6 and 12 EE, the presence of bands of LMW (between 37 and 25 kDa) appeared faintly from the first day studied. These bands were weak after the urea treatment, mainly in the case of the IgG1. With the 50 EE inoculation, the highest avidity was shown on day 120 p.i when bands of LMW appeared. With 100 EE, the highest avidity was shown on day 50 p.i. With 200 and 1000 EE in SD, the avidity antibodies were observed on day 75 and on day 60 respectively, linked to the presence of bands of LMW, with both inoculations. However, the highest avidity antibodies were detected on day 120 with 200 EE and on day 100 with 1000 EE. In MD, IgG1 antibodies of high avidity were detected from day 29 p.i. with 200 EE and day 37 p.i. with 1000, when bands of LMW were patent.
The IgM isotype antibodies showed a different pattern. The sera only recognized the band around 75 kDa and the bands over 250 kDa. The band of 75 kDa showed high affinity after the urea treatment, whereas the bands of 250 kDa disappeared.
DISCUSSION
Different studies showed that the measure of the avidity of IgG antibodies as a diagnostic marker for diseases, such as toxoplasmosis, rubeolla, hanta virus infections, and herpes virus infections, would help to differentiate acute stages from chronic stages (Hedman et al. Reference Hedman, Lampalainen, Söderlund and Hedman1993).
In the case of human toxocarosis, several studies have shown that a high avidity of the IgG is associated with the chronic stage of an infection and a low avidity of the IgG with a fresh infection (Hubner et al. Reference Hubner, Uhlikova and Leissova2001).
Studies on avidity of this infection are scarce and measured only by an ELISA method. All of the studies were carried out in human infection and currently there are no studies in a controlled animal infection. In our study, in addition to the ELISA method, a WB method was used to discriminate between high and low avidity antibodies.
BALB/c mice experimentally infected with 6, 12, 50, 100, 200 or 1000 EE in SD showed an increase over time in terms of AI in all the cases studied. AI levels around 50% were observed in all the inoculation groups, indicating the presence of antibodies with high affinity. The immune responses detected were fundamentally of the IgG isotype (IgG1), reaching over 50% of AI with the low doses of 6 and 12 EE (day 40 p.i with 6 and 12 EE) before the first peak. With respect to the doses of 50 EE and higher, AI over 50% was observed from day 60 p.i., with fluctuations. This would indicate early chronic stages with low infective doses. In the case of MD of 200 and 1000 EE, immune responses mainly of the IgG isotype, principally IgG1, were observed, again from the early stages of the study (days 29 and 37 p.i. with 200 and 1000 EE, respectively). High avidity levels were reached earlier in MD than in SD with the same inoculations (200 and 1000 EE).
This is the first study of a follow-up on avidity in experimental and controlled Toxocara infections. Studies on human sera have been carried out and have demonstrated that the majority of the patients studied were in the chronic stages of their infections (Hubner et al. Reference Hubner, Uhlikova and Leissova2001; Rychlicki, Reference Rychlicki2004; Elefant et al. Reference Elefant, Shimizu, Sanchez, Jacob and Ferreira2006). However, in these studies, it was difficult to establish when the infections began.
The determination of antigens (by WB), recognized by high-avidity antibodies and low-avidity antibodies in the acute phase of the infection, was suggested by Marcolino et al. (Reference Marcolino, Silva, Lesser, Camargo and Mineo2000). For example, some individuals did not develop high avidity antibodies during the chronic phase of toxoplasmosis (Cozon et al. Reference Cozon, Ferrandiz, Nebbi, Wallon and Peyron1988; Paul, Reference Paul1999). On the other hand, Marcipar et al. (Reference Marcipar, Risso, Silber, Revelli and Marcipar2001) proved that the avidity WB was a valuable technique for identifying antigens bound to high and low avidity antibodies in Trypanosoma cruzi-infected rats.
The study of BALB/c mice experimentally inoculated with Toxocara EE was carried out by WB with only 3 sera from each infective dose, towards the last days of the study: IgM+G, IgM, and among IgG subclasses, IgG1, selected for its better results in avidity ELISA. The study showed the presence of a group of bands over 250 kDa, a band of 100 kDa, other bands around 75 kDa, 50 kDa, 37 kDa, and a group of bands of LMW with a triplet between 37 kDa and 25 kDa, recognized at different levels by the IgM+G, the IgG1 and the IgM. The bands detected by us were in agreement with the results obtained in other studies by WB in different animals, experimentally inoculated with Toxocara EE (Morales et al. Reference Morales, Lopez, Nicholls and Agudelo2002; Sarimehmetoglu et al. Reference Sarimehmetoglu, Burgu, Aycicek, Gönenç, Tanyuksel and Kara2002; Sommerfelt et al. Reference Sommerfelt, Santillán, Lopez, Ribich and Franco2001, Reference Sommerfelt, Santillan, Mira, Ribicich, Betti and De Torres2006). It has previously been established that bands of LMW between 35 and 24 kDa seem to be more specific to the genus Toxocara compared with bands of middle and high molecular weight (50–200 kDa) detected in patients infected with T. canis (Magnaval et al. Reference Magnaval, Fabre, Maurieres, Charlet and Larrard1991). The group of bands of 250 kDa was recognized by the IgM+G and the IgM isotypes, although they were also recognized with less intensity by the IgG1 antibodies. The band of 100 kDa was not recognized by the IgM antibodies. Bands around 75 kDa, 50 kDa, 37 kDa and the group of bands between 32 kDa and 25 kDa were only detected by the IgM+G and the IgG1 isotypes. The intensity of these latter bands was stronger in the elevated doses of 200 and 1000 EE in SD and in MD.
The urea treatment showed the presence of high avidity antibodies bound to proteins of 100 kDa and 75 kDa in all the sera investigated with the IgM+G and the IgG1 in SD and MD doses. However, the presence of these bands has been considered non-specific in a Toxocara infection (Magnaval et al. Reference Magnaval, Fabre, Maurieres, Charlet and Larrard1991). In low doses of 6 and 12 EE, the presence of bands of LMW (between 37 and 24 kDa), considered as a diagnostic marker in a Toxocara infection, appeared faint from the first day studied (day 40 p.i.). These bands remained faint after the urea treatment, mainly with IgG1. A similar behaviour was detected with the LMW proteins in the other doses. A relation between the presence of LMW proteins and high avidity was observed. With the 50 EE doses, high avidities were shown on day 120 p.i when bands of LMW were detected after the urea treatment. The highest avidity was shown on day 50 p.i with 100 EE, with a band of LMW between 25 and 37 kDa. With 200 and 1000 EE, high avidity was observed on day 75 and 69 p.i. respectively, linked to the presence of bands of LMW. However, higher avidity antibodies were detected on day 120 p.i. with 200 EE and on day 100 p.i. with 1000 EE. In MD, IgG1 antibodies of high avidity were detected from day 29 p.i. with 200 EE and day 37 p.i. with 1000 EE, when bands of LMW were patent.
The results observed with the WB technique showed not only an avidity of the IgG1 with the bands of LMW previously described as specific in a Toxocara infection (Magnaval et al. Reference Magnaval, Fabre, Maurieres, Charlet and Larrard1991), but the avidity of the IgG1 was also associated with the presence of these bands and with the chronic stage of the infection.
The present study in avidity WB with doses of 6, 12, or 100 EE in SD and 200 or 1000 EE in MD, maintained a good relationship with the IgG1 isotype, measured with avidity ELISA. Avidity WB proved a valuable technique to identify antigens bound to high or low avidity antibodies in a Toxocara infection, such as has previously been described (Marcipar et al. Reference Marcipar, Risso, Silber, Revelli and Marcipar2001). With the 50 EE dose, 2 peaks of AI were detected by the ELISA method on days 75 and 120 p.i. With the WB technique, only day 120 p.i. was studied and this method confirmed the presence of antibodies of high avidity detected with the ELISA method. Nevertheless, with the doses of 200 and 1000 EE in SD, the WB method showed a higher sensitivity in detecting bands of LMW at an early stage (days 75 and 60 by WB versus day 90 p.i. by ELISA, in both inoculations).
The study of IgM antibody responses only showed 1 band near 75 kDa with high avidity after the urea treatment and bands near 250 kDa that disappeared after urea treatment. Although the presence of IgM has been described in the acute and chronic stages of Toxocara infections (Elefant et al. Reference Elefant, Shimizu, Sanchez, Jacob and Ferreira2006), the low avidity detected in our study, has not proved useful in avidity studies.
Our study confirmed a good relationship, in terms of avidity, between the two techniques used with the IgG1 isotype and their applicability in the diagnosis of toxocarosis. It is important to highlight the relationship between high AI detected in the ELISA method and the appearance of LMW specific bands in a Toxocara infection (Magnaval et al. Reference Magnaval, Fabre, Maurieres, Charlet and Larrard1991) that showed high avidity. Our results show that AI determination is a useful tool to differentiate acute stages from chronic stages in human toxocariosis.
We are grateful to L. Hamalainen for help in the preparation of the manuscript. This work was supported by 1/01 and 17/03 grants from the Fundación Universitaria San Pablo-CEU.