INTRODUCTION
Agriculture is the mainstay of the Ethiopian economy in terms of income, employment and generation of export revenue. It directly supports 85% of the population of about 80 million and 80% of the export value in Ethiopia. Its contribution to gross domestic product (GDP), although showing a slight decline over the years, has remained very high, at approximately 43% by 2009 (Hagos et al., Reference Hagos, Namara, Godswill and Awulachew2009; MoARD, 2010). Among the sub-sectors of agriculture, crop production is a major contributor to GDP accounting for approximately 28% in 2005/2006.
Agriculture in Ethiopia is mainly dependent on rainfed systems, and this dependency has put the majority of the Ethiopian population at the mercy of meteorological variability. With increasing meteorological variability due to changing climate, it is highly probable that the rainfed agriculture of Ethiopia will be vulnerable to its effects.
On the other hand, Ethiopia has 12 river basins with annual surface runoff volume of 124.5 km3 (Awulachew et al., Reference Awulachew2007; MoWR, 2002) and estimated irrigation potential of 5.3 million hectares (Mha). The groundwater potential is estimated at 6.5 km3, which could realize about 1.1 Mha irrigation development (Awulachew, Reference Awulachew, Merrey, Kamara, Van Koopen, De Vries and Boelle2010). Moreover, ample rainfall is available to be tapped through rainwater management for household level small-scale irrigation. However, the developed irrigation from all these sources is so far, not more than 0.7 Mha (Awulachew, Reference Awulachew2010).
Irrigation schemes in Ethiopia are classified on the basis of: the size of command area, technology used and management system. In the command area classification, they are classified as small (less than 200 ha), medium (200 to 3000 ha) and large scale (over 3000 ha) (Awulachew et al., Reference Awulachew, Merrey, Kamara, Van Koopen, De Vries and Boelle2005; Hagos et al., Reference Hagos, Namara, Godswill and Awulachew2009; MoWR, 2002). The small-scale irrigation schemes are further classified into two major categories of modern and traditional schemes. Modern schemes usually have fixed or improved water control/diversion structures. Traditional schemes have no permanent diversion structures and are reconstructed every year from local materials by farmers themselves. The technological classification divides schemes according to the differences in the technology used to control and divert water. These influence water availability, efficiency of water use, and operation and maintenance costs. The third classification takes into account the management system, namely traditional, modern, public and private (Werfring, Reference Werfring2004).
In 2005/2006, the total reported area of irrigated agriculture in the country was about 626 116 ha, of which traditional irrigation, modern small-scale irrigation, modern medium- and large-scale irrigation schemes accounted for 77%, 9% and 14% respectively. During the period considered, the total cultivated land area (irrigated plus rainfed) was about 12.28 Mha (MoFED, 2006). The total irrigated area accounts for approximately 5% of the total cultivated land. When the traditional schemes are not considered, the irrigated area covers approximately 1.6% of the total cultivated area. Since the baseline information was collected in 2006, there is no clear and updated information about irrigation coverage. However, it is generally considered that the coverage has increased in the small-scale traditional sectors, particularly in food crops and commercial sectors of horticulture including floriculture.
Despite, the high potential of water resources, there is a high spatial variability in water resources endowment and development in the country. Much of the formal irrigation developments are located in the Awash Basin, where about 50 medium- and large-scale irrigated farms are located. This may be due to the suitability of the morphology of the river for gravity diversion, topography of the basin for irrigation, no complexity of the river in transboundary waters and easy access to the internal market for produce.
With progressively increasing physical infrastructures of irrigation projects, special attention should be given to the performance of the systems. Performance can be simply defined as “the level of achievement of the desired objectives” (Mohtadullah, Reference Mohtadullah1993). According to Molden et al. (Reference Molden, Sakthivadivel, Perry, de Fraiture and Kloezen1998), performance is assessed for a varieties of reasons: to improve system operations, to assess progress against strategic goals, as an integral part of performance-oriented management, to assess the general health of a system, to assess impacts of interventions, to diagnose constraints, to better understand determinants of performance and to compare the performance of a system with others or with the same system over time. The type of performance measures chosen depends on the purpose of the performance assessment activity.
Irrigation performance assessment is rarely conducted in Ethiopia due to lack of field level data. Some attempts have already been made to assesses the scheme level performance of some irrigation schemes (Belete, Reference Belete2006; Habib, Reference Habib2004; Mekonen and Awulachew, Reference Mekonen and Awulachew2009; Yusuf and Tena, Reference Yusuf and Tena2006). There is a need to develop aggregate indicators that provide a clue to the performance of irrigation development under limited data availability. Yercan et al. (Reference Yercan, Dorsan and Ul2004) have employed physical performance indicators to assess irrigation performance in Turkey. These indicators mainly show the extent to which the developed schemes are utilized to meet their objectives. These types of indictors are useful in countries like Ethiopia where measured data are scarce to carry out detailed scheme level performance assessment.
In this paper, the main objectives include: (i) broad assessment of the performance of irrigation in Ethiopia; (ii) analysis of causes of underperformance of small-scale irrigation in two major regions of Ethiopia and (iii) comparative performance analysis of selected large-scale schemes.
METHODOLOGY
Indicators are used to measure performance. An indicator describes the level of actual achievement in respect of one of the objective of irrigation. Indicators are used to simplify the otherwise complex internal and external factors affecting the performance of irrigated agricultural systems. Indicators used in this research are relative values that compare actual achievements with target values.
Broad assessment of the performance of irrigation projects
Given the proper operation and management of irrigation, it is believed that the greater the number of irrigation projects that are operational, the larger will be the number of beneficiaries and the positive impact on household livelihoods. Hence, we have used three major physical indicators to review the broad assessment of the performance of irrigation at national levels. These are briefly described below.
Relative number of operational irrigated schemes: This is the ratio of aggregated number of successfully operating irrigation schemes to the total developed irrigation schemes in the country during the time considered.
Relative irrigated area: This is the total area under irrigation versus total designed command areas of already implemented irrigation projects during a particular year or averaged over years in the country or region.
Beneficiaries target performance: This is the ratio of actual number of beneficiaries using irrigation schemes and planned or targeted number of beneficiaries. This is applicable mainly to community-owned schemes in the country or region.
For capturing the potential of irrigation, we used secondary data sources based on master plan studies and review of literature. For the assessment of broad national performance, we used the database developed for this purpose according to Awulachew et al. (Reference Awulachew, Yilma, Loulseged, Loiskandl, Ayana and Alamirew2007).
Analysis of causes of underperformance of small-scale irrigation
The performance indicators we considered for small-scale irrigation focused on studying major causes of underperformance of poorly performing schemes. Failure or sub-optimal operation of small-scale schemes are due to numerous factors that can be categorized in two major groups related to structural (hardware) and management (social and institutional) factors.
Structural (hardware) performance: This relates the number of structurally functional schemes to total number of schemes implemented during the period.
Social and institutional (management) performance: This is the ratio of number of managerially functional schemes to that of total schemes implemented.
In order to evaluate the performance of the small-scale schemes, we have used two regions in Ethiopia: Oromia and the Southern Nations and Nationalities People's Region (SNNPR). The two regions represent about half of the land mass of Ethiopia and its population. The underperforming irrigation schemes sampled in the two regions comprised 27 schemes in SNNPR (Robel, Reference Robel2005) and 37 schemes in Oromia (Girma, Reference Girma2006). The causes for underperformances related to structural and management problems were assessed using information gained from field investigations and key informant interviews during 2005 and 2006.
Comparative performance of selected large-scale schemes
A number of researchers have defined and tested sets of indicators that characterize irrigation system performance (Bos et al., Reference Bos, Burton and Molden2005; Burton et al., Reference Burton, Molden and Skutsch2000; Kloezen, Reference Kloezen and Garcés-Restrepo1998; Molden et al., Reference Molden, Sakthivadivel, Perry, de Fraiture and Kloezen1998). The intention is to evaluate the conditions of the performance and identify the areas of improvement in the operation and management of irrigation to enhance efficiency and productivity of resources use. The major performance indicators used in this study are those that were recommended by Molden et al. (Reference Molden, Sakthivadivel, Perry, de Fraiture and Kloezen1998) including conveyance efficiency of irrigation systems. These are briefly described below.
Irrigation water delivery performance. An irrigation system is a set of physical and institutional elements employed to acquire water from a naturally concentrated sources, to facilitate and control the movement of the water from its source to the root zone of land devoted to the production of agricultural crops (Small and Svendsen, Reference Small and Svendsen1990). A properly operated and maintained irrigation system delivers, in timely fashion, an adequate amount of water to the point of use. Indicators, used to measure the adequacy and efficiency of water delivery, are described below:
a) Annual relative water supply (ARWS): This relates the total volume of water applied (irrigation water plus total rainfall) to the volume of water required by the crops during the period. Total volume of water supplied during the period in the case of large-scale schemes were obtained from the respective scheme administration. The volume of water demanded by the crops was estimated using meteorological data obtained from meteorological stations of the schemes and CROPWAT 4 version 4.3 (FAO, 1989).
b) Annual relative irrigation supply (ARIS): This is the ratio of total volume of irrigation water delivered to the volume of irrigation water demanded (net irrigation requirement, i.e. crop evapotranspiration minus effective rainfall).
c) Water delivery ratio (WDR): This relates the amount of water actually delivered to the scheme versus amount of water needed to be delivered, i.e. total water supplied to the scheme divided by gross irrigation water requirement. The later was estimated by considering 65% irrigation efficiency.
d) Conveyance efficiency (Ec): This is the total amount of water flowing into a canal system at a point divided by the amount of water reaching a certain distance downstream of the previous point. It measures the efficiency of the canal system to convey water and shows the amount of water loss over a given travel distance. Ec was measured using current meter and floating methods in which the water flow velocity in the known cross-sectional areas of the canal system was measured and discharge was calculated as the product of velocity and canal cross-sectional area.
Output performance indicators. The final output of irrigated agriculture is crop production which can be expressed in terms of productivity, i.e. yield in tonnes or its monetary value in US$ per unit of land and water resources used. The following indicators were used to measure the output performances:
i. Output per harvested area: is the amount of yield in tons or its monetary value in US$ obtained per units of harvested land.
ii. Output per water supplied: is expressed as the monetary values in US$ earned per units of water supplied in m3. With this indicator it is possible to compare the productivity of different schemes and crops.
The above described comparative performance indicators were employed to evaluate the performances of five government-owned irrigation schemes, which are believed to have a large contribution to national income and one community-managed irrigation scheme. The selected schemes include Hare, Sille, Billate, Methara, Wonji and Finchaa. The Hare scheme is community-managed. Major crops grown in Hare and Sille are banana, cotton and maize. Whereas Billate scheme has been producing tobacco the other three are growing sugarcane.
Data required to measure the indicators have been collected from the respective schemes and also drawn from different sources (Awulachew, Reference Awulachew, Yilma, Loulseged, Loiskandl, Ayana and Alamirew2007; Belete, Reference Belete2006; Girma, Reference Girma2006; Mekonen and Awulachew, Reference Mekonen and Awulachew2009; Robel, Reference Robel2005).
RESULTS AND DISCUSSION
The results of quantified broad national level and regional level performance indicators as well as scheme level comparative performance indicators are presented in the following sections.
Irrigation potential and national level performances
Total irrigation potential versus developed irrigation. Awulachew (Reference Awulachew2010) provided revised estimate that total irrigable land potential in Ethiopia is 5.3 Mha, including 1.6 Mha through rainwater harvesting and groundwater potentials. This estimate is made based on level of irrigation technologies currently in use and river basin master plan studies such as reported in BCEOM (1999).
According to the review results, the distribution of irrigation potential can be summarized as follows:
• Large-, medium- and small-scale based on master plan studies in 12 river basins covers 3.73 Mha from surface water, which is the aggregated sum results of master plan studies (Awulachew et al., Reference Awulachew, Yilma, Loulseged, Loiskandl, Ayana and Alamirew2007).
• Rainwater harvesting, largely based on limited technologies of water harvesting at 0.1 ha per household and five million farmers in erratic rainfall areas, covers 500 000 ha.
• Groundwater development, largely in the crop cultivating areas based on 6.5 km3 water potential (Awulachew, Reference Awulachew2010), and at the water demand volume of about 6000 m3 per ha, provides irrigation for about 1.08 Mha.
National level irrigated development performance. Irrigation development is considered as one of the strategies of the country to fight against poverty and food insecurity. The data that have been collected with the existing information systems (Awulachew et al., Reference Awulachew, Yilma, Loulseged, Loiskandl, Ayana and Alamirew2007) cover only 312 schemes of different sizes. As there is no newer data, we have based our national level performance analysis on this database for modern small- and large-scale schemes.
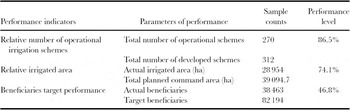
The results of the national level (broader scale) irrigation performance indicators are presented in Table 1.
Broad irrigation performance indicators on the status of irrigation in Ethiopia.

The result shows that 86.5% of the developed 312 small- and medium-scale irrigation schemes were operational during the period of the study. Even those schemes that were characterized as operational were not functioning at their full capacity. That means either they were serving less than the planned command areas or cropping intensity all-round the year could not be increased. As a result 74% of the total command area was cultivated during the period considered. This shows that, apart from inefficiencies that may exist in cultivated command areas, 26% of the created irrigation potential is not being used. The already developed small- and medium-scale irrigation schemes serve only about 50% of the targeted number of beneficiaries. Detailed information about the schemes can be obtained from Awulachew et al. (Reference Awulachew, Yilma, Loulseged, Loiskandl, Ayana and Alamirew2007). Although the country is committing scarce financial resources to develop irrigation with the view to ensure food self-sufficiency at household level and reduce poverty, the potential created is not properly utilized. Hence, parallel to the efforts exerted to develop new irrigation projects, attention need to be given to proper management of existing schemes. Although the national level performance assessment sounds broad and does not provide scheme-specific information, it gives the first insight into the general status of the performance of irrigation development in the country.
Analysis of underperformance of small-scale irrigation
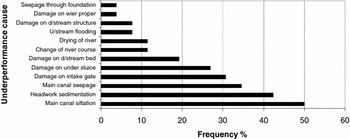
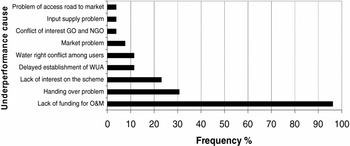
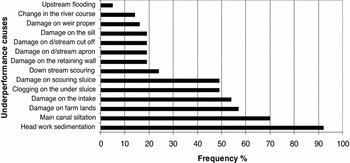
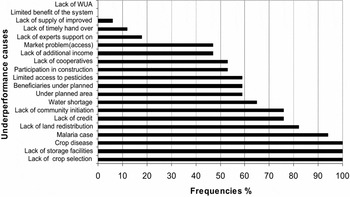
Based on the data provided by Robel (Reference Robel2005) and Girma (Reference Girma2006), we were able to identify 26 factors of structural (hardware) causes that led to underperformance of irrigation schemes in SNNPR and Oromia. Similarly, 27 factors that are of social or management nature were also identified as causes contributing to underperformance of irrigation schemes in the regions. The occurrence of the factors causing underperformance were counted and plotted in the form of frequency distribution (Figures 1 to 4).
Qualitative assessment of causes and frequency of technological underperformance of small-scale irrigation schemes in SNNPR.

Qualitative assessment of causes and frequency of management underperformance of small-scale irrigation in SNNPR.

Qualitative assessment of causes and frequency of technological underperformance of small-scale irrigation in Oromia region.

Qualitative assessment of causes and frequency of management underperformance of small-scale irrigation in Oromia region.

The results reveal that sediment-related problems resulting in main canal siltation and sediment accumulation in the upstream of the weir or headwork are the major causes of structural problems (Figures 1 and 3). These are inherently caused by transported sediment from the degraded areas of the watersheds. This indicates the importance of integrating watershed management with irrigation development to sustain irrigated agriculture.
With regards to management-related problems, limitation in agronomic practices, lack of funding or mechanisms of fund raising for operation and maintenance, prevalence of crop disease, crop selection, and post harvest technologies for storage are major causes of management-related underperformances (Figure 2 and 4).
Comparative performance of selected large-scale schemes
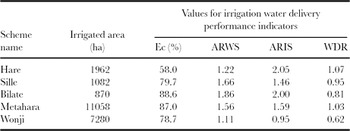
Water delivery performances. The indicators of water delivery performance are computed and presented in Table 2. The values of conveyance efficiencies of the main systems vary between 58% in the Hare scheme and 88.7% in the Bilate scheme. In the Hare scheme, the system consists of earthen channels and is poorly maintained leading to higher water losses. In Bilate scheme the conveyance system consists of a concrete canal and closed pipes providing higher conveyance efficiency.
Comparison of various large scale irrigation schemes: water delivery performance indicators (2005/06).

Ec: Conveyance efficiency; ARWS: Annual relative water supply; ARIS: Annual relative irrigation supply; WDR: Water delivery ratio.
Annual relative water supply relates the total volume of water applied (irrigation plus total rainfall) to the volume of water required by the crops. The results in Table 2 show that the values of ARWS are equal or greater than unity. Pèrez et al. (Reference Pèrez, Rodriguez, Camacho and Lopez2005) categorized ARWS values ranging from 0.9 to 1.2 as adequate and from 1.2 to 1.8 as excessive and values from 1.8 to 2.5 as very excessive. Accordingly, except Wonji and Hare, the other schemes considered are operating in the range of excessive water application. Better water management can save the excessive water that could be used either for the expansion of irrigated land or ecosystem functions.
Annual relative irrigation supply, on the other hand, is the ratio of the volume of irrigation water delivered to the volume of irrigation water demanded (net irrigation water requirement). The value of this indicator is nearly unity in the Wonji irrigation scheme and ranges from 1.46 to 2.05 in case of other schemes, indicating that the amount of water supplied exceeded the estimated crop water requirement.
Unlike ARIS, WDR relates the amount of water delivered to the amount of water needed to be delivered. According to the values of this indicator, Wonji and Bilate irrigation schemes were found to have delivered less amount of water than needed.
The values of water delivery indicators showed that except Wonji the other considered schemes have diverted excess amount of water than actually required during the growing period. At Wonji scheme, water is diverted using pumps which have higher running costs compared to gravity diversion and at the same time provide an opportunity to better control the amount of water that enters the farm. Hence, the costs incurred as a result of pumping might have encouraged better management of water at Wonji.
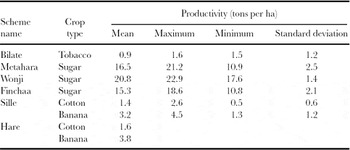
Output performance of selected large-scale schemes. The output performances of different irrigation schemes in tonnes per ha are given in Table 3. We found it difficult to compare the output performances of different schemes with different production objectives (e.g. sugar production vs maize) unless monetary value is considered as the major indicator. Comparison at this stage has to be made between schemes of similar operation or the values obtained here can be compared with an initially set target or values obtained at a particular location or time (Bos et al., Reference Bos, Burton and Molden2005).
Crop productivity of various large-scales schemes in Ethiopia (crop yield per units of area).

The results in Table 3 show that there is variability of agricultural productivity between schemes growing similar crops. This is mainly attributed to differences in management practices. There is also inter-seasonal variability of productivity within the same scheme. This is depicted by wide ranges between maximum and minimum yields obtained by all schemes. Wonji was found to be the most productive among sugarcane producing schemes.
To make the comparison of outputs across the schemes, the outputs were converted in to monetary values per units of water, harvested area or irrigated land. The results of these computations are provided in Table 4.
Productivity of large-scale schemes in Ethiopia (output per resources utilized, monetary† values (2005/06)).

†The currency exchange rate of Birr to US dollars used is related to the year the data was gathered.
The productivities of cotton, maize and banana crop varieties given in Table 3 above are very low compared to the yield potential of the respective crops, i.e. 5.4, 8.0, 32.4 tons per ha respectively (Aklilu, Reference Aklilu2006).
Poor irrigation water management practices and subsequent rise in groundwater levels are reported to have caused water logging and salinization of the soils in the Sille, Billate and Hare schemes, which have negative effect on land productivity (Aklilu, Reference Aklilu2006; Belete, Reference Belete2006). Furthermore, low level of skills of farmers and lack of support services to access improved agricultural inputs and extension services constrained productivity of the schemes.
On the other hand, large-scale irrigation schemes that grow sugarcane and are managed by government agencies are achieving higher productive yield, providing monetary benefits exceeding ten-fold that of other crops.
In large-scale schemes, the values of conveyance efficiencies of the main systems are higher in government-managed schemes (79–89%) than community-managed ones (58%). The scheme level values of water supply performance indicators such as ARWS and ARIS revealed that water diverted to the farms was sufficient to satisfy the water demanded during the season considered. Schemes that grow sugarcane were found to achieve higher outputs per units of water supplied and area harvested. In contrast, community-managed schemes such as Hare are characterized by low water productivity. Many of the irrigation canals and water storage infrastructures are losing their water carrying and storage capacities in a very short time due to erosion and sedimentation. Hence, integration of irrigation development with proper watershed management practices is crucial for sustainable solutions.
This performance study was made on limited data in terms of time series covering year 2005 and 2006 for small-scale schemes. However, we believe that it has provided insights to understand the performance of irrigation systems and contribute to the broader knowledge of understanding performance of irrigation in developing countries such as Ethiopia. The results are particularly important, as the country is embarking on the second phase of ‘Plan for Accelerated Socio-economic Development to End Poverty (2010/11 to 2015)’ which is to be implemented by the government of Ethiopia and its development partners.
CONCLUSIONS
Irrigation development is very much needed in developing countries as it enhances land, water and labour productivity and improves use of agricultural inputs. Irrigated agriculture shows significant improvement over rainfed agriculture productivity (Bastiaanssen and Perry, Reference Bastiaanssen and Perry2009). It provides improved resilience against climate variability, improves food security and enhances intensification. However, the performance of irrigation in developing countries is also questioned due to relatively low performances. In order to improve performance, measures are needed to develop the capacity of the actors to design realistic infrastructure, support irrigation users and develop capabilities to improve management of systems.
This research showed that irrigation schemes in Ethiopia are not functioning at their optimal capacity. On the other hand, there are certain systems/schemes that are performing well by many measures and indicating irrigation as a viable opportunity. Many of the small- and medium-scale irrigation schemes are underperforming due to inadequate planning, design and construction failures, lack of operation and management of schemes, soil erosion and sedimentation, and lack of maintenance of the water control and conveyance structures (Aklilu, Reference Aklilu2006; Girma, Reference Girma2006; Robel, Reference Robel2005). Based on evidence of Oromia and SNNPR, lack of adequate extension to advice agronomic practices, lack of responsible managing institutions, low technical and financial capacity for sustained operation and management of schemes, post harvest storage, processing and marketing, weakness of support services are crucial challenges that need to be tackled in order to improve performances of smallholder irrigated systems.
Acknowledgements
The authors would like to thank the Austrian Development Agency for the financial support provided to the project entitled Impact of Irrigation on Poverty alleviation and the Environment and BMZ-Germany for faciltating the publication of this paper.