Implications
Patterns of change of effective population sizes (Ne ) of breeds are important measures of the success of conservation activities but rigorous deduction of Ne is a specialized activity. However, Ne shows some proportionalities with the census sizes of livestock breeds, which may lead to predictive equations. This approach may be applicable in circumstances where pedigree data are not available. Although the resulting estimates of N e are only approximate, they can indicate breeds meriting further study.
Introduction
Livestock breeds (farm animal genetic resources) are acknowledged as components of world biodiversity. Responsibility for monitoring global conservation status has been assigned to the Food and Agricultural Organization (FAO) of the United Nations, whose global database, known as DAD-IS (http://dad.fao.org/) documents the numerical status of each country’s livestock breeds. In some countries, including the UK (Pilling and Scherf, Reference Pilling and Scherf2010; Villanueva et al., Reference Villanueva, Sawalha, Roughsedge, Rius-Vilarassa and Woolliams2010), national suites of biodiversity indicators include indices based not only on numerical status of breeds but also on the globally accepted measure of within-breed genetic diversity, namely effective population size Ne . Maintenance of Ne at, or above, 50 to 100 is a principle of breed conservation (Meuwissen, Reference Meuwissen2009). Criteria for degree of endangerment of livestock breeds, in Europe, are discussed by Gandini et al. (Reference Gandini, Ollivier, Danell, Distl, Georgoudis, Groeneveld, Martyniuk, van Arendonk and Woolliams2004), and Ne is only one of many variables to be taken into account in breed conservation (Verrier et al., Reference Verrier, Leroy, Blouin, Mériaux, Rognon and Hospital2015).
Unlike in floral and faunal conservation, in livestock breeds parentage is very often documented in such a way that increment in inbreeding can be calculated leading to a direct measurement of Ne from genealogical data. In many breeds this documentation does not exist, or is of insufficient depth of pedigree. Here, approximate methods can be used. The most frequently applied has been the equation of Sewall Wright (Leroy et al., Reference Leroy, Mary-Huard, Verrier, Danvy and Charvolin2013) where only the numbers of male (M) and female (F) parents are required:
 $$N_{e} \,{\equals}\,4{{MF} \over {\left( {M{\plus}F} \right)}}$$
Wright’s equation, whose function is denoted here as Ne (Wright), has been elaborated as follows (Hill, Reference Hill1979):
 $$\eqalignno {&\displaylines{ {1 \over {N_{e} }}{\equals}} \cr& {1 \over {16ML}}\left[ {2{\plus}var_{{mm}} {\plus}2\left( {{M \over F}} \right)cov\left( {mm,mf} \right) {\plus}\left( {{M \over F}} \right)^{2} var_{{mf}} } \right]\cr& {\plus}{1 \over {16FL}}\left[ {2{\plus}var_{{ff}} {\plus}2\left( {{F \over M}} \right)cov\left( {fm,ff} \right){\plus}\left( {{F \over M}} \right)^{2} var_{{fm}} } \right] $$
This takes into account generation length L and variation in breeding success among parents (with terms derived from variances and covariances of family size; the expressions mm, mf, fm, ff indicating sons per sire, daughters per sire, sons per dam, daughters per dam). In the present study, this formulation is termed the ‘Hill equation’, yielding Ne (Hill). In studies where it has been used, these terms have been calculated specifically for the breeds being considered. The possibility does not seem to have been investigated, that this could be avoided by the use of approximate or consensus values for these terms, thus widening applicability of the Hill equation to breeds where variances and covariances are unknown.
Hill’s equation has been suggested to be of particular value when pedigrees are limited in depth (Tholen et al., Reference Tholen, Staack, Muller and Ingwersen2010) because it does not require calculation of inbreeding. If generation length is known, it is possible to deduce Ne (Hill) from a single volume of a herdbook (where parentage details of the animals registered in a particular time interval are published in the traditional way, as practised since the early 19th century). With full access to verified electronic databases this is of no advantage, except that in some situations, breed societies withhold access to electronic pedigree databases, for data protection or other reasons. Published herdbooks are usually more freely available. Therefore, validation of Ne (Hill), by comparison with Ne as measured in other ways, is of interest. A disadvantage of Ne (Hill) is that, although it takes account of differential breeding success among the parental generation, it does not do so in the case of the progeny generation. This is probably why it usually gives higher values for Ne than methods based on increment of inbreeding or coancestry (horses: Verrier et al., Reference Verrier, Audiot, Bertrand, Chapuis, Charvolin, Danchin-Burge, Danvy, Gourdine, Gaultier, Guémené, Laloë, Lenoir, Leroy, Naves, Patin and Sabbagh2010; pigs: Tholen et al., Reference Tholen, Staack, Muller and Ingwersen2010; cattle: Hartwig et al., Reference Hartwig, Wellmann, Hamann and Bennewitz2013). Caballero (Reference Caballero1994) predicted that Ne (Hill) should agree with Ne (DF) when a regular breeding scheme operates with restricted inbreeding, and this was found by Habier et al. (Reference Habier, Götz and Dempfle2009). For some pigs (Tholen et al., Reference Tholen, Staack, Muller and Ingwersen2010) and Spanish fighting bull (Cervantes et al., Reference Cervantes, Goyache, Molina, Valera and Gutiérrez2008), Ne (Hill) is the same as, or lower than inbreeding-based Ne , again suggesting that inbreeding is being avoided.
Several genealogical methods exist for computation, from pedigree data sets, of Ne in terms of the rate of increase in inbreeding (Leroy et al., Reference Leroy, Mary-Huard, Verrier, Danvy and Charvolin2013). Here, these are collectively termed Ne (DF). The extent of genomic linkage disequilibrium (LD), deduced from microsatellite and single-nucleotide polymorphism (SNP) data, can also indicate effective population size, termed here Ne (LD). Another approach is the estimation of Ne (ROH) from the extent of runs of homozygosity (ROH), and further genomic approaches are emerging (Bruford et al., Reference Bruford, Ginja, Hoffmann, Joost, Orozco-terWengel, Alberto, Amaral, Barbato, Biscarini, Colli, Costa, Curik, Duruz, Ferenčaković, Fischer, Fitak, Groeneveld, Hall, Hanotte, Hassan, Helsen, Iacolina, Kantanen, Leempoel, Lenstra, Ajmone-Marsan, Masembe, Megens, Miele, Neuditschko, Nicolazzi, Pompanon, Roosen, Sevane, Smetko, Štambuk, Streeter, Stucki, Supakorn, Telo da Gama, Tixier-Boichard, Wegmann and Zhan2015).
Santiago and Caballero (Reference Santiago and Caballero1995) described from a theoretical basis, coupled with simulations, how Ne can be deduced from Nc in a population in which every individual is subject to selection. Predictive equations were used by Villanueva et al. (Reference Villanueva, Sawalha, Roughsedge, Rius-Vilarassa and Woolliams2010) to deduce Ne in breeds lacking pedigree records. The approach in the present study is, in contrast, purely empirical.
Many reports now exist of Ne of livestock breeds, though there is a strong bias towards species and breeds of the developed world. There have been relatively few studies giving direct comparisons, within specific breeds, of genealogy- and LD-based estimates of Ne (but see, e.g. Flury et al., Reference Flury, Tapio, Sonstegard, Drögemüller, Leeb, Simianer, Hanotte and Rieder2010; Rodriguez-Ramilo et al., Reference Rodriguez-Ramilo, Fernández, Toro, Hernández and Villanueva2014; Bohmanova et al., Reference Bohmanova, Sargolzaei and Schenkel2015 with cattle; Hasler et al., Reference Hasler, Flury, Menet, Haase, Leeb, Simianer, Poncet and Rieder2011, horses; Saura et al., Reference Saura, Tenesa, Woolliams, Fernández and Villanueva2015, pigs). Although some studies show a close convergence, in others there are large disparities.
Monitoring biodiversity could draw funding away from practical conservation activity (Jones et al., Reference Jones, Collen, Atkinson, Baxter, Bubb, Illian, Katzner, Keane, Loh, McDonald-Madden, Nicholson, Pereira, Possingham, Pullin, Rodrigues, Ruiz-Gutierrez, Sommerville and Milner-Gulland2010), so methods for estimating Ne from available data would be very welcome. At their most basic, such data would be the census numbers (N c ) of breeds. The ratio Ne /N c is of interest in floral and faunal biodiversity where, in 27 wild non-human mammals (from Table 1 of Frankham, Reference Frankham1995; also see Palstra and Fraser, Reference Palstra and Fraser2012) the median ratio Ne /N c is 0.43 (range 0.83 to 0.069, n=31 studies). This ratio needs to be calculated for farmed animals.
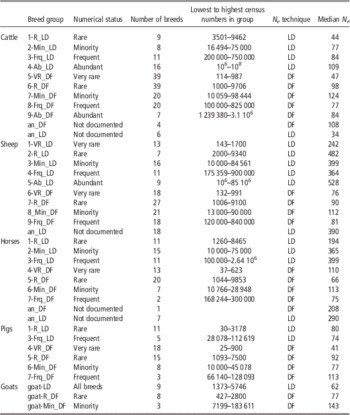
Comparisons, among breed groups, of median N e (DF), calculated from genealogical analysis, and N e (LD), from linkage disequilibrium of single-nucleotide polymorphisms
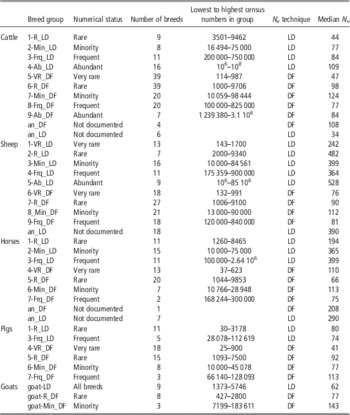
Breed groups are defined in terms of numerical status.
The principal concern of this paper is to consider whether Ne for cattle, sheep, horse, pig and goat breeds can be inferred from basic census statistics, such as those recorded in the FAO database. The approach was to calculate regressions of Ne (DF) and Ne (LD) as the y-variable, on N c as the x-variable. Should such relationships exist this could help to identify breeds that are candidates for further investigation and perhaps conservation action. Prospects were also investigated of widening the applicability of the Hill equation.
Material and methods
Published and unpublished reports numbering 184 in total (Supplementary Tables S1 to S6) were collated on Ne of cattle, horse, sheep, pig and goat breeds. In several cases the same breed had been studied in more than one country, and each country population was treated as a separate breed. Numbers of animals in each breed (N c , and in some cases estimates of breeding males and females) were obtained principally from the FAO database. These are also presented in the Supplementary Tables. Quality checks for census data were not possible. Most data were from European, and north and south American, breeds. Only molecular studies on LD were employed and they all used 50 or 60 K SNP chip technology. Studies reporting Ne (DF) used bespoke software or other packages. Eight British sheep breeds whose Ne had been deduced by predictive equations (Villanueva et al., Reference Villanueva, Sawalha, Roughsedge, Rius-Vilarassa and Woolliams2010) were included in the Ne (DF) data set. Total numbers of breeds of each species for which Ne (DF) were known were as follows; cattle 130, sheep 85, horse 51, pig 44 and goat 11. Corresponding figures for Ne (LD) were 60, 74, 44, 16 and 9. Too few breeds had been analysed by both Ne (LD) and Ne (DF) methods for direct comparisons to be made.
Descriptive statistics on N c were analysed conservatively because of uncertainties in the census data. It was not practicable to take into account the differences between, and within, methodologies in the time periods over which Ne is calculated; these vary considerably. For each species, the correlations (Pearson) were calculated between meaningful pairs of the following variables; Ne (Wright) and its log10 transformation, Ne (LD), Ne (DF) and log10(N c ). Regressions were calculated for instances where n>10 and the correlation was significant (P<0.05). Regressions of effective population size on log10(N c ) had intercept terms and were recalculated with a linear model whereby the intercept was set as zero.
The possibility was also investigated of Hill’s formula being modifiable by replacement of the generation length, variance and covariance terms by species- rather than breed-specific coefficients, in order to avoid the necessity of calculating these statistics for each breed. Sensitivity of Hill’s equation to variation in input data was tested, as follows. For a species with litter size of one, seven input variables are required, namely numbers of sires and of dams, generation length, variances of numbers of sons and daughters per sire, its covariance, and number of sons. All other input variables can be calculated from these. The starting values of 5 for number of sons and 10 for all other variables gave Ne (Hill) of 34. Each term was doubled in succession (the others being kept constant), and Ne (Hill) calculated on each occasion.
Results
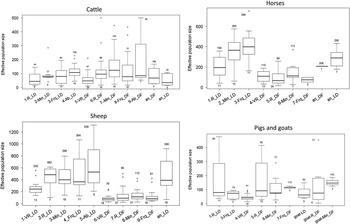
Data were assembled on Ne (DF) of a total of 321 breeds, and on Ne (LD) for 203 breeds. Matching census data were not always available so not all breeds could be used in every analysis. Ne varied widely within species and among methods (Figure 1; Table 1). Here, the species have been subdivided on the basis of N c and method of measurement. For cattle, pigs and goats, median Ne (DF) and Ne (LD) gave broadly similar results within species, whereas for sheep and horses they were markedly higher for Ne (LD). Particularly for sheep and horses, less so for cattle, and not at all for pigs and goats, Ne (LD) showed an increase with numerical strength of breeds.
Comparisons, among breed groups, of effective population sizes, as deduced by LD and DF methodologies. Breed groups are defined according to numerical status (Table 1). Medians of N e are given with 25th and 75th percentiles, range and outliers (points displaced over 1.5 times the interquartile range above/below the respective quartile). In the case of cattle, for clarity of presentation, the four highest N e values (558, 1667, 809, 2559) were excluded from this summary. Median N e (above) and number of breeds (below) are given for each plot.

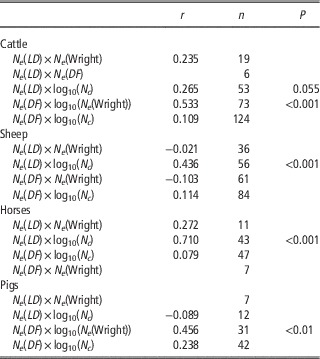
Results of the investigation of correlations (Pearson) between Ne and census measurements are summarized in Table 2, in the form of correlations among Ne (Wright), Ne (LD), Ne (DF) and log10(N c ). Preliminary investigation had shown that correlations with log10 transformations of N c and Ne (Wright) were higher than with untransformed data.
Correlations among published calculations of effective population size and census data; correlation coefficient, number of breeds and probability value for significant regressions

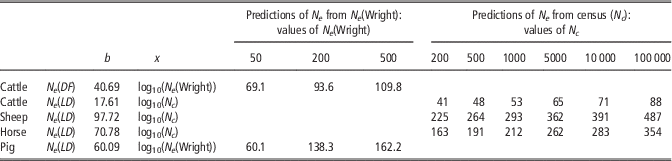
In Table 3 are given the regression equations for the significant correlations in Table 2, and corresponding scatter diagrams are in Supplementary Figures S1 to S5. With the intercept term removed, forcing the regression line through the origin, Ne values predicted from log10 Ne (Wright) and Nc are given in Table 4.
Regressions (y=a+bx) of calculated effective population size on census data

Summary of regression ANOVARs.
Regressions (y=bx) of calculated effective population size on census data, with intercept set to zero and predictions of N e from hypothetical census data

Considering the ratio Ne /N c , medians were highest for pigs (for Ne (LD) 0.088, for Ne (DF) 0.055, n=12 and 43), and lowest for cattle (0.0004, 0.010, n=53 and 124). The other species were intermediate in this respect (sheep 0.015, 0.17, n=56 and 84; horse 0.015, 0.037, n=37 and 42; goat 0.023, 0.044, n=6 and 10). Grouping Ne (LD) and Ne (DF), the mean, across all species of median Ne /N c was 0.0304 (Supplementary Table S8).
Sensitivities of Ne (Hill) to changes in generation length and the variance and covariance terms were as follows. Doubling the value of each input variable had the marginal effect of inflating the calculated Ne (Hill) from its starting value of 34 to 68 in the case of generation length, 55 (number of dams) and 36 (number of sons), and decreasing it to 32 (number of sires), to 28 for each of variances of sons/sire and daughters/sire, and to 24 for its covariance. Descriptive statistics of these variables as they have been observed in British cattle are in Supplementary Table S7. Breeds differ very widely in these attributes, by a factor of 375.2 in the case of variance of sons/sire. Variance was always greater than mean for the family size measures except for daughters/dam when they were approximately equal.
Discussion
Several methods are available for characterizing the degree to which genetic variation is being conserved in livestock breeds and the one most favoured for practical purposes is Ne . This was applied in the UK by Villanueva et al. (Reference Villanueva, Sawalha, Roughsedge, Rius-Vilarassa and Woolliams2010) as a biodiversity indicator for the UK Government. Globally such activities are rare, and indeed there is no international standard for assessment of livestock genetic variation (Martyniuk et al., Reference Martyniuk, Pilling and Scherf2010).
The present discussion extends from a descriptive account into a consideration of whether there are linear relationships such that Ne can be predicted from N c . Leroy et al. (Reference Leroy, Mary-Huard, Verrier, Danvy and Charvolin2013) found that N e(DF) was significantly influenced by species and method of estimation. In the current study, sheep and horses appear to have higher values for Ne (LD) than for N e(DF) (Figure 1) but this can only be verified by studies where both methods have been applied. Perhaps this reflects SNP chip design. Breeds classified as ‘very rare’ are absent from the available data on Ne (LD) studies of cattle, horse and pig breeds. Perhaps the rarest (and/or most accessible and amenable) breeds of these species have already been evaluated by Ne (DF) methods and repetition by Ne (LD) approaches has not been a priority.
There have been some direct comparisons of Ne (DF) and Ne (LD) methodologies. The very close matches between Ne (DF), Ne (LD) and Ne (ROH) (79.4, 74.4 and 70.0, respectively) calculated by Rodriguez-Ramilo et al. (Reference Rodriguez-Ramilo, Fernández, Toro, Hernández and Villanueva2014) for Spanish Holstein cattle may reflect the use of Holstein in designing the 50 K SNP chip that was used. Similarly, the first formal study of congruence of methodologies in pigs (Saura et al., Reference Saura, Tenesa, Woolliams, Fernández and Villanueva2015) gave Ne (LD) 20.8±3.7 and Ne (DF) 21. Some earlier studies (e.g. Flury et al., Reference Flury, Tapio, Sonstegard, Drögemüller, Leeb, Simianer, Hanotte and Rieder2010; Hasler et al., Reference Hasler, Flury, Menet, Haase, Leeb, Simianer, Poncet and Rieder2011; Uimari and Tapio, Reference Uimari and Tapio2011; with cattle, horses and pigs, respectively) presented Ne (LD) that were lower than Ne (DF) for the same breeds. However, in some studies (e.g. Herrero-Viedma et al., Reference Herrero-Viedma, Megens, Groenen, Ramis, Bosse, Perez-Enciso and Crooijmans2013) Ne (LD) have large standard errors and are also sensitive to assumptions of constant Ne (Corbin et al., Reference Corbin, Liu, Bishop and Woolliams2012). Suggesting that the assumptions of the Wright equation are sometimes met in actual populations, Harmegnies et al. (Reference Harmegnies, Farnir, Davin, Buys, Georges and Coppieters2006) found that in two commercial pig populations (each maintained at about ten boars and 250 to 300 sows) Ne (LD) agreed ‘reasonably well’ with Ne (Wright).
Leroy et al. (Reference Leroy, Mary-Huard, Verrier, Danvy and Charvolin2013) found substantial variation between breeds in Ne (DF). Extending this observation, in the present study (Figure 1 and Table 1), when breeds are grouped, comparison of boxplots suggests an increase of Ne (LD) in cattle, horses and sheep as N c increases. When groups are merged, for each species apart from goat at least one positive correlation has been found between Ne (LD) or Ne (DF) as the dependent variable, and Ne (Wright) or N c (Table 2). Recalculating the regressions with the intercept set as zero (forcing the regression line through the origin) follows Villanueva et al. (Reference Villanueva, Sawalha, Roughsedge, Rius-Vilarassa and Woolliams2010) in setting Ne of an extinct breed as zero and yields empirically derived, predictive equations (Table 4). Perhaps different regression equations would be appropriate for different groups of breeds, but further investigation would seem to be premature until more comprehensive data matching Ne estimates to breed census are available. In this connection, it is recommended that further publications on Ne calculations should state the population sizes of the breeds. The time period over which Ne is calculated should also be stated.
The potential value of these equations could be in identifying breeds whose deduced Ne depart most from expectation, as indicated by the regression line. Reasons for a positive residual value could include admixture or the operation of an inbreeding-restrictive breeding programme. A negative residual could be due to excessive inbreeding. These could be signals for further investigation.
The coefficients given in Table 4 might, with further development, be used to predict Ne for a breed for which only census data are available. For example, Welsh Mountain and Scottish Blackface sheep in the UK, with N c of 1.139 and 1.327 million ewes, respectively, in 2012 (Pollott, Reference Pollott2016), would be predicted to have Ne (LD) of 592 and 598, respectively. However, for sheep the relationship is less satisfactory at lower values of N c . It is suggested that a more reliable set of coefficients or regression equations could be produced, each specific to a certain class of breeds.
The present study indicates a general Ne /N c ratio for livestock species collectively to be 0.098, with sizeable differences among species, which are presumably due to differences in breed structure, prevalence of artificial insemination and choice of breeds for study. There is a very wide range of Ne /N c . Species medians ranged from 0.0004 (cattle) to 0.0878 (pigs), these extreme values are both derived from Ne (LD). Other than goat, all species include instances of the ratio exceeding 1, which is indicative of family size variance being minimized. Median values are between 0.01 and 0.09 (overall, 0.0304) except for the cattle breeds for which Ne (LD) was calculated (0.0004). These values are in sharp contrast to those found in floral and faunal biodiversity, whereas values of 1 are not reported in the wild mammal data presented by Frankham (Reference Frankham1995).
Leroy et al. (Reference Leroy, Mary-Huard, Verrier, Danvy and Charvolin2013) found significant correlations between Ne (Hill), and Ne (DF) and Ne (Wright) in relatively small data sets of French cattle, sheep and horses. Ne (Hill) has also been found to track other measures of Ne over time (Toro et al., Reference Toro, Meuwissen, Fernández, Shaat and Mäki-Tanila2011). Previous work on Hill’s equation (figures 13 and 14 of Hall, Reference Hall2013), showed that when Ne (Hill) for a breed is compared with Ne (Wright) in the same breed they can be similar where conservation is being practised, but the former is subsequently less than the latter in numerically stronger breeds where genetic conservation is not a priority.
If the variables needed for Hill’s equation could be easily obtained, these comparisons would be feasible, but the present study suggests the variance terms (to which the equation is very sensitive) vary widely among breeds (Supplementary Table S7; also see Hall, Reference Hall2013). Also, general reviews of variances of livestock family size are rare (Garrido et al., Reference Garrido, Birchmeier, Munilla and Cantet2008). Prospects therefore seem poor for simplifying Hill’s equation by replacing variables by coefficients or by consensus values.
Molecular assessments of Ne (LD) clearly have much to offer the management and conservation of livestock genetic diversity but there may be problems with implementation. Judging by the long lists of authors involved in most publications a wide-ranging, inter-institutional skill set is needed for LD detection, analysis and interpretation. This, the costs of genotyping, and the disappointing track record of molecular methods generally in guiding breed conservation (Bruford et al., Reference Bruford, Ginja, Hoffmann, Joost, Orozco-terWengel, Alberto, Amaral, Barbato, Biscarini, Colli, Costa, Curik, Duruz, Ferenčaković, Fischer, Fitak, Groeneveld, Hall, Hanotte, Hassan, Helsen, Iacolina, Kantanen, Leempoel, Lenstra, Ajmone-Marsan, Masembe, Megens, Miele, Neuditschko, Nicolazzi, Pompanon, Roosen, Sevane, Smetko, Štambuk, Streeter, Stucki, Supakorn, Telo da Gama, Tixier-Boichard, Wegmann and Zhan2015) argue for development of a method that can be used by non-specialists, that is dependent only on spreadsheet-type software.
If maintenance of genetic variation is to be audited an economical, cost-effective, transparent and verifiable method of doing so would be necessary. A central authority could calculate Ne for each breed on the basis of publicly available census data, or breed societies could be advised how to do it. Results could be compared with what would be expected, or what has applied in the past and is required in the future. Rapid increase of Ne might represent successful conservation or could indicate admixture and might be equally indicative of a need for further study as a rapid decline. Analysis of Ne enables conservation activity to be monitored and audited and can identify breeds that need support. The support itself can be designed following Woolliams and Toro (Reference Woolliams and Toro2007), as placed in a broader context by Food and Agricultural Organization of the United Nations (1998) and Hall (Reference Hall2013).
Acknowledgements
L. Andersson, J. Hovermale, W. R. Lamberson, T. C. Lane, J. Levy, M. Reekie and T. Zakowsky kindly provided breed census information. The work is a development of project GC0146 (funded by Department of Food and Rural Affairs, UK) and the encouragement and support of Bill Lyons is gratefully acknowledged.
Supplementary Material
To view supplementary material for this article, please visit http://dx.doi.org/10.1017/S1751731116000914