


I
The nineteenth century saw a variety of approaches towards mutual worker insurance. On the one hand, there were funds with voluntary membership: the friendly societies in Great Britain and elsewhere (Van der Linden Reference Van der Linden1996; Broten Reference Broten2010); the fraternal lodges in the US and Canada (Emery Reference Emery1996 and 2006; Emery and Emery Reference Emery and Emery1999); and the non-fraternal industrial sickness funds in the US (Murray Reference Murray2007) are examples. On the other hand, English pit clubs (Benson Reference Benson2002) and US labour union funds (Murray Reference Murray2007) are examples of schemes with compulsory membership. All these funds insured their members primarily against the economic consequences of illness, but – as the pit clubs did – also against accidents. Beyond that, it seems as if those funds' histories have two important aspects in common: first, their design, development and potential financial weaknesses compared to commercial or government-based solutions were the subject of – sometimes intense – debate at the time; and second, contrary to the usual assessment that they were rather weak financially, recent empirical research indicates that their operations were financially sound. This finding is striking because they did not use actuarial technology, as commercial insurers had begun to do, and seem not to have been engaged in forming large pools of insurants in order to exploit economies of scale. If the mutual sickness funds' importance declined over time, this was not, indeed, because of financial failure, but because of comparative actuarial advantage of commercial insurers, as in the case of US industrial sickness funds (Murray Reference Murray2007, pp. 218–36), or because of changing members' preferences, as in the case of US fraternal sickness insurers (Emery Reference Emery2006, pp. 480–1).Footnote 2
Against this background, the goal of this article is to complement the existing literature on the financial operations of nineteenth-century worker insurance schemes by focusing on a quite neglected piece of German mutual insurance history – namely, the miners' social insurance funds called Knappschaften (or KVs).Footnote 3 Addressing the period from 1867 to 1913, I aim to answer the following research question: what does the KVs' experience running an insurance scheme tell us about the importance of the scale of risk pooling for minimising actuarial risk?
The German miners' funds were converted from charitable organisations into insurance funds during the Prussian mining reform of 1851–65. Thus, several scholars have recently identified these funds as pioneers of Bismarckian-style social insurance, not least because they adopted compulsory membership as early as the late Middle Ages (Tampke Reference Tampke, Mommsen and Mock1981; Geyer Reference Geyer and Tenfelde1992; Wagner-Braun Reference Wagner-Braun2002, pp. 32–3). The KVs were different in some important respects from friendly societies and other funds. First, miners were obligated to join the local KV that was in charge of the area in which their workplace was situated; hence, adverse selection as a basic insurance problem did not play a role (unless it was a matter of choice of profession). Second, the benefit package that the KVs were obligated by law to provide was, at least, qualitatively more extensive in that it combined daily sick pay, medical treatment and funeral benefits with lifetime invalidity and survivorship pensions. Third, contemporary observers of the KVs seem to have focused on whether financial stability could be improved by exploiting economies of scale, rather than by improving the pricing techniques themselves. It is this third aspect from which the research question is essentially derived.
Contemporaries identified a major ‘design flaw’ in the combination of (i) a high fragmentation of the KVs' insurance scheme in terms of their number; (ii) a very unequal, left-hand-skewed size distribution (many small and few large funds); and (iii) the bundling of health and pension insurance in one scheme. Bundling, maintained until 1906, plagued observers because they believed that sickness funds had to stay small to minimise excess costs due to moral hazard, while pension funds had to be large to minimise excess costs due to high risk loadings of premiums. The discussion centered on the question of whether larger pools of mineworkers were not superior – and, thus, more desirable – to smaller pools because large KVs, and the growth process leading to them, would smooth the variability of average pension costs and improve the predictability of future costs and money needs. Guinnane and Streb's (Reference Guinnane and Streb2011) recent findings on the relationship between size and moral hazard in the KVs' sickness insurance lead to the conclusion that large funds would have also helped to reduce the variability of average health costs; they find that small KVs did not perform significantly better than large ones in controlling for simulation. It seems as if contemporaries favoured larger fund sizes since they demanded larger organisations more consistently than smaller ones. Small KVs, the argument went, should merge with each other or be merged with existing larger funds. Indeed, the KVs' history since the middle of the 1850s is essentially one of absolute and relative concentration, where some funds benefited from good growth conditions, while others were subject to long-term stagnation or even shrinkage.
This study extends our knowledge of factors likely to have driven the concentration process among KVs by investigating: (1) whether there really were economies of scale concerning the exposure to actuarial risk, as contemporaries assumed and standard insurance theory suggests; and (2) whether the observable concentration process – as a form of institutional change – can, therefore, be labelled ‘necessary’ and ‘successful’ in retrospect. Answering the research question and exploring broader implications require an empirical test of the relationship between KV size and exposure to actuarial risk – as if the sickness and pension sections were unbundled. In the following, I measure exposure to actuarial risk by the variance of the average claims costs that one contributing miner had to finance with his premium. In this context, a KV is assumed to be notably exposed to actuarial risk if the variance is comparatively large.
Empirical evidence suggests that actuarial risk was minimised at around 5,000 contributors in a KV's pension insurance section and at about 1,000 contributors in its sickness insurance section. Although the contemporary observers of the KVs, including the regulator, never quantified what the optimal scale for such an insurance fund was in their opinion, they seem to have favoured the formula: the larger the better. This is also what the standard insurance economics theory implies. Not focusing on actuarial risk, but on economies of scale with respect to the administrative overheads of modern German sickness funds, the findings of Mühlenkamp (Reference Mühlenkamp1995), for example, suggest an optimal size of local sickness funds (Ortskrankenkassen) of between 80,000 and 130,000 members. Furthermore, regarding modern Dutch pension funds, Bikker and de Dreu (Reference Bikker and de Dreu2009) find evidence for an optimal size of around 50,000 members. Against this background, historical data on KVs suggest far smaller efficient scales of pooling than were advocated at the time and may be advocated today.
To form a basis for the empirical investigation, Section II provides some institutional background information and, in particular, clarifies what the typical insurance contract was like. There, as in subsequent sections, I concentrate entirely on the Prussian KVs. The reason for this choice is simple. Prussia was the core mining region in Germany at the time, and the Prussian funds were the best-documented ones there. The latter fact enables me to make use of a newly constructed data set drawing upon the Prussian Knappschaft statistics published since 1854, containing membership, revenue and expenditure information on all 103 Prussian KVs operating within the observation period. Section III presents the historical discussion on perceived room for actuarial improvements. Section IV introduces the concept of actuarial risk and empirical models to explain the KVs' costs, to derive ex post predictions and to check for economies (or diseconomies) of scale regarding that risk. Section V includes the empirics and discusses the broader implications. Section VI concludes the article.
II
Social security mutualism in German mining, based on mineworkers' compulsory membership and payments and the financial co-sponsorship of mine owners, has a long tradition. The first formations of brotherhoods among miners, which were dedicated to religious observance and charity in the event of breadwinners' income loss, date back to the Middle Ages and the year 1260 (Lauf Reference Lauf2004).Footnote 4 The emerging absolutist-mercantilist regime substituted mutualism by the sovereign's patronage and put mineral extraction under full state control. The reform of Prussian mining legislation towards a more liberal economic order between 1851 and 1865, which is the starting point of this article, defined the beginning of the KVs' insurance era.
The KVs were subject to government regulations that gave them their general institutional form, but also left room for manoeuvre. Their legal basis for the first 40 years was provided by the path-breaking Knappschaft law (Knappschaftsgesetz) of 1854 (Friedrich Wilhelm IV. Reference Friedrich1855) and the Prussian general mining law (Allgemeines Berggesetz für die preussischen Staaten) of 1865 (Klostermann Reference Klostermann1866), through which the miners' benefit scheme, formerly run by the royal administration, was converted into workplace-based social insurance.Footnote 5 According to Tenfelde (Reference Tenfelde and Bundesknappschaft2004, p. 25), miners were now legally entitled to benefits that were broadly equivalent to their mandatory payments. In 1906 and 1912, two amending laws were enacted. The former can be seen as a direct consequence of the ongoing discussion of organisational failures and related solutions (Bertrams Reference Bertrams1912); this regulation will be addressed below, as will the basic regulations of 1854 and 1865. The latter was intended to adjust the KVs' scheme to the Reichsversicherungsordnung of 1911 (Reich insurance regulation) that brought about the introduction of white-collar and survivorship insurance on the national level (Gottschalk Reference Gottschalk1912); this regulation will not be addressed below because KVs had already pioneered survivorship insurance and because this article focuses entirely on the workers' (i.e. blue-collar) insurance. The law of 1911, however, was not the first Reich law that required adjustments on the KVs' side. Actually, the introduction of Bismarckian social insurance through the health insurance law of 1883, the accident insurance law of 1884, and the disability and old-age insurance law of 1889 influenced the way KVs operated – precisely how is also addressed below.
Referring to the aforementioned regulations, the following paragraphs answer two interrelated questions before the actuarial risk discussion is assessed empirically: (1) how did the KVs work, and (2) what was the typical KV insurance contract like? Once again, it is important to note that membership in KVs was compulsory for all mineworkers, but also for those steel- and metalworkers whose companies (i) existed before 1865, (ii) had already installed their KVs, and (iii) had decided to continue their membership in Knappschaft insurance beyond 1865. Meanwhile, since 1861, steel- and metalworkers had no longer been supervised by the mining administration, which had given them access to Knappschaft insurance, but by the Gewerbeaufsicht (trade control), which deprived them of access to KV coverage. While the Prussian KVs' coverage, in terms of economically active population (EAP), rose from about 1 to 4 per cent between 1861 and 1918, the coverage of Bismarckian health insurance, for example, rose from about 21 per cent after implementation in 1883 to 44 per cent in 1913. What is more, Bismarckian invalidity insurance initially covered about 49 per cent of the EAP. This measure of coverage includes the KVs' male membership over the age of 16. If we consider the entire membership, consisting also of widows and orphans below age 15, the appropriate reference quantity seems to be the German population as a whole. All Prussian KVs together accounted for about 0.67 per cent of the German population in 1871 and 1.44 per cent in 1913 (Rothenbacher Reference Rothenbacher2002, pp. 288–90; Khoudour-Castéras Reference Khoudour-Castéras2008, pp. 234–7; Jopp Reference Jopp2010a).
Beyond that, two basic types of KVs have to be distinguished from each other. One is quite similar to what Murray (Reference Murray2007, p. 98) calls establishment funds. I call them firm-related KVs (Werksknappschaften). Their pools of insurants were, on average, much smaller than those of the other type, the area-related KVs (Bezirksknappschaften). A KV area was, by and large, equal to a mining area (Bergbaurevier), which could have been quite small or even quite large and could have exhibited different resource deposits (hard coal, brown coal, iron ore, miscellaneous ores, salt and stone). In its area, a KV was the exclusive supplier of insurance, meaning that another KV could not have had a subsidiary in its area. It is straightforward to identify the size of the area or the company as the principal limiting factor to growth and stagnation or, alternatively, finances and actuarial underpinnings. As Table 1 shows for selected years, the average KV's membership rose from 2,434 members (384 of them pensioners) in 1867 to 15,559 (3,457 of them pensioners). Despite the highly skewed distribution towards small KV sizes, indicated by the mean-median difference, the average KV was much larger than many of its prominent voluntary counterparts.
A quantitative overview of the average Prussian Knappschaft's characteristics, selected years

Note: Until 1906 (statistically until 1907), pensions and sickness benefits were bundled. With the reform, a KV's pension and sickness sections were formally separated. All values in 1913 that do not explicitly relate to the sickness insurance section, relate to the pension insurance section only. Monetary figures are in current prices.
Source: Ministerium für Handel und Gewerbe (1862–1922), Statistik der Knappschaftsvereine des preussischen Staates, in Zeitschrift für das Berg-, Hütten- und Salinenwesen im preussischen Staate, 10–70.
Now, how did the KVs work? First of all, each KV offered its local or regional membership a legally predetermined bundle of insurance benefits that could not be purchased separately. KVs had to insure against income losses due to temporary sickness, permanent invalidity, and survivorship of a miner's wife and children. Because an invalidity pension was guaranteed until the recipient's death – likewise for a widow's pension, as long as she did not remarry – it is reasonable to view KVs as old-age insurers, insuring against the risk of longevity, too. Medical treatment, as an in-kind benefit, and funeral costs were also part of the obligatory package. Beyond these required benefits, each KV could decide on its own about offering further benefits. These often included needs-tested support and financing for the schooling of the miners' children; some contemporaries even tell of KVs offering loans for house building. However, the five most-costly benefit categories were the three types of pensions, the daily sick pay, and the medical benefits, including physicians' care, medicine and cures.
Table 1 also indicates the average KV's expenditures. The data generally draw a picture of expansion and highlight the weight of those five benefit categories – a picture that is true not only for the average KV shown in the table, but, in fact, for all KVs. With regard to sources of revenue, the regulations mentioned only premiums (or, as I call them, contributions). Those were to be paid by the mineworkers themselves and their employers. Until 1906, the employers' portion of a contribution was not to fall below one-third. After 1906, when the pension and sickness insurance benefits were institutionally separated from each other – meaning that each had its own sources of revenues and assets – the miners' and employers' portion of a contribution had to be equal. To understand the data presented, it is important to note that the institutional separation is apparent in the statistics only after 1908; hence, KV operations in 1907 were reported as if bundling still existed. KVs were free to explore other sources of revenues (e.g. entrance fees, punishment fees, marriage fees, interest on assets). However, KVs operated independently of each other and the state, which means that they were not connected by risk structure or financial structure compensation mechanisms, and they did not receive state subsidies at any time.
Table 1 also illustrates the revenue side, which generally depended on contributions accounting for, on average, between 80 and 90 per cent of aggregate revenues. However, what the table does not show is that the percentage share of interest income in all revenues – which rose from about 5.5 to 12 per cent for the average KV – tended to be higher for small KVs. Furthermore, to assess the magnitude of the average contribution – initially 26 marks and later 89 marks – note that the average annual net wage in German mining was 698 marks in 1867, 1,356 marks in 1907 and 1,496 marks in 1913 (Hoffmann Reference Hoffmann1965, p. 461). This yields average contribution rates of 3.7, 7.0 and 5.9 per cent, respectively. This was much more than US industrial sickness funds, for example, and German Bismarckian sickness or invalidity insurance charged (Murray Reference Murray2007, p. 113).
Above, I mentioned that the regulations left room for manoeuvre. This is particulary the case with three issues: (1) the extension of the benefit package with non-prescribed benefits; (2) the exploration of other revenue sources; and (3) the determination of monetary benefit levels or, respectively, calculation principles (including decisions on waiting periods, on eligibility criteria, and on whether contributions and benefits should be scaled somehow). In other words, the basic regulations did not say a word on absolute generosity or what the income replacement standard of the various benefits should be; a KV was free to set its invalidity pension at a relatively low average level of, say, 50 marks or, instead, at a relatively high level of 350 marks (Friedrich Wilhelm IV. 1855). Table 1 shows that the average KV granted, at first, a mean invalidity pension of 148 marks, which more than doubled towards World War I. Widows' and orphans' pensions were usually specified as a percentage of the invalidity pension the breadwinner had earned (50–60 per cent for widows and 10–20 per cent for orphans). Using the wage data from above, the average replacement rate slightly exceeded the usual 17 to 18 per cent in Bismarckian invalidity insurance with 21.2, 18.4 and 23.4 per cent.
Decisions on how to run the KV and specify parameters was the responsibility of the KV board, which consisted of equal numbers of miners' and employers' representatives; an administrative official would have had the decisive vote if a decision had not received a majority vote. Actually, there is consensus in the literature that KV boards – hence the KVs' self-management bodies – were dominated by employers, through both their own representatives and those of the miners, who were, in fact, more loyal to their bosses than to their fellow miners (Friedrich Wilhelm IV. 1855; Tenfelde Reference Tenfelde and Bundesknappschaft2004, pp. 26–33; Lauf Reference Lauf2006, p. 272).
KVs universally combined the pay-as-you-go mechanism with some reserve-building. The working membership's contributions and miscellaneous revenues were immediately redistributed to pay out insurance benefits to the temporarily sick and the permanently disabled. As a matter of fact, most KVs began their insurance operations in 1854 with previously accumulated financial reserves. These reserves served as a buffer to compensate for deficits (actual expenditures at the end of a year > actual revenues) that might – and actually did – occur because actual costs did not meet predicted financial needs. If actual revenues exceeded actual costs at the end of a year, reserves were replenished. Table 2 depicts descriptive statistics on the KVs' financial assets and, thereby, illustrates asset structure and the magnitude of assets ready to settle unpredicted extra costs. Cash reserves and bank deposits (the latter category was introduced by 1908) made up only a minor fraction of reserves at the mean. Interest-bearing assets – or interest-bearing ‘papers’, as this item became known in 1908 – accounted for the highest percentage. What is called miscellaneous assets comprises different sorts of items, namely immovable property, movables, interest-free claims and outstandings. Note that these items were not always reported by all KVs; many, for example, did not report immovable property. Starting in 1908, the KV statistics also reported deposits in the reinsurance fund. This fund, the Knappschaftliche Rückversicherungsanstalt Charlottenburg a. G, which was created in 1907, was based on voluntary membership and was intended to back a larger amount of pension liabilities. Not every KV joined the fund. A KV was free to specify the scale of the reinsurance premium on its own and to liquify its deposit immediately if it was needed to settle extra costs. As a consequence of joining the Rückversicherungsanstalt, KVs seem to have raised the mineworkers' required contributions in order to finance the reinsurance premium (Milde Reference Milde1907, pp. 124–9; Lauf Reference Lauf2006, p. 276).
Descriptive statistics of the Prussian Knappschaften's assets (in marks)

Note: Miscellaneous assets include immovable property, movables, interest-free claims and outstandings. Figures are in current prices.
Source: See Table 1.
Contemporaries expressed their worries about the financial reserves' inadequacy to cover implicit liabilities from pensions, which were the actual pensioners' future pensions and the actual working membership's accumulated entitlements on future pensions. However, they did not complain much about an inadequacy of reserves to compensate for extra costs in a given year (Jopp Reference Jopp2011b). Data indeed show that reserves were, in most cases, sufficiently large to cover the deficits that occurred. This holds, of course, under the assumption that interest-bearing assets (papers) were especially easy to liquify at all times. If reserves were not sufficient, KVs were in the position to increase contributions immediately, perhaps request a loan from the mine owners, or borrow against assets not immediately liquifiable; regarding the latter two alternatives, however, we do not have sufficient evidence, which makes them only speculation.
We now know how the KVs worked. The second question is: What was the typical KV insurance contract like? Until 1906, KVs charged each working member one ‘composite’ contribution (usually weekly) covering all the insurance risks at once; as of 1906, however, two separate contributions were collected, one for pension coverage and one for sickness benefits. In contrast to, for example, the Odd Fellows, the KVs did usually not price the entire membership equally by using an age- and other factor-independent flat-rate payment. In KVs, in exchange for promised insurance benefits, contributions were not scaled to age in a biological sense, but, instead, to the miner's length of service. A miner employed and insured for 20 years had to pay more than a miner just having worked a mere five years in the mining sector. In addition, it was also scaled according to occupational classes, which was, in fact, equal to scaling according to wage. Given the same length of service, a hewer underground – the worker who earned most – had to pay more than an assistant worker at the surface, whose wage was lower. Actually, a KV could have chosen any combination of numbers of classes regarding the mineworkers' characteristics. Usually, the contribution per class was a flat rate rather than a percentage of labour income. In particular, evidence suggests that KVs did not scale, for example, joining fees to the age at joining the KV, as the Odd Fellows did (Friedrich Wilhelm IV. 1855; Bertrams Reference Bertrams1912; Emery and Emery Reference Emery and Emery1999, p. 87). Hence, contrary to the Odd Fellows and Friendly Societies, the KVs' pricing techniques seem to have been somewhere in the middle between non-actuarial pricing and commercial insurers' technology. Not only contributions, but also pensions and sick pay were scaled to length of service and, perhaps, income. Regarding sick pay, a replacement rate of 50 per cent of daily shift earnings was targeted (Lauf Reference Lauf2006, pp. 277–81). Again using Hoffmann's wage data, the income replacement per day empirically was roughly between one-third and 39 per cent in 1867 and 1907 and about 52 per cent in 1913.
In the miners' compulsory system, every risk, in the sense of an individual insurant, had to be insured by a KV as long as the miner was employed within the KV's area and no company-related KV was responsible for him. It follows that the KVs were not subject to one of the major economic problems associated with insurance, namely adverse selection. However, in order to be able to shape, to a limited extent, the membership's risk structure, KVs discriminated between established and unestablished miners. The latter category had developed to capture day-labourers who were not permanently employed as miners. Those unestablished miners did not gain full access to benefits and were usually said to receive less insurance benefits per unit of contribution than the established miners. To achieve the status of an established insurant, a miner usually had to be between ages 20 and 45, had to be of good certified health, had to have undergone a waiting period of some years, and had to be of moral integrity. As Murray (Reference Murray2007) tells us, the industrial sickness funds in the US had similar criteria for joining (Bertrams Reference Bertrams1912, p. 1459; Murray Reference Murray2007, pp. 99–100). Illness or invalidity had to be certified by the KV physician. KVs, moreover, often had waiting periods of some days before giving sick pay (beginning in 1883, the waiting period was uniformally three days) or some years before granting an invalidity pension (Guinnane and Streb Reference Guinnane and Streb2011, pp. 74–5).
Finally, workmen's insurance in the form of sickness, accident, invalidity and old-age benefits was introduced at the Reich level between 1883 and 1889. However, KVs were obviously neither abolished nor turned into organisations with voluntary membership. Instead, mineworkers were insured in both compulsory systems simultaneously. Crossover membership meant that the true per capita burden with contributions to the mixed social insurance system was higher for active miners than for those workers who had access only to Reich insurance. But it also meant that miners received more benefits. The same holds for mine owners, especially because they exclusively financed the employers' liability insurance organisation for the mining sector, one of the many carriers of Bismarckian accident insurance. Did the presence of Bismarckian insurance directly influence KV operations? Regarding monetary benefit levels, it did. The health insurance law (1883) required KVs to raise their sick-pay benefit to the monetary standard of factory sickness funds (Betriebskrankenkassen), which was apparently higher. Accident insurance (1884) and invalidity and old-age insurance (1889) provided Reich pensions, against which KV pensions could be counted in some way. This means that KV pensions and contributions could have been – but were not necessarily – lowered (Lauf Reference Lauf2006). Beyond Bismarckian insurance, crossover membership of KVs with other insurance institutions cannot be excluded, but there are no explicit hints in the contemporary KV literature on that issue.
III
The KVs' operations were a highly debated topic in the nineteenth and early twentieth centuries – as were the friendly societies', fraternal lodges' and industrial sickness funds' operations. In contrast to those schemes, the size of a KV's pool of insurants was at the centre of that historical discussion. Before illustrating the core arguments, some stylised facts about the number of funds and KV size are in order. Here, as in the econometric analysis below, the main measure of KV size is the number of contributing miners. This measure is appropriate to highlight the true financing power on which a KV actually relied. Referring to Table 3, 85 Prussian KVs were in operation in 1867. The number peaked in 1870/71 with 91 and then decreased to 70 in 1907 and 62 in 1913; the number decreased even further, to 44 in 1920, shortly before all remaining German KVs were merged into the newly founded Reichsknappschaft in 1923. At the same time, the number of insurants as a whole – that is, contributors and pensioners together – increased from 206,965 (1867) to 964,749 (1913).Footnote 6 These observations imply that the average KV must have grown larger and larger, a trend confirmed by Table 1. The table also highlights the fact that the annual KV size distribution for the three years depicted was highly skewed to the left (median < mean). This implies that there were many small KVs and few large ones and, hence, that the size differentials were quite extreme. The smallest KVs had no more than ten contributors, while the largest could have had well beyond 80,000 or 100,000 contributors; the largest KV had more than 200,000 contributors after 1898 and 346,000 by 1913. The feature that some KVs grew large(r) while a considerable fraction remained rather small is consistent for the period under consideration. Table 3 highlights this fact by displaying the absolute and relative frequency of KV size. To be precise, 30 per cent of KVs never exceeded 499 contributors. What is more, the first three classes, from one to 4,999 contributors, always accounted for more than 70 per cent of KVs.
Absolute and relative frequency of Knappschaft size in Prussia, selected years

Note: KV size is measured in terms of contributing miners.
Source: See Table 1.
The observable concentration process at the time is framed in the context of arguments in favour of large pension funds and small sickness funds on the one hand, and on the weakness of the pay-as-you-go method on the other hand. Pay-as-you-go financing was actually perceived to be inferior to the funding technology commercial life insurers used at the time. In this article, I concentrate on the part of the contemporary discussion that centres around KV size. Regarding the latter, the reader is referred to Jopp (Reference Jopp2011b).
The major claim in the discussion had been that small funds were actuarially unviable regarding pension finance because of their inappropriate size, and that the funds' performance would considerably improve alongside a growing collective of insurants. The favoured formula was simple: the larger the better. This is, for example, in line with the statement of mining official Julius Hiltrop from 1869, a few years after the enactment of the basic regulations: ‘Of greatest importance for a KV's usefulness and efficiency, however, is its size. The more members a KV has . . . the more solid will it become in view of granting benefits and overcoming challenges.’Footnote 7
Harry Karwehl (Reference Karwehl1907), another contemporary, illustrates why small KVs were considered inappropriate to deal with the challenges of insuring miners:
A small Knappschaft fund is much too sensitive to particular events occurring at the mine or the few mines belonging to it. Such events may be: firedamp, coal-dust explosion, pit fires, man-shaft accidents, epidemics, but also the depletion of the resource deposit or other technical or economic obstacles to operating a mine. Of these events, massive accidents drive up claims costs extraordinarily and might also result in decreasing payments of contributions.Footnote 8
The importance of large KVs was deduced from the law of large numbers (Caron Reference Caron1882, pp. 20–1; Karwehl Reference Karwehl1907, pp. 61–2). In its empirical formulation, the law says that, with more observations available, the relative frequency of an event approaches its true, but unknown, probability of occurrence (Albrecht Reference Albrecht1982, pp. 504–7).Footnote 9 Contemporaries believed that the law's impact would help to stabilise the KVs' pension benefit scheme by reducing the variability and, thus, the negative financial consequences of the events mentioned by Karwehl. By reducing the variability of average claims costs in the end, the predictability of aggregate claims costs was considered improved. This consideration, of course, matches with standard insurance theory, not least because the law of large numbers implies that the variance of the average claim tends towards zero over time if the size of the pool of insurants increases (Hiltrop Reference Hiltrop1869, pp. 223–6; Caron Reference Caron1882, pp. 20–1; Karwehl Reference Karwehl1907; pp. 61–2; Jopp Reference Jopp and Bartels2010b).
Caron (Reference Caron1882), in particular, combines the implications of the law of large numbers with pricing by considering the implicit degree of risk loading as an important component of a premium – besides the expected value of costs and the administrative overhead loading. He establishes a relationship between the degree of risk loading and a KV's size:
The first fundamental condition for a restructuring of Knappschaft insurance would be to form large Knappschaft areas to bring into effect the law of large numbers. We would best achieve this by merging all Prussian Knappschaften into one pension fund. . . It has to be emphasised that the surcharge on top of the net payment of contributions to even out fluctuations has to be the larger, the smaller the collective of insurants is.Footnote 10
Emery and Emery (Reference Emery and Emery1999, p. 81) and Broten (Reference Broten2010, pp. 35–40) recently estimated the implicit degree of risk loading for US fraternal lodges and English friendly societies and concluded that both types of voluntary organisation charged quite risk-adequate premiums. The obvious implication of Caron's consideration is, again, in line with standard insurance theory saying that the reduction in the variance of average costs is the necessary precondition for an insurer to lower the risk surcharge. In a competitive environment, an insurer would very probably do so, and the premium would develop towards an actuarially fair one, which is roughly equal to expected individual costs.
The claim that a KV had to be rather large – or, put differently, had to be not too small – reflects the contemporaries' perception of pension finance. As mentioned above, contemporaries had a different opinion concerning the financing of sickness benefits, especially sick pay. Hiltrop (Reference Hiltrop1869) puts it like this: ‘The basic evil rather is the preposterous fusion of health and pension insurance; a KV's size too large for it as provider of health insurance and too small for it as provider of pension insurance.’Footnote 11
The widespread opinion was that the optimal size of a KV – or to use a modern term: its minimum efficient size (Eisen Reference Eisen1991, pp. 270–1) – was different for both insurance types. Even if contemporary opinion suggested the formal unbundling of sickness and pension insurance, this was not done before 1906. The basic regulation of 1865 actually gave KVs the opportunity to split their membership into extra sickness funds per mine or steelworks while keeping one large pension fund; only a few KVs took the opportunity (Guinnane and Streb Reference Guinnane and Streb2011, p. 74). The general argument in favour of small sickness funds referred to moral hazard and, specifically, to malingering or ‘simulation’. The generosity of the sick pay benefit was assumed to have provided insurants with a strong incentive to malinger. Quite in line with the economic theory of interest groups, small funds, where everyone knew each other and had close personal ties to fellow workers, were said to help control costs and monitor the behaviour of mineworkers better than large, more impersonal funds. Social sanction for abusing the funds, or simply the threat of it, was seen as an efficient disciplinary means. Recently, Guinnane and Streb (Reference Guinnane and Streb2011) tested the claims that moral hazard existed in the KVs' sickness insurance and was considerably less of a problem for small KVs. Their findings suggest that moral hazard was relevant, but no less so in small KVs than in larger ones.
Contemporaries identified the unbundling of the sickness and pension insurance benefits as a necessary precondition to implement the optimal KV size for both types of coverage, though this size was never specified in quantitative terms. Since most KVs refused to split their memberships into several sickness funds per mine while keeping one single pension fund, contemporaries presumably realised that it makes no sense to sell both the advantages of small KVs and the advantages of large KVs simultaneously. Instead, they seem to have focused more extensively on advocating large KVs – which was equal, in fact, to prioritising pension insurance. Advocating large funds and, thus, the advantages for pension insurance obviously took priority. Mergers, in particular, were underlined as a means to release small KVs from financial pressure due to high variability and to help larger KVs increase their size immediately. However, one needs to know that the mining administration indeed exerted some verbal pressure in favour of larger pools of insurants, but did not force mergers or liquidations upon KVs until the revised regulations of 1906. The ministerial decree of 1883, for example, which explained the implications of the Reich health insurance law for the KVs' operations, reads:
It has been repeatedly stressed that the fusion of small KVs among themselves or with larger KVs is the appropriate means to improve their efficiency. . . Some mergers were indeed conducted in the recent past, but not to a desirable extent. It must be emphasised from now on that mergers should be conducted all over, where circumstances demand it – not only regarding the one or other small KV, but under systematic consideration of the larger KVs.Footnote 12
To summarise, contemporary observers of the KVs had developed an understanding of insurance in which the advantages and disadvantages of pool size mattered for the design and efficiency of the mineworkers' insurance scheme. They identified a kind of ‘design flaw’ in the bundling of the sickness and pension insurance benefits, which, they claimed, demanded different minimum efficient sizes of the pool; and they deduced and advocated the necessity to create large funds – if necessary, by conducting mergers. Even though contemporary observers did not use the term ‘actuarial risk’ in their discussion, they definitely addressed the substance (Bittl and Müller Reference Bittl and Müller1998). Regarding pensions, their idea had been that smaller KVs were more strongly exposed to variability in costs, which made it more difficult for them to predict costs and specify adequate contributions (see Caron's statement about the implicit degree of risk loading). Against the background of Guinnane and Streb's findings, there is no reason to conclude that variability regarding sick benefits was the smaller, the smaller the KV was. This refers to a more general issue: is there a trade-off between an actuarially fair premium and the financial stability of the whole system? Or, put differently, is there an indissoluble trade-off between what is good for the individual insurant and what is good for the collective of insurants? In my view, this trade-off indeed existed for small pools. A small KV could have overcome high variability by specifying high risk loadings; however, this would not have led to a very fair individual premium to cover just the expected costs. If, however, the relationship holds that variability automatically reduces towards zero if pool size increases, the trade-off seems to disappear for large KVs. This, in turn, would enable a large KV to collect a close-to-fair contribution from the representative mineworker, which would not contradict the financial stability aim and, at the same time, offer a given insurance coverage at close-to-minimum cost. These relationships would have to be tested empirically.
IV
At its very core, this article is about an idea that has developed into an important issue in modern insurance economics: that is, the size of an insurance pool matters for the per capita costs of producing insurance coverage. Empirical tests have recently concentrated, among other things, on the question of whether or not there is an inverse relationship between pool size and administration costs – and if yes, in what size range (Mühlenkamp Reference Mühlenkamp1995; Bikker and de Dreu Reference Bikker and de Dreu2009). An answer to this question would provide policymakers and businessmen with helpful information to decide how to shape an insurance system or how to develop the scale of one's own insurance company. As the subsequent section outlines, contemporary observers of the KVs' operations dealt with the general idea, but focused on the question of whether or not larger insurance funds were less exposed to variability in claims. They were already aware of the fact that production of insurance coverage is inevitably connected with actuarial risk, which exists simply due to the stochastic foundation of insurance.
To begin with, the applied definition of actuarial risk needs to be clarified. According to the literature, there seems not to be simply the actuarial risk of an insurer, but rather several dimensions to be addressed. At least three dimensions of actuarial risk can be distinguished. First, the ‘relative actuarial risk’ of an insurer is the risk that an insurant's actual claim size to be settled during a period exceeds the expected claim size. Second, the ‘absolute actuarial risk’ is the risk that the actual aggregate claim size of a period exceeds the expected aggregate claim size. These two dimensions obviously focus on an insurer's risk from an expenditure perspective. A third and broader concept, the probability of ruin, also internalises the revenue side. Actuarial risk might then be considered as the risk that generated revenues (plus financial reserves, if existing) do not suffice to settle all claims costs occurring in a given time interval (Zweifel and Eisen Reference Zweifel and Eisen2003, pp. 240–3).
In this article, I concentrate on the exposure to relative actuarial risk for the reason that this dimension is consistent with contemporaries' thinking and is a standard concept in modern economics. In this context, I measure a KV's exposure to actuarial risk by the variance of average costs per contributor, or

In this equation, Z denotes the actual aggregate claims costs of category e that KV i had to settle in year t; the data situation does not allow for modelling periods shorter than a year. I distinguish between two categories of claims, namely all sorts of pensions (e = 1) and all sorts of sickness benefits (e = 2). E[Z] denotes expected (or predicted) aggregate claims costs. N is the number of contributing miners, not of the entire membership. It is, therefore, important to note that Z/N must not be interpreted as the average claim size in the sense of an average pension a pensioner received in t, but as the fraction of the total pension cost that the average contributor had to finance with his payments.
The insurance literature basically predicts an inverse relationship between an insurer's size and the variance of the average claim (Albrecht Reference Albrecht1984a, Reference Albrecht1984b). To an extent, the KVs' contemporaries seem to have put the right issue on their agenda. However, contemporaries of the KVs did not attempt to explore the issue quantitatively. This seems an important task since it is not clear whether or not the exposure to actuarial risk could have been reduced strictly monotonically with growth. There might even have been a minimum efficient size beyond which no more reductions in the exposure could have been realised; this would tell us something about the optimal design of the mineworkers' scheme from our ex-post perspective. The following model is not intended to explore whether KVs generated internal or external growth because they believed in contemporary actuarial considerations. Rather, the model is intended to explore whether KVs had effectively realised economies of scale by growing, such that increasing the pool size was empirically (ex post) – not only theoretically (ex ante) – a useful strategy. The claim that the larger a KV was, the better it could capitalise on the law of large numbers in predicting future costs, is consistent with the implications of both the empirical and mathematical formulations of the law of large numbers: the variance of the average claim size must converge towards zero if the size of the insurants' collective converges towards infinity (Albrecht Reference Albrecht1982, p. 504). Thus, it seems reasonable to test the following hypothesis for all Prussian KVs:
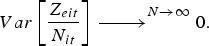
Given that predictions of E[Z] are available, I fit the following panel regression specification separately for categories e = 1 and e = 2:

Variables are in logs. The dependent variable is the category-specific variance, and SIZE is a placeholder for two different measures of KV size. The first and main measure is the total number of contributors (total contributors), and the second measure is the number of contributors per works divided by the total number of contributors (correlated claims). While the first measure is simply intended to display the true financing power of the KVs, the second measure needs some more substantiation. Since mining inevitably meant a high risk of massive accidents that would probably involve a lot of mineworkers at the same time and, thereby, immediately overwhelm a KV with sickness or invalidity claims, claims might have been correlated to some extent. If a KV was in charge of exactly one mine, the measure equals one, meaning that the potential for correlation of risks due to a mass accident was high, simply because the entire working membership worked together in close proximity and could have been affected by that accident at the same time. The more mines a KV was in charge of, the smaller was the ratio and the lower, arguably, was the potential for immediate financial disaster from correlated risks. Even though the statistics do not allow us to specify how many accidents occurred per KV per year, we can be sure that underground mining operations were connected with a high ex ante accident risk. Data from the Knappschafts-Berufsgenossenschaft, the employer-based carrier of Bismarckian accident insurance, show that the accident rate among miners markedly exceeded the national average: counting only the first-time reimbursed cases of accident, 6.6 miners per 1,000 were affected in 1886 and 15 in 1913; on the national average, only 2.8 and 4.8 were affected, respectively (Boyer Reference Boyer1995, p. 38).Footnote 13 Besides, a dummy variable controls for the new 1906 regulations (D 1906); it takes on the value one for all years 1908 to 1913 (when the regulations came statistically into effect) and zero otherwise.
A last point concerns the variance measure. In order to calculate it, I need to form expectations or predictions of a KV's historical costs, Z e, in the observed years. Yet, data on the KVs' expectations – in the form of a list, for example, that says ‘we expect costs of x marks in year t’ – are not available. Basically, there are three ways to compensate for this lack of information: (i) I could use static expectations – i.e. expecting for year t the costs of the preceding year; (ii) I could use adaptive expectations – i.e. expecting for year t the costs of the year t-1, corrected in some way for the experience in the years before t-1; or (iii) I could form expectations based on combining more information than just past expenditure series. The latter is what I do, but what the KVs were, of course, not able to do. Precisely, I specify a pooled regression model based on data on all 103 Prussian KVs in order to explain their historical pension and sickness costs in each year under observation. From the regression model, I recover the predicted values that I use as input into equation (1). According to Emery and Emery (Reference Emery and Emery1999, p. 144) and Broten (Reference Broten2010, p. 33), this regression model might be called an ‘aggregate claims distribution’; as in Broten, I model the distribution as a single process.
I use the generalised linear-models (GLM) approach according to Nelder and Wedderburn (Reference Nelder and Wedderburn1972) to estimate a baseline Poisson model. The GLM approach allows – instead of using maximum likelihood estimation – iterated reweighted least squares optimisation (IRLS), which is said to improve the robustness of the conditional mean estimates to distributional misspecification; in the case of the Poisson distribution, misspecification might occur because the assumption of the variance-mean-equality is violated by the data (Nelder and Wedderburn Reference Nelder and Wedderburn1972). The dependent variables are the natural logarithms of total pension costs (pension costs) and of total sickness costs (sickness costs) of KV i in year t, which are calculated as the number of claims – i.e. the number of pensioners or the number of sick days – times the average payout. For both combinations of claim category e and the period 1867-1913, I estimate the conditional mean according to equation (4). The independent variables are intended to substantiate the KV's risk structure. Except for the last regressor, subscripts e and t are omitted for convenience:

First of all, controls include the five age-group shares with respect to established contributors that are recoverable from the KV statistics. The variable is constructed as the ratio between age group w's size and all established contributors. The w denote five age groups of established miners: those aged between 16 and 25, 26 and 35, 36 and 45, 46 and 55, and 56 and older. The age-group shares are intended to capture a KV's age structure as well as possible. While the KV statistics do provide age-group data on established mineworkers, they do not, unfortunately, provide such data on unestablished ones. Recent empirical evidence suggests that the incidence and severity of sickness or inability to work rises with age (Gorsky, Harris and Hinde Reference Gorsky, Harris and Hinde2006).
Furthermore, since a larger KV is likely to have generated more claims than a smaller KV, membership size – i.e. in this case, the sum of all working members and all pensioners – is incorporated in the model as well (membership). In addition, the variable average payout – either overall pension costs per pension or sick pay per day – is intended to measure generosity. The variable burden is a placeholder, denoting either the pensioners-to-contributors ratio (pensioner burden) if pension costs are addressed, or the sick-days-to-contributors ratio (sick day burden) if sickness costs are addressed. Following Guinnane and Streb (Reference Guinnane and Streb2011), the variable firm is included and defined as the ratio between employers' contributions and total costs.
The variable estab measures the share of established contributors among all contributors. Since established miners were said to be costlier than unestablished ones, the proportion is assumed to matter. Here, as in the other cases, the nonlinearities notably improve the fit. I also take into account the production structure of the mining area or firm to which a KV was tied by incorporating variables that measure how many of a KV's insurants were employed in the different sub-sectors. According to the KV statistics, I determine eight sub-sectors: hard-coal, brown-coal, iron-ore, miscellaneous ores, halite, stone, salt and steel; the variable steel is equal to the share of KV members employed in steelworks and ore-processing plants. Contemporaries believed that the different sub-sectors reflected different occupational hazards because of variation in the production process.
Finally, to complete specification (4), firm KV is a dummy taking on the value one if a KV was a firm-related fund. The variable lagged costs measures the pension or sickness costs of the preceding period, and four dummy variables control for the mining-administration regions (Oberbergamtsbezirke) in which the KVs were located: Breslau, Clausthal, Dortmund and Halle; the dummy for the fifth region, Bonn, is omitted in order to avoid multicollinearity. Year dummies are included for all years but 1867 to allow for effects common to all KVs (e.g. macroeconomic effects, legislative effects). In order to check for the model's robustness to alternative distributional assumptions, I additionally perform a Gaussian and a negative binomial regression of equation (4).
V
The empirical section begins with a discussion of the regressions explaining total pension and total sickness costs. Tables 4 and 5 display the baseline estimation results assuming a single Poisson process. Equation (4) was estimated for five size classes because I assumed that the influence of the explanatory variables on costs might have been different for different KV sizes; size is measured in terms of the number of contributors. In addition, this approach improved the fit since it reduced the strong influence of observations on the very large KVs on coefficient estimates, which, at first, predicted costs for smaller KVs that appeared far too high.
Explaining total pension costs (baseline Poisson model, dependent variable is the log of pensions costs, elasticities displayed)

Explaining total sickness costs (baseline Poisson model, dependent variable is the log of sickness costs, elasticities displayed)

Note: Standard errors are in brackets. Mining administration region and year effects are not displayed. *, ** and *** denote significance on the 1, 5 and 10 per cent levels.
What do estimation results tell us about the KVs' scheme? Obviously, not all explanatory variables have significant explanatory power, and only a few variables are significant in all ten models. Because elasticities are displayed, a coefficient can be interpreted as indicating the percentage change in the dependent variable given a 1 per cent change in the independent variable. Let us look at the variable membership first. According to Emery and Emery's (1999, p. 79) and Broten's (2010, p. 33) findings, claims costs significantly increase if membership increases; this holds for all models. Hence, larger insurance collectives produce more costs. Like membership, the variables average payout, burden (pensioner burden or sick day burden) and firm-related KV are important, too. In all cases but one, raising the generosity per pension or per sick day leads to an increase in costs; this fact is straightforward, of course. Furthermore, a rising pensioners-to-contributors ratio drives costs up. We can interpret this effect as a direct consequence of an ongoing ageing process among the KVs' members. However, the effect is not linear, implying that in a collective that had already aged, costs were increasingly controlled and kept down. The significance of the dummy that indicates firm-related KVs shows that those had, in the majority of cases, lower minimum costs than area-related KVs.
With regard to total pension costs, the variable firm share is important only for the smallest KVs, implying that an increase in the employers' financing share increased costs. This also holds regarding sickness costs – except for the third size class – and leads to the conclusion that mineworkers were occasionally more prone to claim invalidity or sickness if they knew their fellows' wallets were relatively less burdened.
Moreover, it would be consistent with the view that established miners were more costly per capita than the unestablished mineworkers if the coefficients of the variable established ratio were statistically significant. What we find, in fact, is that the structure of the contributor base with respect to this insurant characteristic helps to explain total costs in half the cases. The message is ambivalent: regarding sickness and pension costs of the largest KVs, the elasticity is negative, meaning that an increase in the proportion of unestablished miners is connected with an increase in costs. This implies that unestablished miners were, on average, not less costly per capita. This, in turn, might point to a higher claim number per year, possibly because they were – as they were often part-time workers – less experienced in their jobs and, thus, more endangered or they reacted to a comparatively lower per capita benefit by claiming (and maybe simulating) more.
Moreover, there are the age structure and production structure variables. Contrary to my expectations, the age structure of established contributors is not always important. Regarding pension costs, an increase in the share of older contributors, to the detriment of younger contributors, increases costs (except for the largest KVs). Regarding sickness costs, however, an increase in the same share reduces costs. This holds for the three largest size classes. An explanation might be that older contributors, who had gone beyond their productivity peak, often were reallocated to less perilous occupations at the surface, which resulted in less sickness. Regarding pension costs, the potential for becoming disabled nonetheless remained. This is the reason why a positive coefficient makes sense. Finally, Appendices 1 to 4 display coefficients using a negative binomial and a Gaussian distribution.
Let us now turn to the empirical findings on the existence of scale economies regarding the KVs' actuarial risk as defined in the subsequent section. The contemporary observers of the KVs' operations believed that there was a positive relationship between KV size and financial stability. A reduction in the average costs' variance due to an increase in the insurance collective was linked with the stability issue, in that this effect was said to improve the predictability of costs; this would have been due to a reduction of the bandwidth of possible economic outcomes. Besides, as Albert Caron stated, a reduction in the variance would have been the necessary precondition to lower the implicit degree of risk loading on top of the premium and, thus, to charge a premium on the representative mineworker that was closer to the expected value of cost; this would then have been an actuarially fairer premium. However, the question of whether or not KVs actually passed on such scale economies to their insurants is different from the question of whether or not there was the potential for such scale economies at all. This article is intended to answer the latter question and leaves the former one for another study.
According to equation (2), did the variance diminish if the collective of insurants increased? The empirical message of Table 6 with regard to the main size measure – total contributors – is that the variance did indeed diminish in both the pension and sickness insurance sections, but only up to a certain size. With regard to the variance of the average pension costs that a representative mineworker had to finance, the following findings need to be highlighted. At first, the variance diminished by around 2.5 per cent if the number of contributors increased. Between a size of 200 and 999 contributors, the variance even diminished by 3.4 per cent, given a 1 per cent increase in size. The variance decreased further – by 0.62 per cent between 1867 and 1907 and by 0.96 per cent between 1908 and 1913 – up to size of about 5,000 contributors. Beyond that size, the statistical models suggest that there were no more scale economies. With regard to the variance of the average sickness costs, the picture is slightly different: a statistically significant effect cannot be detected for smallest KVs, but model 2 suggests that the variance significantly diminished, by 1.5 per cent (1867–1907) or 1.3 per cent (1908–13), between 200 and 999 contributors, given a 1 per cent increase in size. While there is no significant effect in the third size class, there is one in the fourth, but in the opposite direction. Interestingly, the conditional increase in the variance is 1.4 per cent between a size of 5,000 and 9,999 contributors. There is, again, no significant effect for the largest KVs.
The relationship between Knappschaft size and actuarial risk (dependent variable is the variance of the average claim, elasticities displayed)

Note: Standard errors are in brackets. *, **, and *** denote significance on the 1, 5 and 10 percent levels. All models are estimated with fixed effects.
What does the second measure of size – correlated risks – tell us? This alternative measure is based on the assumption that a single workplace – i.e. a mine, a steelworks or a stone pit – can be treated as a closed system without being physically interrelated with another workplace. The KV statistics report how many of those workplaces existed in a KV's area or belonged to the company a KV was responsible for. The smaller the percentage of the average mine's (steelworks', stone pit's) size of total contributors was, the lower was the probability, it is assumed, that a high number of correlated claims occurred at the same time. With regard to pension insurance, Table 6 indeed suggests that an increase in the potential for correlated risks is significantly associated with an increase in the variance for the smallest KVs. Beyond that, regarding sickness insurance, the effect exists between a size of 200 and 9,999 contributors. However, the finding for the largest KVs is counterintuitive: in both our (hypothetical) pension and sickness insurance sections, a decrease in the ratio of contributors per works to total contributors leads to an increase in the variance. How can this finding be explained? Assume that it is possible to assign to each mine a probability greater than zero but smaller than one that an accident would occur at a particular point in time. Let us consider a second probability, namely that, for a given number of different workplaces a KV was responsible for, an accident would always occur. Considering that one of the largest KVs was responsible for more workplaces than one of the smaller KVs, the probability that always one, two or even more mass accident(s) involving many miners at the same time would occur might have been much higher for larger KVs.
Let us focus now on the broader implications for the KVs' insurance scheme and the concentration process that can be observed. The opinion of contemporaries, outlined above, argued for how KVs could improve their actuarial foundation and suggested that KVs needed to operate, in modern economics' terms, at the ‘minimum efficient size’. There was no doubt that many KVs had still not ‘found’ that operational scale. Unfortunately, there was no contemporary attempt to measure that size. The empirical model presented in this artcicle is the first attempt to quantify that issue.
The first implication to mention is that the ‘design flaw’ of KVs (bundled pension and sickness benefits until 1906/7) was empirically relevant. On the one hand, evidence strongly makes the case for a minimum efficient size of a KV's pension insurance section of about 5,000 contributors; up to this size, growth in the number of contributors considerably reduced the relative actuarial risk. On the other hand, evidence strongly makes the case for a minimum efficient size of a KV's sickness insurance section of about 1,000 contributors. Only up to that size was the exposure to actuarial risk diminished considerably; it would have even increased beyond that size. The latter finding might be of special interest for all scholars studying the friendly societies, fraternal lodges or other prominent examples of mutual sickness funds in particular: Since those funds seem to have been, in general, quite small, the issue of scale economies regarding actuarial risk would very probably not have mattered empirically. This is the more so since the potential for correlated claims seems not to have played a major role for very small funds. Surely, this interpretation might not be independent of how the size class intervals are defined.
Depending on whether or not the issue of correlated claims is considered crucial, the findings even make the case for sickness funds that are larger than pension funds. This is because, up to a size of approximately 10,000 contributors, the variance decreased if the potential for correlated claims decreased. This seems to be particularly important with regard to the issue of infectious or parasitic diseases triggering epidemics. Recently, Bluma (Reference Bluma2009) told the story of the hookworm (anchylostomiasis) epidemic in the Ruhr area at the time of the Kaiserreich, a parasitic disease which arose due to poor hygiene at the surface and especially underground. Since findings imply that a large sickness fund covering many workplaces was superior to a small one in controlling for correlated risks, there is reason to believe that this was especially true regarding epidemics.
The second implication concerns the account of the concentration process among KVs itself. Against the background of a persistently low median size (see Table 1), the findings suggest that in every year under observation, at least one half of all KVs operated on a scale too small to deal adequately with actuarial risk, especially in the pension insurance section. Findings further suggest that part of the potential for improvements in the predictability of costs remained unused.
In the light of the empirical results, how might the insufficient degree of concentration or, respectively, the insufficient quality of the observable concentration process be explained? From the viewpoint of the whole insurance system, ensuring the security of supply with insurance coverage and, thus, ensuring every members' acquired legal entitlements to (future) benefits, must have had utmost priority. In this respect, it would have been collectively rational to conduct mergers that eliminated all small KVs and integrated those memberships into larger funds. In particular, even if the growth opportunities of many KVs were naturally bounded from above by the dimension of their area or their company (i.e. in the end, the capacity of the underlying resource deposits) – limiting the number of miners that were employable overall and, thus, the possibility to approach the minimum efficient size of about 5,000 contributors exclusively by internal growth – this obstacle was overcome by either absorbing another KV or applying to be a target for a merger by absorption.
In fact, referring to the newest findings on the merger and liquidation activities of the KVs (Jopp Reference Jopp2011a), absorbing many of the small KVs was obviously not individually rational. Larger KVs absorbed smaller ones only if they were attractive enough, and many smaller KVs did not fulfill this condition since they were stagnating and not prospering. Given that there were disincentives for voluntary – or better, solidary – mergers that would have improved the stability of the whole insurance system, could not the regulator have provided a solution to this dilemma? For the regulator had once implemented those legal entitlements that were actually lost in case a KV ended up in liquidation. The regulator, in fact, seems to have been very passive overall, which clearly matches with the ideas of economic liberalism that emerged in Prussia and Germany in the middle of the nineteenth century. However, it could be reasonable for a regulator to intervene if a clear market failure (a lack of security of supply) could be detected. The question is whether the mining administration should have forced mergers upon KVs even before the new regulations of 1906 came. The answer seems to be yes, but evidence suggests that it was not done. According to Jopp (Reference Jopp and Bartels2010b), 14 mergers involving 30 different KVs were effectively conducted between 1867 and 1907, and four between 1908 and 1913 involving a further nine different KVs. In addition, eight liquidations occurred before the new regulation of 1906 and three thereafter. Regarding the median size, this number of mergers appears to have been insufficient to improve the financial stability of KVs. The liquidations, in particular, seem to have been the natural consequence of not being able to handle the actuarial risk in either way (internal or external growth).
Besides the ‘liberal policy argument’, two other explanations may apply. On the one hand, the regulator, and probably the other economic players as well, might not have had the knowledge about which size is really appropriate to adequately handle risk. On the other hand, employers who arguably dominated the business decisions of the KVs might have successfully lobbied the regulator not to intervene rigorously. This might have applied to employers involved in potential absorber KVs that did not want to share their prosperity, but also to those employers involved in smaller and/or stagnating (often firm-related) KVs who might have feared losing control over their employees exerted via the KV (Lauf Reference Lauf2006). Although Przigoda (Reference Przigoda2002) provides a study on organised interest-driven politics in the coal-mining region of the Ruhr at the time, there is currently no study covering the entire Reich.
Finally, if a KV did not need to be larger than about 5,000 contributors or, depending on the emphasis, than 1,000 contributors to adequately deal with actuarial risk, would there nevertheless be arguments in favour of larger organisations? In my view, there are at least two such arguments. On the one hand, one could debate whether or not a large KV size well beyond 5,000 or 10,000 members would have been helpful in lowering the administrative overheads of the system. This question is highly relevant with regard to, for example, the current German social security system. It might turn out in an empirical analysis that larger KVs had serious advantages in that respect. A quick view of the raw data yields an ambivalent picture, in that there were KVs throughout all size classes that show a positive correlation between administrative overheads per capita and KV size. On the other hand, one could argue that a large size would have enabled a KV to reduce the financial reserves necessary to maintain a given security level measured by the probability of ruin. For theory suggests that doubling an insurance company's size can be associated with a less-than-double increase in financial reserves if the security level is held constant. Exploring this relationship, however, is left for another analysis, in particular because it seems that we cannot take for granted that a KV's main financial aim was to ensure the highest possible security level with least possible reserves.
VI
This article assesses the Prussian miners' social insurance funds' exposure to actuarial risk during 1867–1913. The KVs form one of the oldest collective solutions to job-related provision against the contingencies of life, such as illness, injuries, invalidity and survivorship. With the reform of the Prussian mining law between 1851 and 1865, the KVs took on the characteristics of social insurance. Based on the nineteenth-century discussion among observers of the KVs' insurance operations, this article analyses the empirical relationship between the exposure to actuarial risk and fund size. Actuarial risk is measured by the variance of the average claim (or costs) that one contributor had to finance effectively.
The analysis yields several noteworthy findings. First, the historical example of the German KVs' worker insurance scheme turns out to deviate from accounts of prominent schemes already discussed in the literature. It appears that the questions of the importance of scale economies and of risk pooling plagued people much more. Second, the straightforward empirical model applied suggests that the KVs' actuarial risk could have been – and partly was – reduced by increases in size through internal or even external growth. Small KVs were, first and foremost, exposed to actuarial risk stemming from pension provision. Findings point to a minimum efficient pension fund size of approximately 5,000 contributors – a size at which actuarial risk appears to have been minimised. This is, however, not to say that the risk was zero, as a residual risk due to pure chance always remains. The usual assessment of contemporaries that KVs needed to be even larger to ensure financial stability cannot be proved. Third, the alleged ‘design flaw’ – a very unequal size distribution in combination with the bundling of pension and sickness insurance – mattered. Findings point to a trade-off between minimising actuarial risk in pension insurance and doing so with regard to sickness insurance. The analysis points to a minimum efficient sickness fund size of no less than 1,000 contributors. Taking into consideration the potential for correlated risks, one could even argue in favour of sickness funds notably larger than the minimum efficient pension funds. Fourth, contemporaries strongly recommended mergers among KVs to approach the (unknown) minimum efficient pension fund size and especially to eliminate the many small funds that were claimed to be exposed to too much variability. However, the concentration process was unsuccessful insofar as economies of scale were not exploited optimally. This was probably due to the lack of knowledge about the precise minimum efficient scale.
APPENDIX
Explaining total pension costs (negative binomial model, dependent variable is the log of pensions costs, elasticities displayed)

Explaining total sickness costs (negative binomial model, dependent variable is the log of sickness costs, elasticities displayed)

Note: Standard errors are in brackets. Mining administration region and year effects are not displayed. *, ** and *** denote significance on the 1, 5 and 10 per cent levels.
Explaining total pension costs (Gaussian model, dependent variable is pensions costs, elasticities displayed)

Explaining total sickness costs (Gaussian model, dependent variable is sickness costs, elasticities displayed)

Note: Standard errors are in brackets. Mining administration region and year effects are not displayed. *, ** and *** denote significance on the 1, 5 and 10 per cent levels.



