1. Introduction
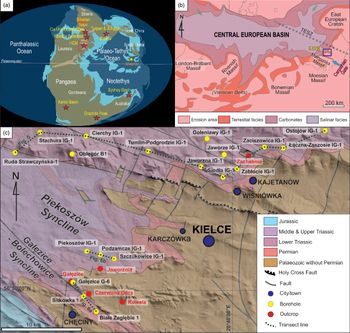
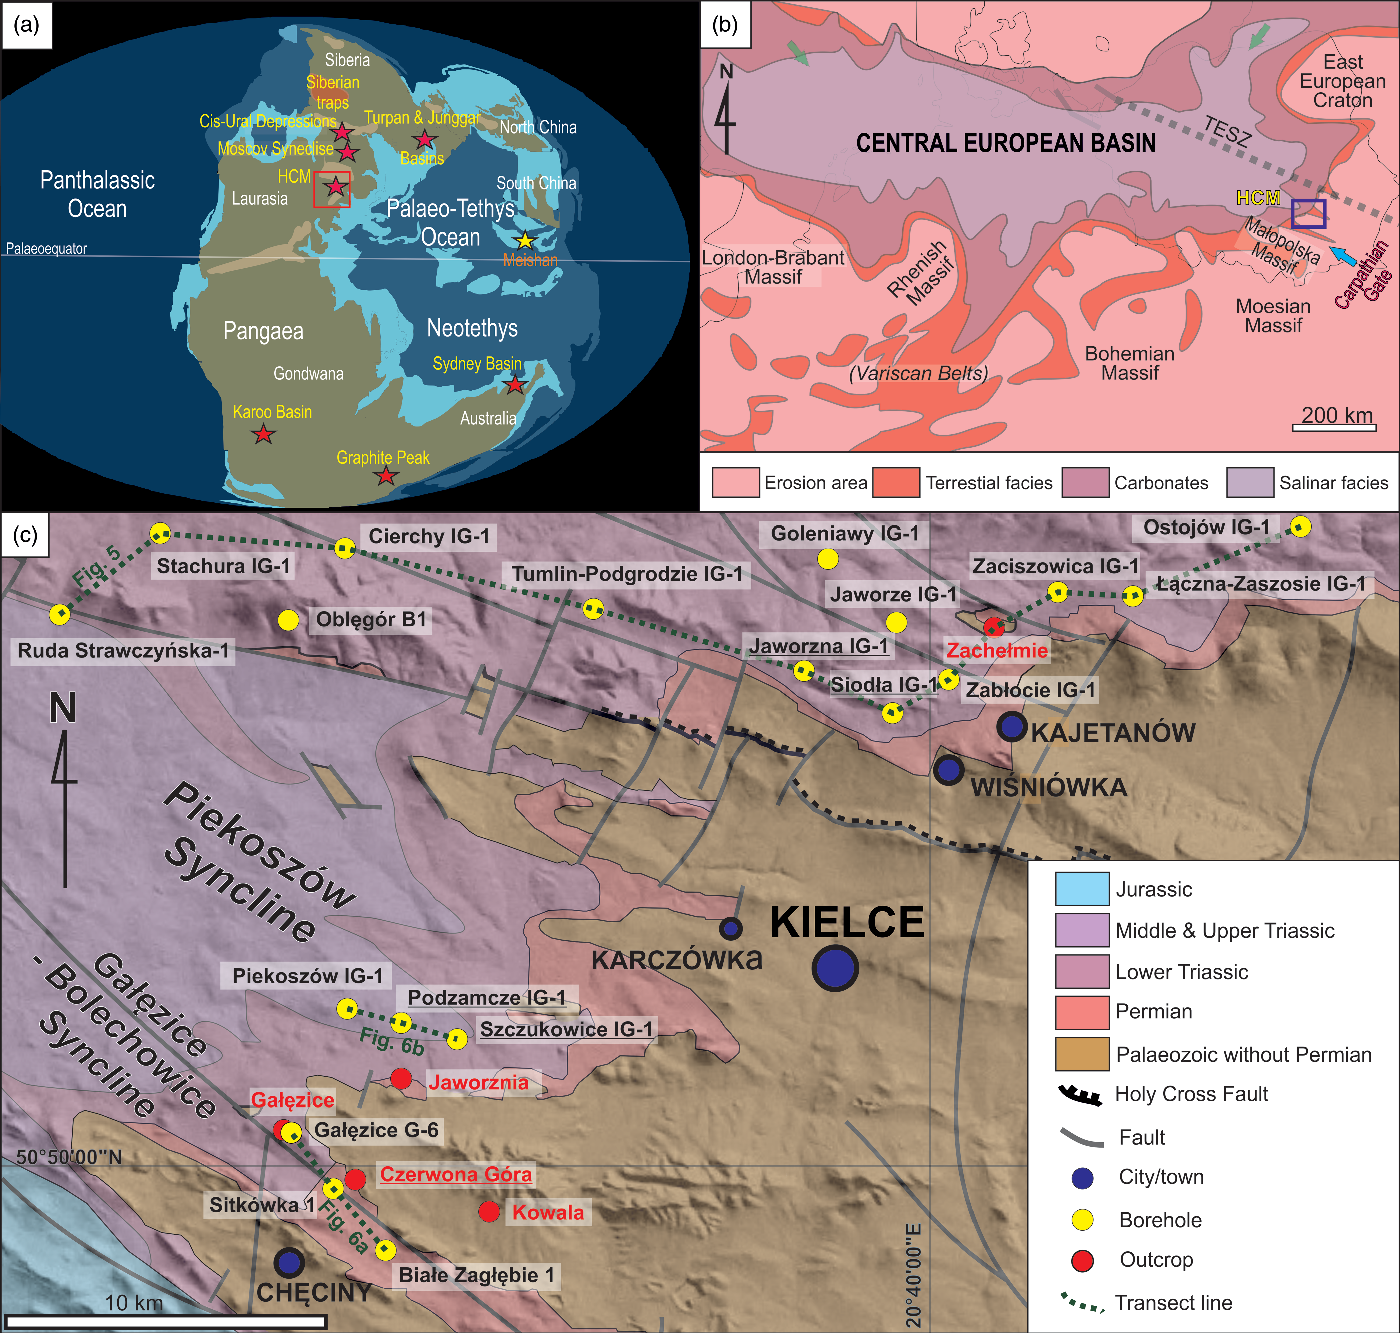
The Permian–Triassic transition marks one of the biggest environmental crises in Earth’s history, which affected both marine and continental settings (Erwin et al. Reference Erwin, Bowring, Yugan, Koeberl and MacLeod2002; Benton & Newell, Reference Benton and Newell2014), and was manifested by global geochemical disturbances and a mass extinction of various groups of fauna and flora. Despite decades of research, the trigger mechanisms, event chronology, rate of extinction and subsequent biotic recovery remain poorly understood (see Benton & Newell, Reference Benton and Newell2014; Nowak et al. Reference Nowak, Schneebeli-Hermann and Kustatscher2019); however, the emplacement of Siberian traps in NE Pangea (Fig. 1a) is considered to be a major driving force behind the event (Racki & Wignall, Reference Racki and Wignall2005). The environmental dynamics across the Permian–Triassic (P/T) boundary have been studied mainly in marine sections, whereas changes in continental successions are considerably less recognized and understood (see Lozovsky, Reference Lozovsky1998; Benton & Newell, Reference Benton and Newell2014 for review; Fig. 1a). Identification of the P/T boundary in such environments is very difficult mainly due to poor preservation of index taxa in a terrestrial record as well as the presence of numerous stratigraphic hiatuses caused by erosion and/or non-deposition (e.g. Bourquin et al. Reference Bourquin, Bercovic, López-Gómez, Diez, Broutin, Ronchi, Durand, Arché, Linol and Amour2011). The available biostratigraphic tools such as palynostratigraphy and conchostracan stratigraphy can improve existing stratigraphic framework as well as increase the reliability of correlations between marine and non-marine realms (e.g. Schneider et al. Reference Schneider, Lucas, Scholze, Voigt, Marchetti, Klein, Opluštil, Werneburg, Golubev, Barrick, Nemyrovska, Ronchi, Day, Silantiev, Rößler, Saber, Linnemann, Zharinova and Shen2019) although taphonomical bias and problems in taxonomy may severely complicate these tasks (Becker, Reference Becker2015; Scholze et al. Reference Scholze, Schneider and Werneburg2016). This is also the case for the Central European Basin (CEB; Fig. 1a,b) where, despite nearly 200 years of research on the Permian and Triassic sediments, the location of this boundary is still a matter of controversy (e.g. Nawrocki, Reference Nawrocki1997; Kozur, Reference Kozur1989, Reference Kozur1998; Lozovsky, Reference Lozovsky1998; Szurlies, Reference Szurlies2007).
(a) Palaeogeographical reconstruction for the Permian–Triassic transition period (~251 Ma) taken from Scotese (http://www.scotese.com, modified and simplified). The studied area is shown by the blue rectangle. Red stars show best-known Permian–Triassic transitions preserved in the continental settings (e.g. Turpan and Junggar basins, Lozovsky, Reference Lozovsky1998; Thomas et al. Reference Thomas, Tabor, Yang, Myers, Yang and Wang2011; Moscow Syneclise, Scholze et al. Reference Scholze, Solubev, Niedźwiedzki, Schneider and Sennikov2019; Sydney Basin, Michaelson, Reference Michaelson2002; Graphite Peak, Retallack & Krull, Reference Retallack and Krull1999; Karoo Basin, Retallack et al. Reference Retallack, Smith and Ward2003; Gastalado et al. Reference Gastalado, Knight, Neveling and Tabor2014). The yellow star highlights the position of Permian–Triassic Global Stratotype Section in Meishan (China). Siberian traps, likely responsible for P/T extinction (cf. Benton & Newell, Reference Benton and Newell2014), are depicted with red shading. (b) Palaeogeographic map of the upper Permian deposits (Zechstein) of the Central European Basin after Ziegler (Reference Ziegler1990, modified). The studied area is highlighted with the blue rectangle. Triassic transgression through ‘Carpathian Gate’ is indicated by the blue arrow. Early Triassic potential transgressions from the north are represented by green arrows (cf. Szulc, Reference Szulc2019). TESZ – Trans-European Suture Zone. Current positions of the Variscan and Carpathian orogenic belts are provided in parentheses. (c) Simplified geological map of the Holy Cross Mountains and its margins (after Trela & Fijałkowska-Mader, Reference Trela and Fijalkowska-Mader2017, modified) with locations of studied drill cores and outcrops. The drill cores and outcrops with stratotypes have underlined names.
An erosional gap at the P/T boundary has been recorded in the western margin of the Central European Basin (Bourquin et al. Reference Bourquin, Durand, Diez, Broutin and Fluteau2007, Reference Bourquin, Bercovic, López-Gómez, Diez, Broutin, Ronchi, Durand, Arché, Linol and Amour2011), while in its central and eastern parts the continuity of the sedimentation was proved magnetostratigraphically by Szurlies et al. (Reference Szurlies, Bachmann, Menning, Nowaczyk and Käding2003), Nawrocki (Reference Nawrocki2004), and Menning & Käding (Reference Menning, Käding, Lepper and Röhling2013).
The Permian and Triassic sedimentary strata of this region were deposited in the southeastern marginal part of a large, intracontinental CEB that extended from the United Kingdom and western France eastwards through Germany to Poland (Fig. 1b). It was established during the Permian Period (Southern Permian Basin or Germanic Basin in the case of its Triassic history) in response to a thermal subsidence after the Variscan orogeny compressive stage (Wagner, Reference Wagner1994; McCann et al. Reference McCann, Kiersnowski, Krainer, Vozárová, Peryt, Oplustill, Stollhofen, Schneider, Wetzel, Boulvain, Dusar, Török, Haas, Tait, Körner and McCann2008; Bourquin et al. Reference Bourquin, Bercovic, López-Gómez, Diez, Broutin, Ronchi, Durand, Arché, Linol and Amour2011). The basement of the CEB, located NW of the Holy Cross Mountains (HCM), consists of Carboniferous turbidite sequences infilling the Variscan foredeep, derived from a peripheral bulge formed on the East-European Craton (Krzemiński, Reference Krzemiński1999; Jaworowski, Reference Jaworowski2002).
The main objective of this study was to apply a multistratigraphic approach, including the integration of new, previously published and archival litho-, bio- and magnetostratigraphic data from 24 fully cored wells and outcrops from the NW margin of the HCM (Fig. 1c). The study facilitated the establishment of a new lithostratigraphic scheme for this region, which was then used to study in detail the evolution and dynamics of the terrestrial environments across the P/T boundary.
The lithostratigraphic approach, combined with biostratigraphy, magnetostratigraphy and chemostratigraphy, significantly increases the reliability of interwell/outcrop correlation and palaeoenvironmental reconstruction. These points are important prerequisites for comprehensive basin analysis (Miall, Reference Miall2000).
2. Geological background and previous work
The HCM are situated in SE Poland at the junction of the East European Craton (EEC), Carpathian and Variscan belts (Fig. 1b). They consist of Palaeozoic core surrounded by the Permo-Mesozoic (northwestern, western and southwestern boundaries) and Cenozoic sediments (southern and southeastern margins; Fig. 1c). During the Permian Period, the present-day Palaeozoic core of the HCM was an elevated denudation area (as a part of the meta-Carpathian zone by Kutek & Głazek, Reference Kutek and Głazek1972; Wagner, Reference Wagner1994; Świdrowska et al. Reference Świdrowska, Hakenberg, Poluthovie, Seghedi and Višnâkov2008). The post-Variscan block faulting in the HCM area subdivided its relief during the late Permian Period into several subsided basins and uplifted blocks (Kutek & Głazek, Reference Kutek and Głazek1972; Kowalczewski & Rup, Reference Kowalczewski and Rup1989; Morawska, Reference Morawska1992; Świdrowska et al. Reference Świdrowska, Hakenberg, Poluthovie, Seghedi and Višnâkov2008). The lower Permian strata in this area are represented by coarse-grained and conglomeratic continental Rotliegend facies, while the overlying sedimentary succession consists of marine, transitional and continental Zechstein facies referred to as the ‘PZ1–PZ3’ mixed carbonate-salinar-siliciclastic cyclothems (Fig. 2; Pawłowska, Reference Pawłowska, Piątkowski and Wagner1978; Kowalczewski & Rup, Reference Kowalczewski and Rup1989; Kuleta & Zbroja, Reference Kuleta, Zbroja, Skompski and Żylińska2006), correlatable with the central part of CEB (Wagner, Reference Wagner1994). The marine facies are replaced by the uppermost Permian clastics of the ‘Terrigenous Zechstein – PZt’ cyclothem, overlain by the Lower Triassic fluvial succession broadly associated with the basin-wide Buntsandstein Group (Fig. 2; Senkowiczowa, Reference Senkowiczowa and Rühle1970; Kuleta & Zbroja, Reference Kuleta, Zbroja, Skompski and Żylińska2006).
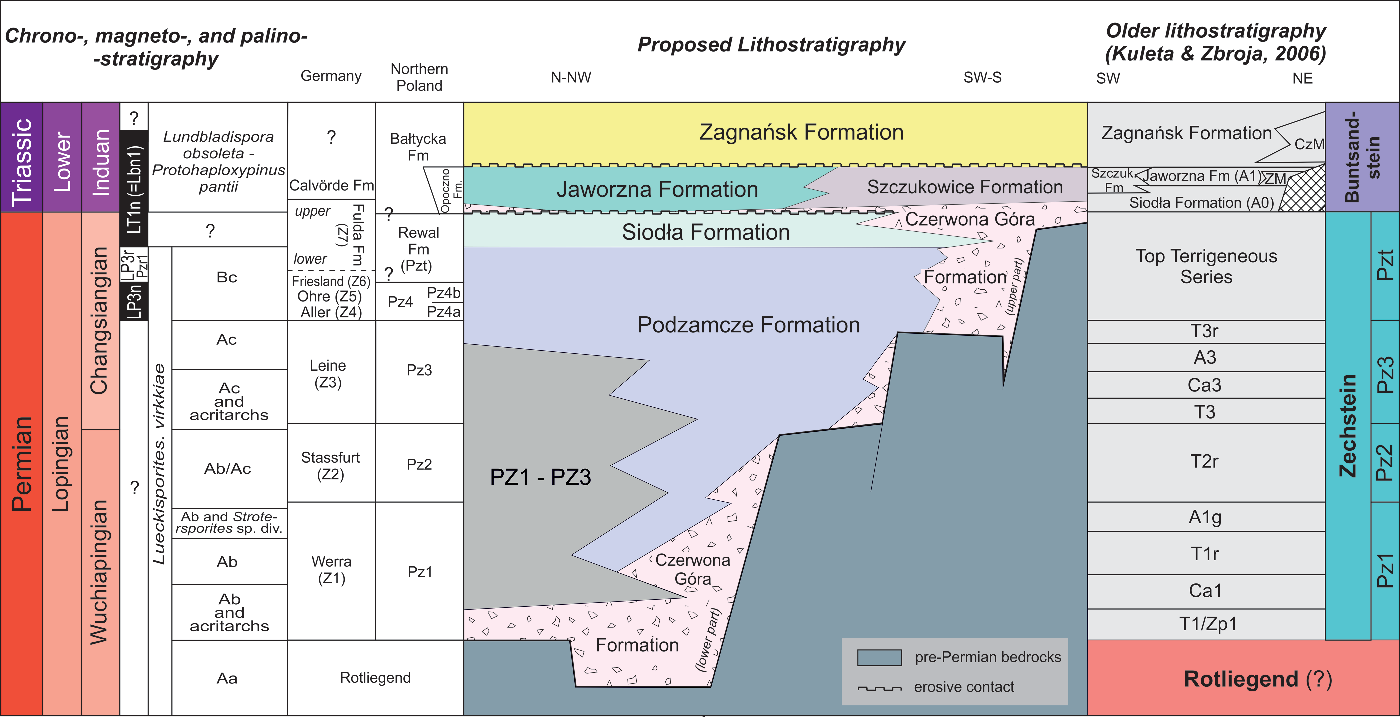
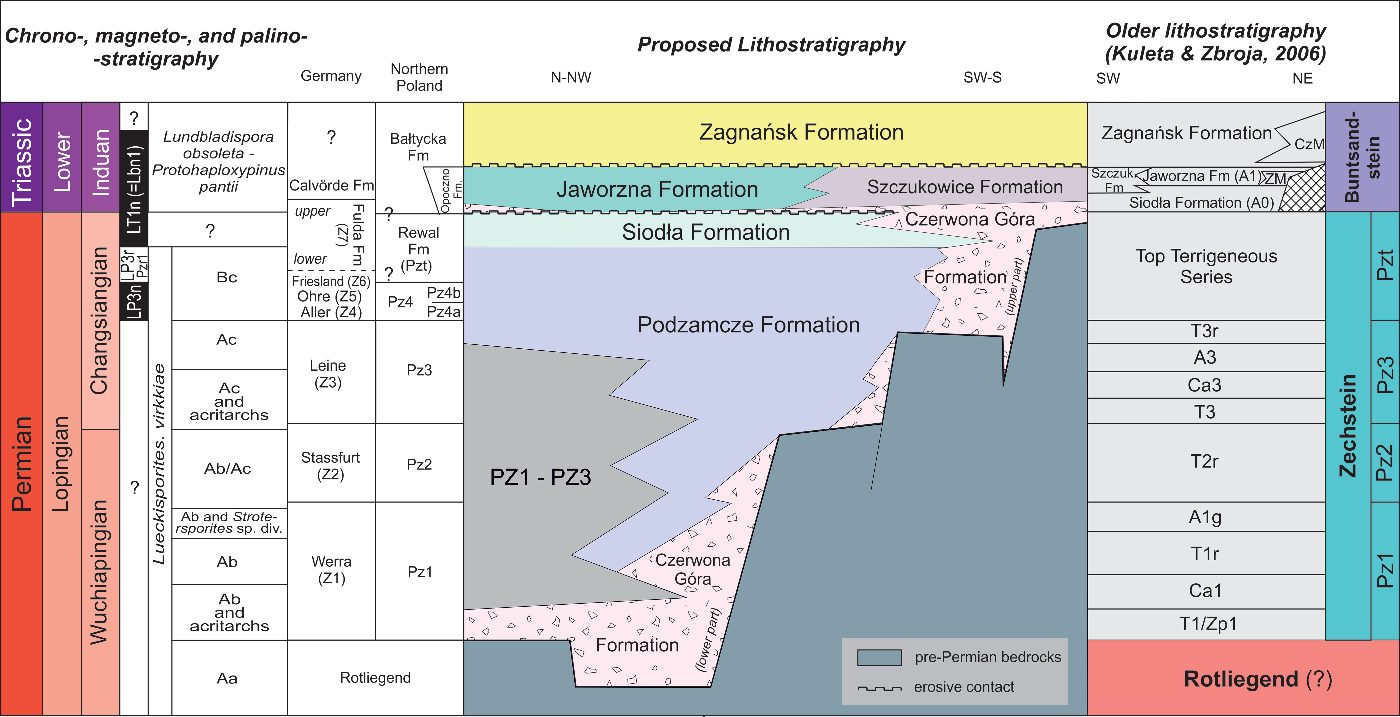
Lithostratigraphic scheme of the P/T boundary interval in the HCM (cf. Skompski, Reference Skompski and Skompski2012). Szczuk. Fm – Szczukowice Formation. Old lithostratigraphic units (Kuleta & Zbroja, Reference Kuleta, Zbroja, Skompski and Żylińska2006): CzM – Czerwona Góra member; ZM – Zachełmie member.
The Zechstein and Buntsandstein strata in the HCM have been studied and described since the nineteenth century (Kowalczewski & Rup, Reference Kowalczewski and Rup1989); however, more comprehensive research was carried out at the beginning of the twentieth century by Czarnocki & Samsonowicz (Reference Czarnocki and Samsonowicz1913, Reference Czarnocki and Samsonowicz1915), Czarnocki (Reference Czarnocki1923) and Samsonowicz (Reference Samsonowicz1929). In the second half of the twentieth century, studies were mostly concentrated on lithostratigraphic aspects and sedimentary settings (Kostecka, Reference Kostecka1962, Reference Kostecka1966; Senkowiczowa, Reference Senkowiczowa and Rühle1970; Rubinowski, Reference Rubinowski, Piątkowski and Wagner1978; Kowalczewski & Rup, Reference Kowalczewski and Rup1989; Pieńkowski, Reference Pieńkowski1989, Reference Pieńkowski1991; Kasprzyk, Reference Kasprzyk1995; Kuleta & Zbroja, Reference Kuleta, Zbroja, Skompski and Żylińska2006; Ptaszyński & Niedźwiedzki, Reference Ptaszyński and Niedźwiedzki2006). Permian and Lower Triassic biostratigraphy is limited as a result of the barren nature of the deposits; however, some progress has been made in palynology (Dybova-Jachowicz & Laszko, Reference Dybova-Jachowicz, Laszko, Piątkowski and Wagner1978, Reference Dybova-Jachowicz and Laszko1980; Orłowska-Zwolińska Reference Orłowska-Zwolińska1984, Reference Orłowska-Zwolińska1985; Fijałkowska & Trzepierczyńska, Reference Fijałkowska and Trzepierczyńska1990; Fijałkowska, Reference Fijałkowska1992, Reference Fijałkowska1994 a, b; Fijałkowska-Mader Reference Fijałkowska-Mader1997, Reference Fijałkowska-Mader1999) and conchostracans for the local and basin-scale correlations (Ptaszyński & Niedźwiedzki, Reference Ptaszyński and Niedźwiedzki2004, Reference Ptaszyński and Niedźwiedzki2006).
Among various stratigraphic techniques, magnetostratigraphy was particularly helpful in resolving the P/T boundary and its correlation within other sections in the CEB (Nawrocki et al. Reference Nawrocki, Wagner and Grabowski1993, Reference Nawrocki, Kuleta and Zbroja2003; Nawrocki, Reference Nawrocki1997, Reference Nawrocki2004; Menning & Käding, Reference Menning, Käding, Lepper and Röhling2013).
3. Stratigraphy of the P/T boundary interval in the HCM: an overview
The lithostratigraphic scheme of the P/T boundary zone in the HCM was established by Senkowiczowa (Reference Senkowiczowa and Rühle1970) and then modified by Kuleta & Zbroja (Reference Kuleta, Zbroja, Skompski and Żylińska2006). However, the lithostratigraphic units created by the cited authors lack formal definition. Notwithstanding, the scheme by Kuleta & Zbroja (Reference Kuleta, Zbroja, Skompski and Żylińska2006) provides the most comprehensive insight into lithological diversity of the P/T interval in the HCM. In their stratigraphic framework the uppermost Permian strata are represented by the ‘PZt - Top Terrigenous Series’ (sensu Kowalczewski & Rup, Reference Kowalczewski and Rup1989) overlying the PZ3 carbonates (Ca3) and siliciclastic-evaporite succession (Fig. 2; Kasprzyk, Reference Kasprzyk1995; Kuleta & Zbroja, Reference Kuleta, Zbroja, Skompski and Żylińska2006). The lowermost Triassic strata consist of red mudstones and sandstones of the Siodła, Jaworzna and Szczukowice formations developed in continental settings of a floodplain and lacustrine environments (Fig. 2; Kuleta & Zbroja, Reference Kuleta, Zbroja, Skompski and Żylińska2006; Trela & Fijałkowska-Mader, Reference Trela and Fijalkowska-Mader2017). These are overlain by fluvial sandstones of the Zagnańsk Formation (Fig. 2). However, the stratigraphic position of the Siodła Formation is disputable and, based on the lithological features and auxiliary biostratigraphic data from adjacent formations, some authors place it in the uppermost Permian strata (Kowalczewski & Rup, Reference Kowalczewski and Rup1989; Ptaszyński & Niedźwiedzki, Reference Ptaszyński and Niedźwiedzki2006; Trela & Fijałkowska-Mader, Reference Trela and Fijalkowska-Mader2017).
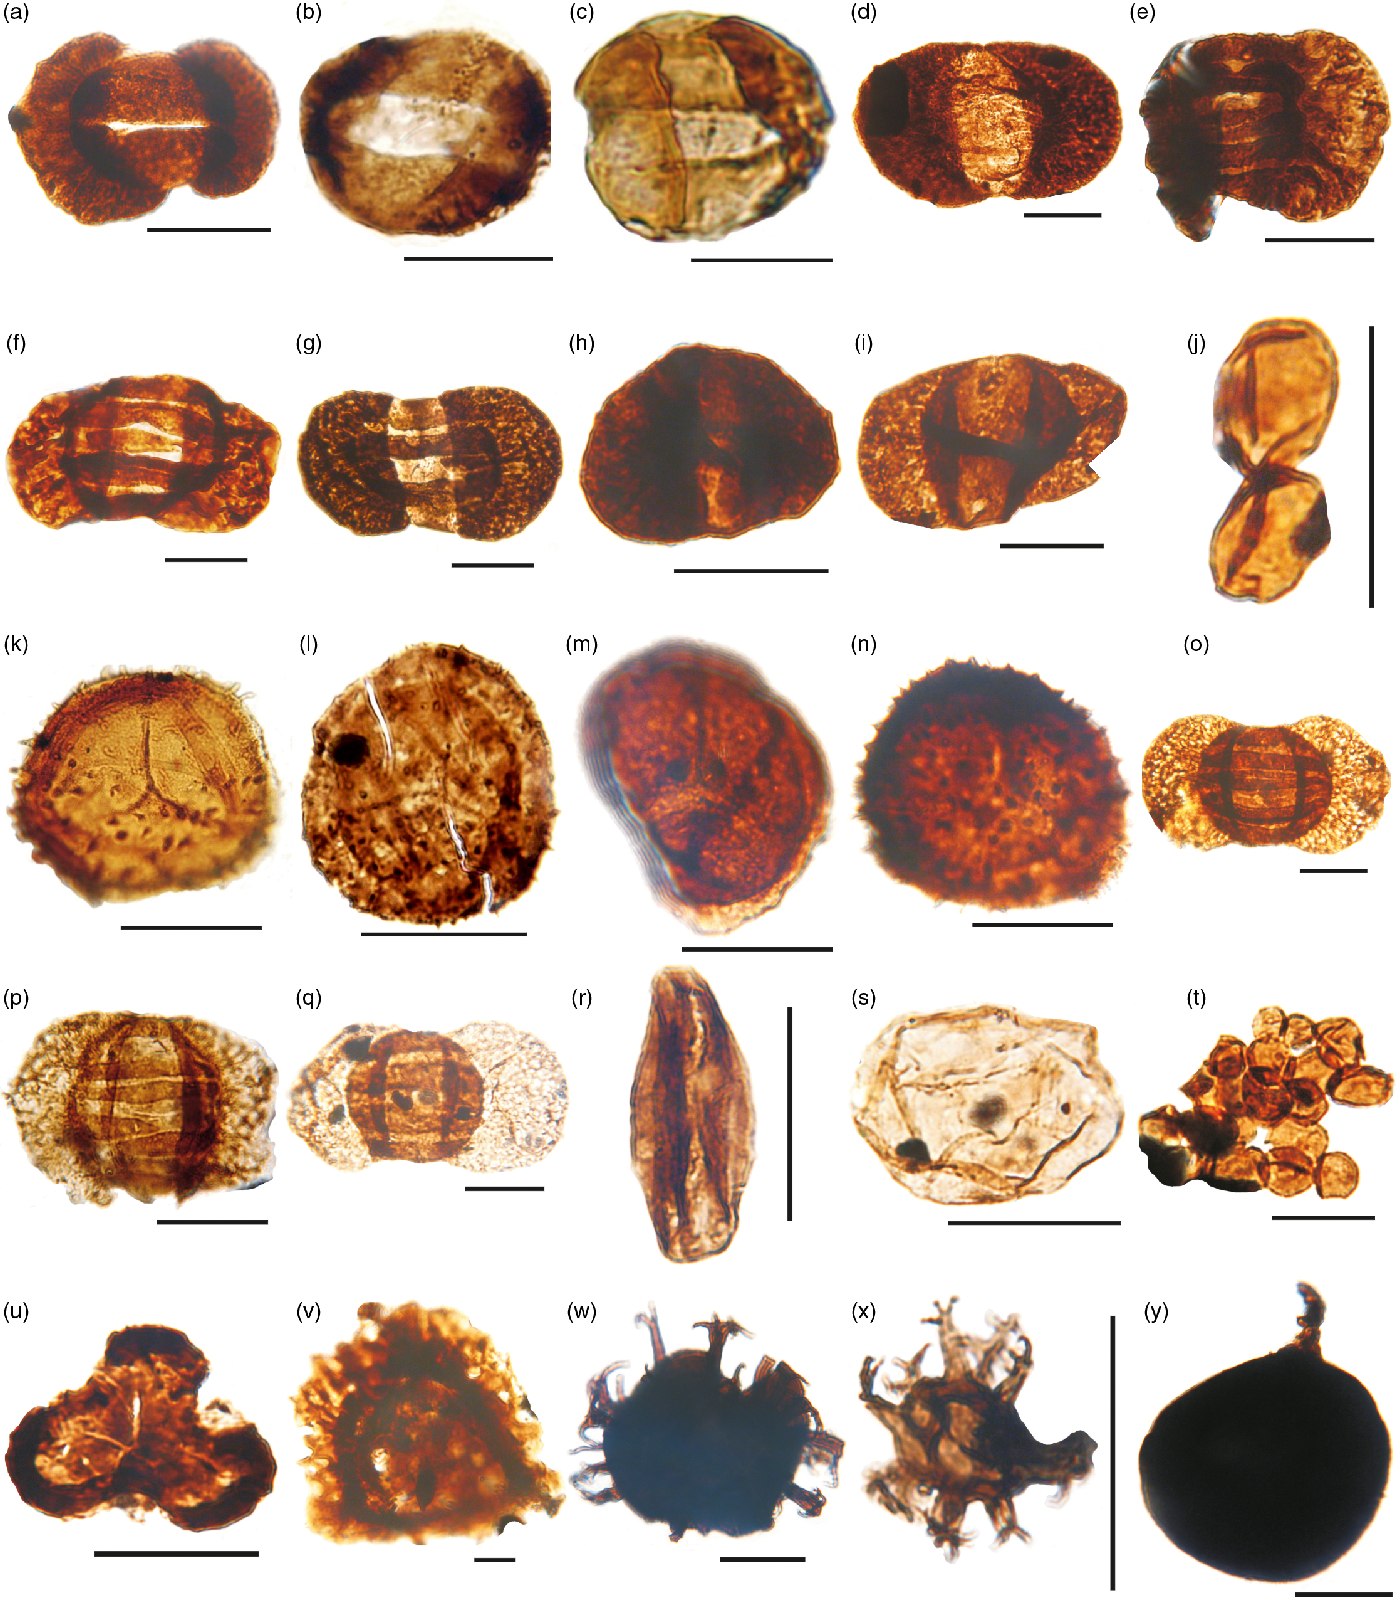
The biostratigraphic recognition of the P/T boundary in the HCM is hampered by rather scarce and limited palynological and conchostracans data. Nevertheless, the late Permian miospores of Lueckisporites virkkiae Bc (palynological norm after Visscher, Reference Visscher1971) have been documented in the uppermost Zechstein strata (including terrestrial ‘PZt’ cycle), while the occurrence of the Early Triassic microspores of the Lundbladispora obsoleta–Protohaploxypinus pantii biozone is confined to the Jaworzna Formation (Fig. 2; Fijałkowska, Reference Fijałkowska1994 a, b). Lately, Marcinkiewicz et al. (Reference Marcinkiewicz, Fijałkowska-Mader and Pieńkowski2014) have considered the extension of the L. obsoleta – P. pantii zone to late Changhsingian time.
It is noteworthy that the Siodła Formation, located between typical Zechstein and Buntsandstein deposits, is palynologically barren. Some attempts to utilize conchostracans stratigraphy in resolving the P/T boundary in the HCM area were made by Ptaszyński & Niedźwiedzki (Reference Ptaszyński and Niedźwiedzki2004), who described conchostracan specimens of ‘Falsisca eotriassica’ Kozur et Seidel and ‘Falsisca postera’ Kozur et Seidel from the Jaworzna Formation cropping out in the Zachełmie quarry. On this basis they proposed the late Permian age for the lower part of this unit. However, the significance of these fossils as a stratigraphic tool for the P/T boundary determination has been questioned by Nawrocki et al. (Reference Nawrocki, Pieńkowski and Becker2005), Becker (Reference Becker2015), and Scholze et al. (Reference Scholze, Schneider and Werneburg2016, Reference Scholze, Wang, Kirscher, Kraft, Schneider, Götz and Bachtadse2017). Scholze et al. (Reference Scholze, Schneider and Werneburg2016) postulate that morphology and the stratigraphic range of ‘Falsisca postera’ is concordant with Palaeolimnadiopsis vilujensis Varentsov, which is an indicative fossil for the Early Triassic Epoch. In turn, the Early Triassic age of the uppermost Jaworzna Formation is confirmed by a specimen of ‘Falsisca cf. verchojanica Molin’ co-occurring with ‘Falsisca postera’ (Ptaszyński & Niedźwiedzki, Reference Ptaszyński and Niedźwiedzki2004). Furthermore, the cited authors recognized Euestheria gutta (Lutkevitch) and Euestheria gutta oertlii Kozur in the considered lithostratigraphic unit, indicating its Lower Triassic stratigraphic position (compare Scholze et al. Reference Scholze, Schneider and Werneburg2016, Reference Scholze, Wang, Kirscher, Kraft, Schneider, Götz and Bachtadse2017).
Megaspore analysis of samples from the HCM by Fuglewicz (Reference Fuglewicz1980) provided assembly of the Olenekian index taxa of the Trielites polonicus - Pusulosporites populosus zone found within Middle Buntsandstein. Lack of the late Permian – Early Triassic index megaspore Otyniosporites eotriassicus led Fuglewicz to conclude that there are no clear Lower Buntsandstein deposits in the HCM area. The so-called ‘barren interval’ situated below strata containing T. polonicus – P. populosus assembly was correlated with the so-called ‘inter-oolitic’ beds (lower part of the Middle Buntsandstein). Recent data from neighbouring Nida Trough (SW of the HCM) indicate that the ‘barren interval’ can be correlated with the Otynisporites eotriassicus zone, and therefore confirms the occurrence of the Lower Buntsandstein in the area (compare Marcinkiewicz et al. Reference Marcinkiewicz, Fijałkowska-Mader and Pieńkowski2014).
A valuable tool in chronostratigraphic correlations between different environments is magnetostratigraphy, as it assumes synchronicity of the magnetic polarity reversals and is particularly helpful in correlating biostratigraphically barren terrestrial sequences. Magnetostratigraphic studies of the P/T boundary in the HCM were performed by Nawrocki (Nawrocki, Reference Nawrocki1997; Nawrocki et al. Reference Nawrocki, Kuleta and Zbroja2003), who located it at the base of the Tbn1 magnetozone (=LT1n) correlated with the Siodła and Jaworzna formations.
4. Materials and methods
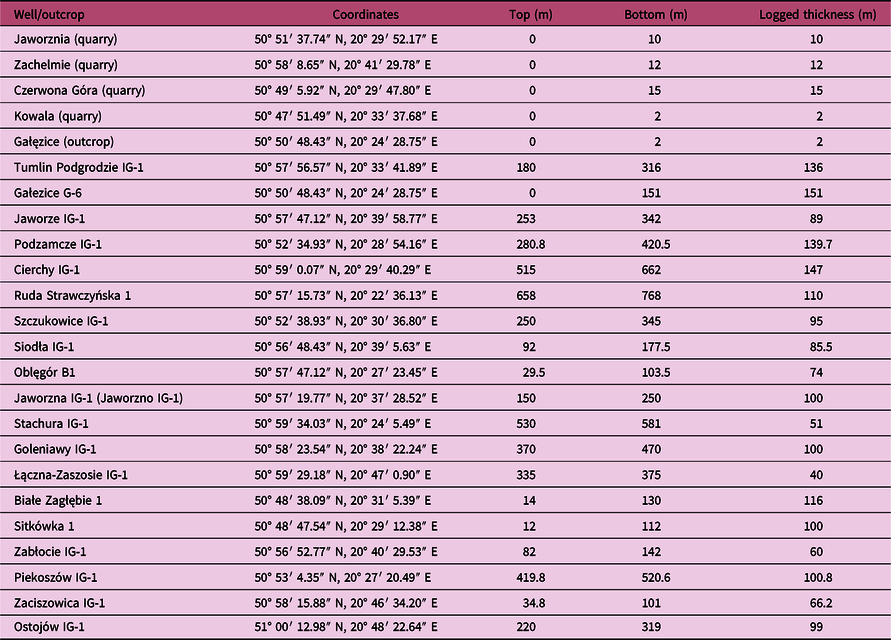
Most of the data in this paper come from several shallow, fully cored, boreholes drilled between 1950 and 1990. They provide a continuous sedimentary record of the Zechstein and Buntsandstein in the studied area. Representative borehole materials have been selected after careful review of geological maps of the studied region, and archival documentation of over 70 wells from the HCM and its margins. Nearly 1900 m of core from 19 wells and 5 outcrops have been logged in detail (1:50 or 1:100 scale, depending on core preservation; see Table 1, all depths in metres below ground level), including the lithological and sedimentological features. Grain size, colour (according to Munsell colour chart), sedimentary structures and reaction with HCl were noted. As the HCM region is highly faulted, special attention was paid to recognizing tectonic contacts between individual units. Diagnostic features for each unit were described in detail and then integrated and simplified to create the stratigraphic scheme, with focus on the P/T transition interval. The sedimentary environmental conditions of lithostratigraphic units and their genetic interpretations have been described largely based on published works (Kowalczewski & Rup, Reference Kowalczewski and Rup1989; Kuleta & Zbroja, Reference Kuleta, Zbroja, Skompski and Żylińska2006; Trela & Fijałkowska-Mader, Reference Trela and Fijalkowska-Mader2017). Detailed descriptions of all units can be found in online Supplementary Material 1 (available at http://journals.cambridge.org/geo).
Analysed boreholes and outcrops with top and bottom depths, and thicknesses of logged intervals. Coordinates have been adjusted for displaying in Google Earth

5. Vertical and lateral distribution of lithostratigraphic units
The upper Permian (upper Zechstein) and lowermost Triassic (lowermost Buntsandstein) sedimentary succession in the northwestern and western part of the HCM is dominated by fine- to medium-grained siliciclastics and mixed calcareous-siliciclastics with a contribution from anhydrides, limestones, dolomites and conglomerates/breccia. The transition from the Zechstein to Buntsandstein deposits refers to a progradational sequence, representing a shift from the coastal and continental sabkhas to distal mudflats and fluvial channels. The underlying carbonates and evaporates document the Zechstein marine ingressions in the HCM (Kuleta & Zbroja, Reference Kuleta, Zbroja, Skompski and Żylińska2006) and development of shallow-marine to coastal sabkha settings (Kowalczewski & Rup, Reference Kowalczewski and Rup1989; Kasprzyk, Reference Kasprzyk1995), and are not discussed here in detail.
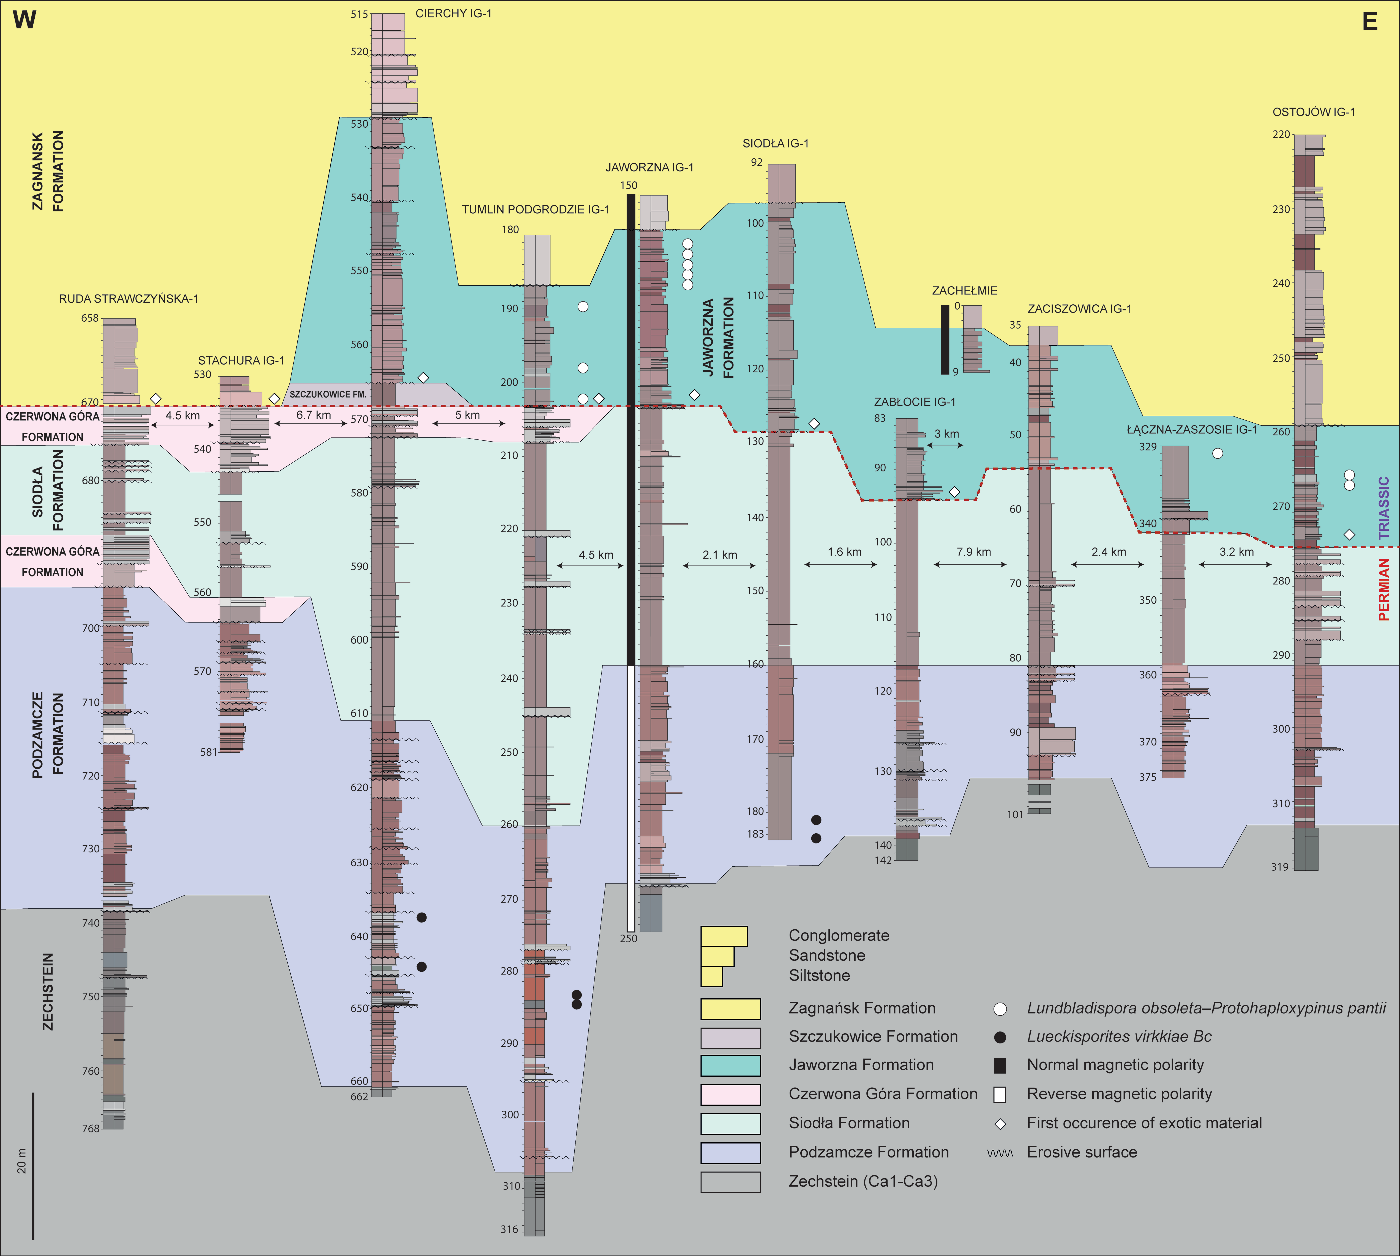
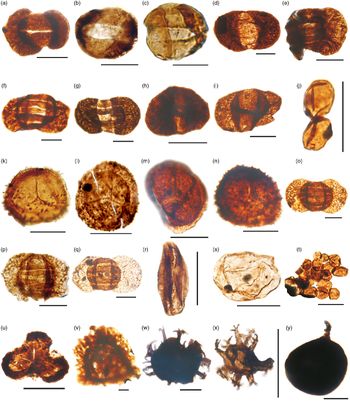
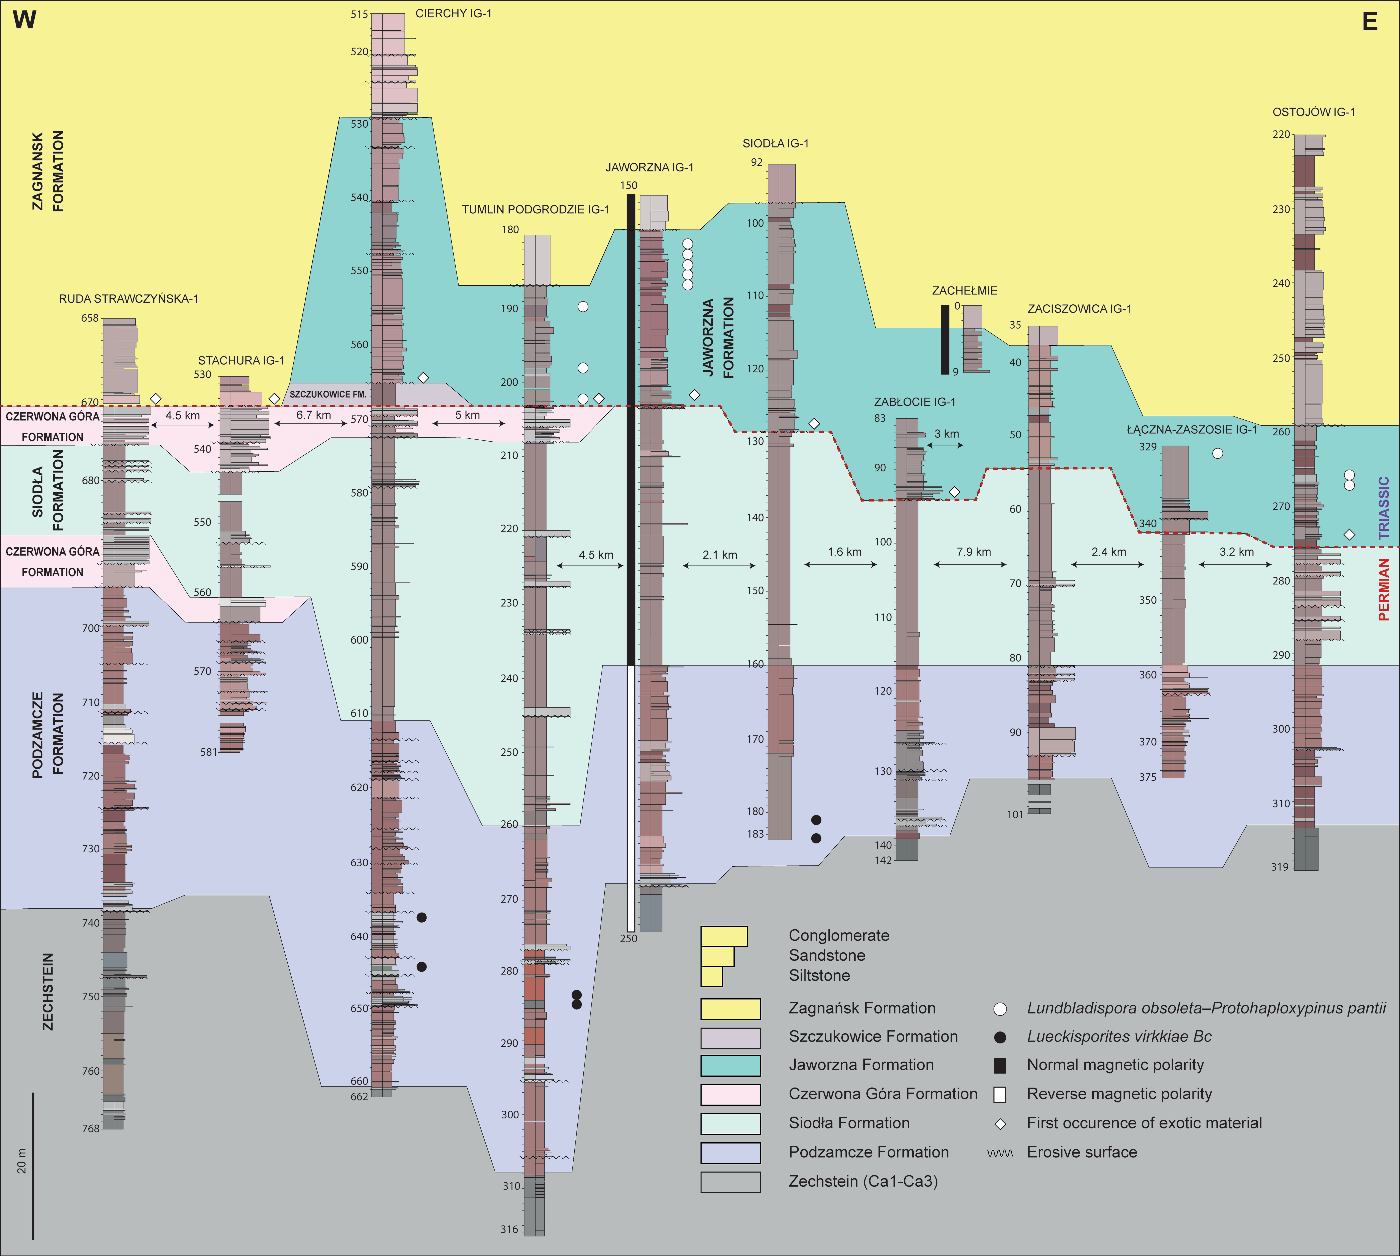
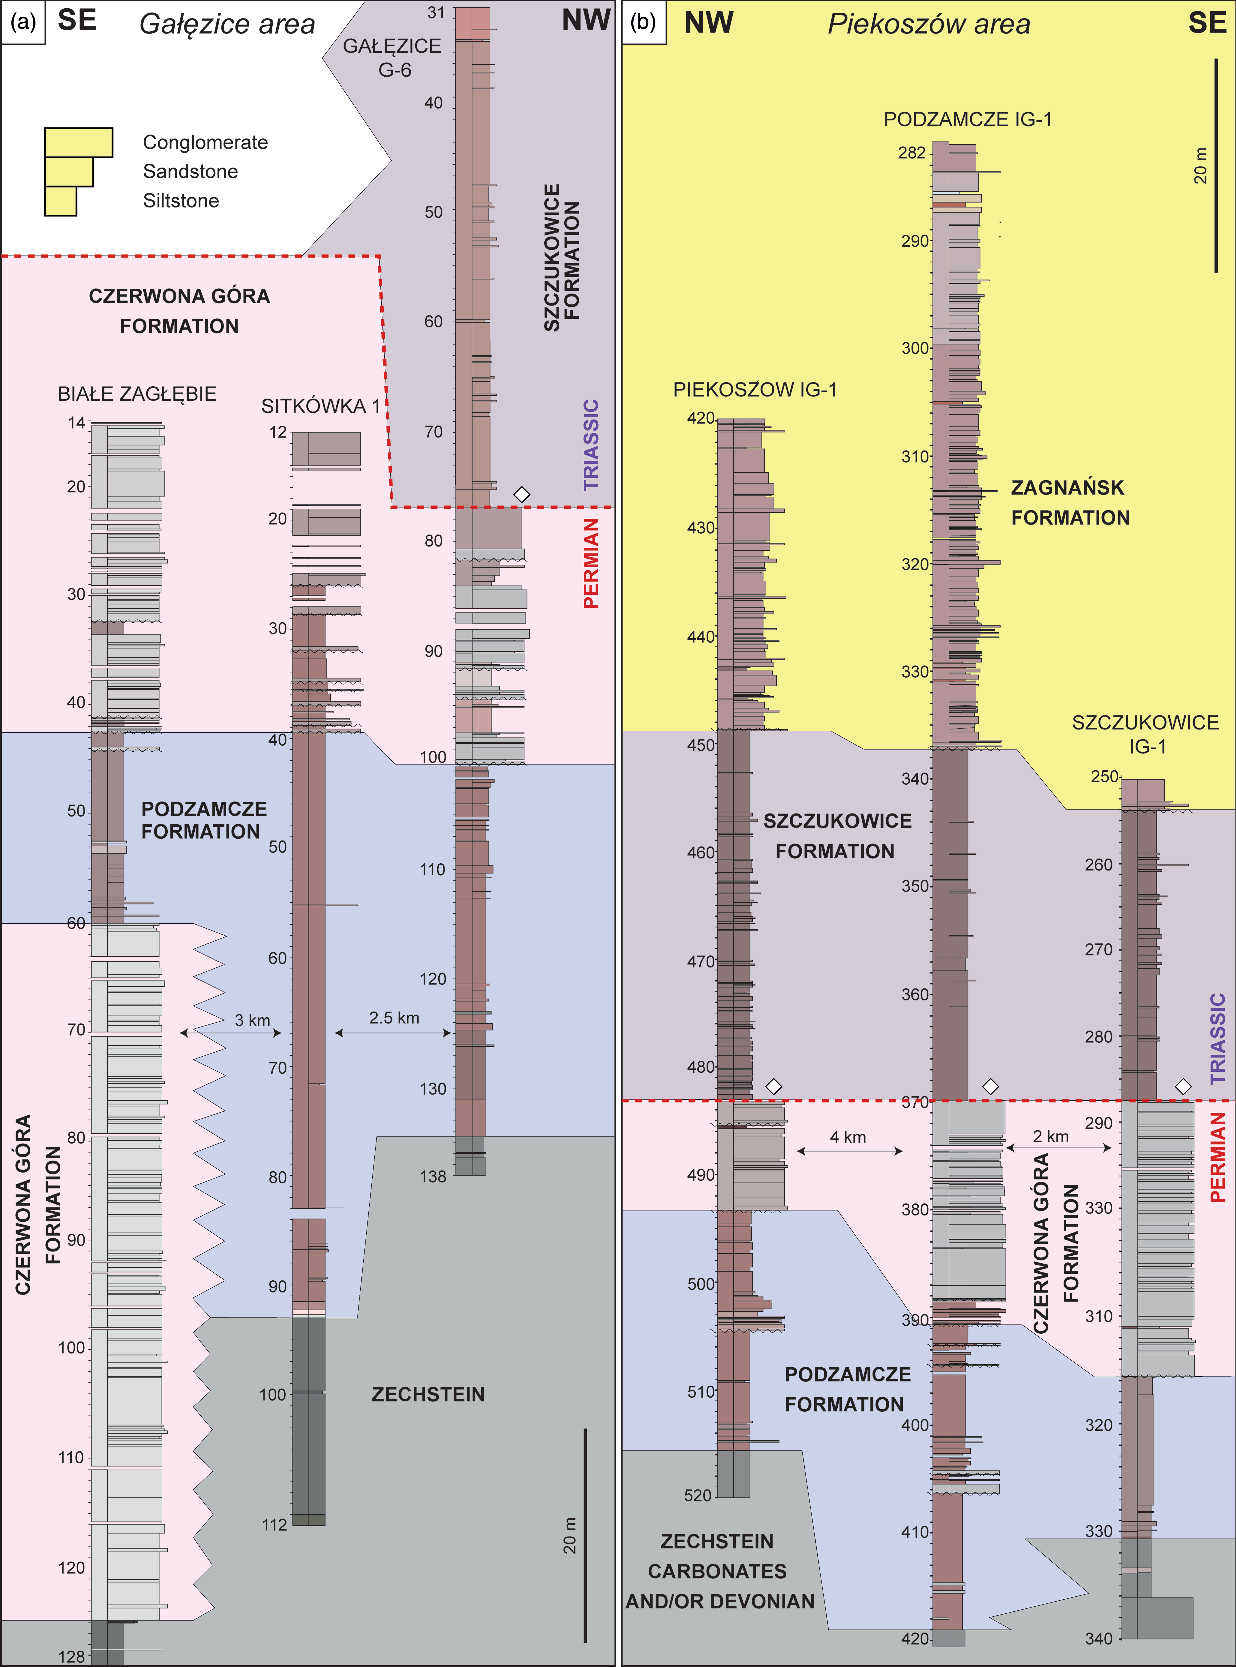
The whole studied interval was subdivided into five formations. Three of them – the Siodła, Jaworzna and Szczukowice formations – were previously named by Kuleta & Zbroja (Reference Kuleta, Zbroja, Skompski and Żylińska2006), while the Podzamcze and Czerwona Góra formations are proposed in this paper (Fig. 2). They provide insight into the evolution of stratigraphic architecture and depositional environments across the P/T boundary in the southeastern CEB. The formal lithostratigraphic definitions of older informal and newly proposed units are presented in the online Supplementary Material 1 and follow the rules and procedures set by the International Subcommission on Stratigraphic Classification of International Union of Geological Sciences (IUGS) Commission on Stratigraphy (Murphy & Salvador, Reference Murphy and Salvador1999). Diagnostic features of all described formations are illustrated in Figures 3 and 4. A temporal and spatial distribution of lithostratigraphic units in the studied area is presented in Figures 5 and 6. The Permian–Triassic index palynomorphs are depicted in Figure 7.
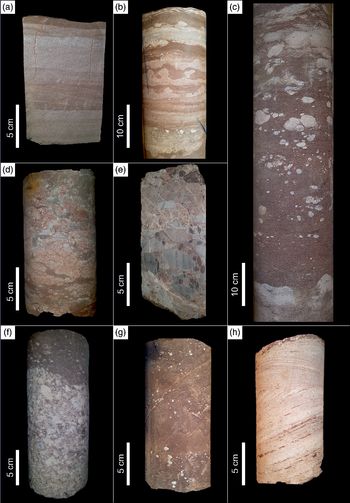
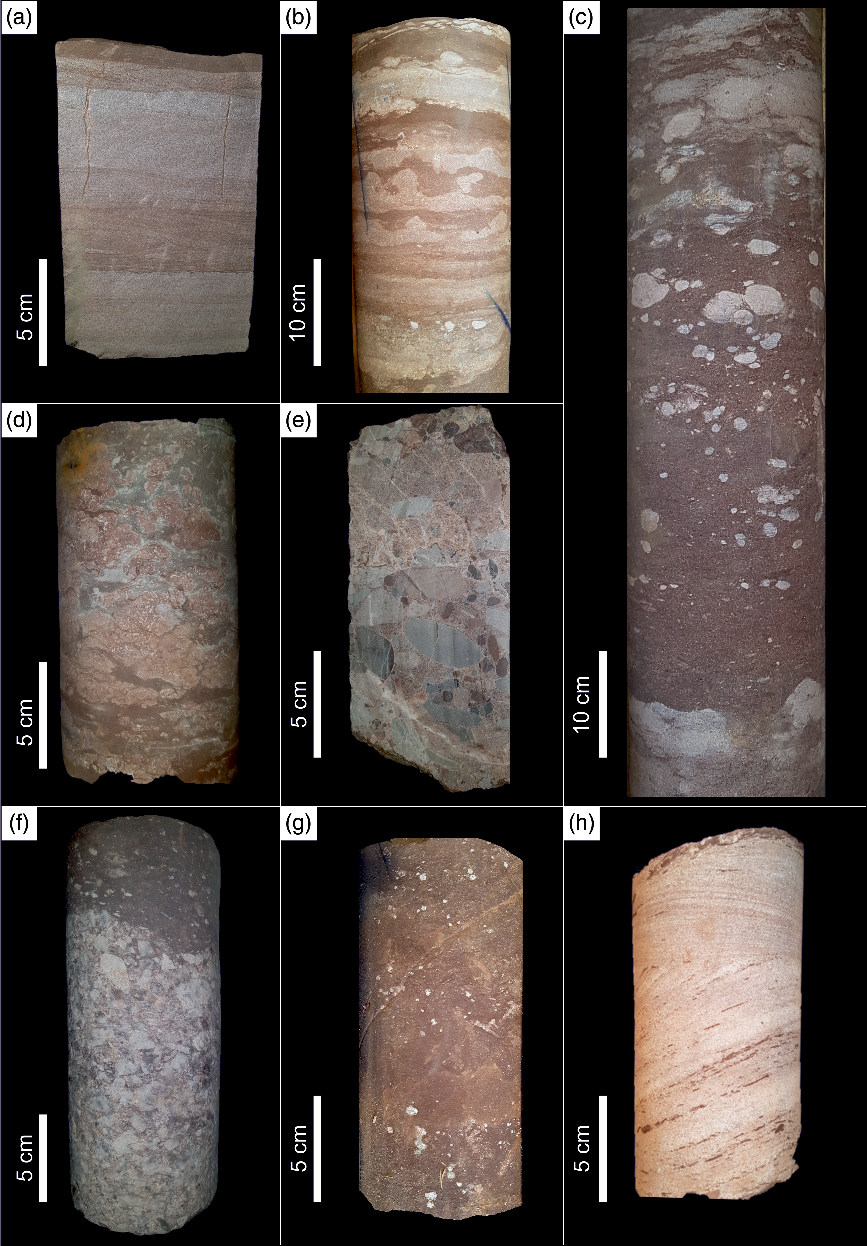
Selected diagnostic features of the described formations. (a) Horizontal and ripple-cross laminated, calcareous, fine-grained sandstones of the Podzamcze Formation (Cierchy IG-1 well, 639 m). (b) Wavy laminated and deformed heterolith of Podzamcze Formation (Podzamcze IG-1 well, 400.8–401.8 m). (c) Pedogenic nodules and calcrete horizon of Siodła Formation (Goleniawy IG-1 well, 416.5 m) (d) Pedogenically altered siltstone with pedogenic nodules and calcretes, Siodła Formation (Siodła IG-1 well, 141–142 m). (e) Clast-supported conglomerate of Czerwona Góra Formation (Stachura IG-1, 537.5 m). (f) Clast- and matrix-supported conglomerate of Czerwona Góra Formation, lower and upper parts of the coreslab respectively (Ruda Strawczyńska IG-1, 659 m). (g) Red, non-calcareous, micaceous, siltstone with small rhizoconcretions, Szczukowice Formation (Podzamcze IG-1, 338 m). (h) Cross-laminated medium-grained sandstone with red siltstone clasts of Jaworzna Formation (Triassic) (Tumlin-Podgrodzie, 205 m).
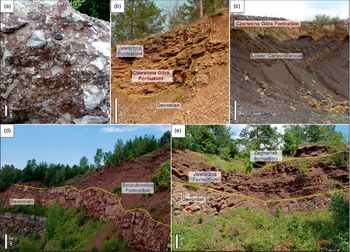
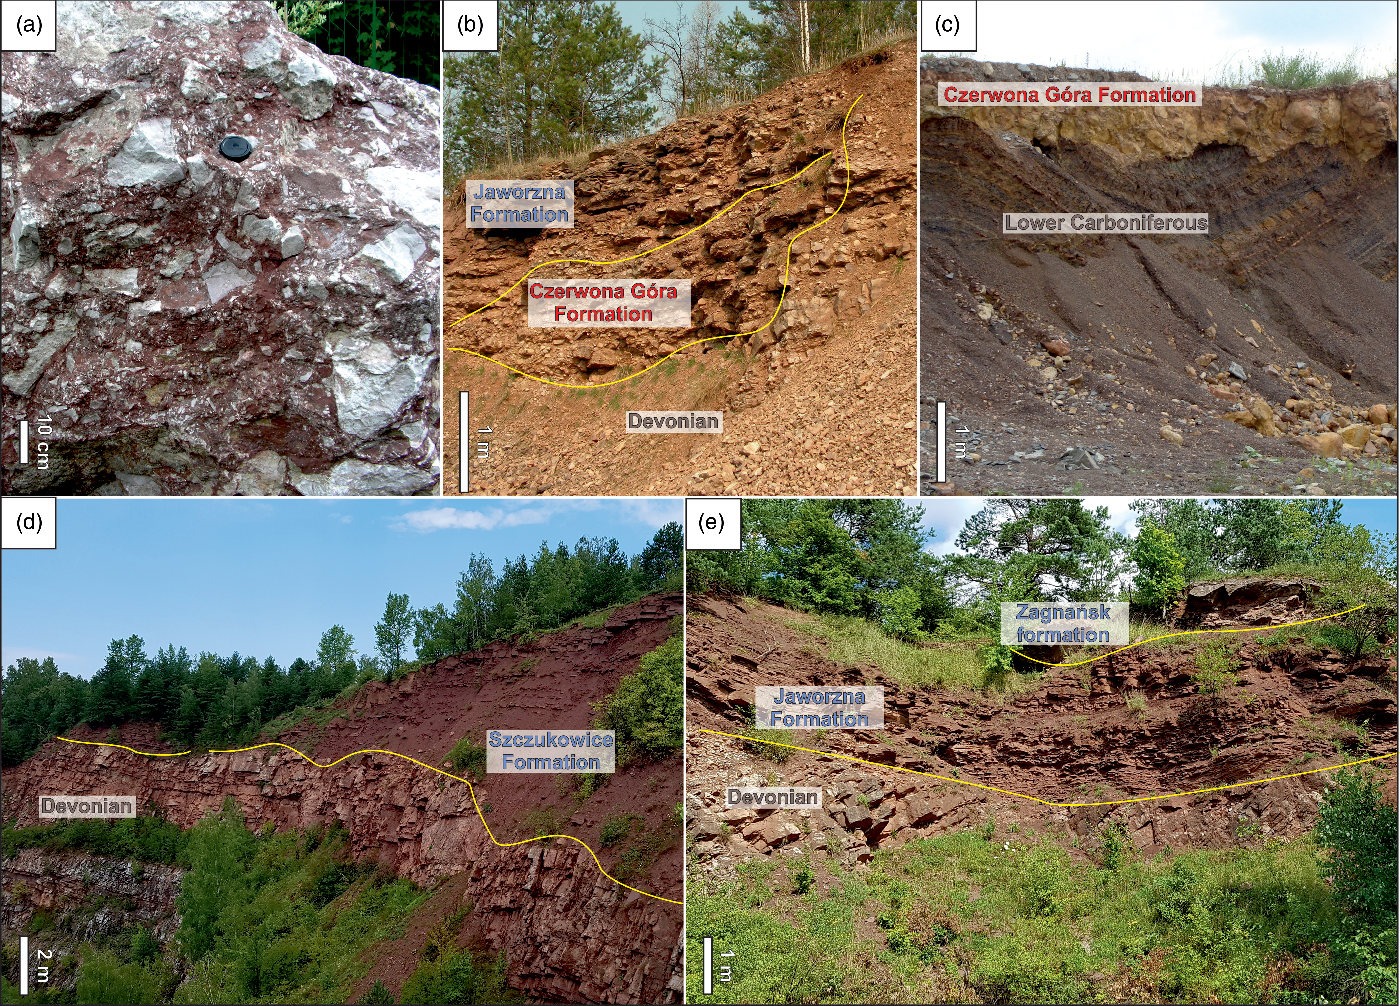
Field photograph of the (a) Czerwona Góra Formation conglomerate in Czerwona Góra quarry (reference section); note angular and subangular carbonate clasts in the red matrix; (b) erosive contacts between Devonian carbonates, and Czerwona Góra and Jaworzna formations (Zachełmie quarry); (c) erosive contact of Czerwona Góra Formation with lower Carboniferous shales cropping out in Kowala quarry; (d) contact of Devonian limestones with Szczukowice Formation (Jaworznia quarry); and (e) erosive contacts between Devonian carbonates and Jaworznia Formation; the latter is cut by overlying Zagnańsk Formation (Zachełmie outcrop).
Cross-section of the northern part of the studied area (see Fig. 1c for transect line). Palynology from Fijałkowska-Mader (Reference Fijałkowska1994a, b) supplemented with archival, unpublished data. Magnetic polarity after Nawrocki (Reference Nawrocki1997) and Nawrocki et al. (Reference Nawrocki, Kuleta and Zbroja2003).
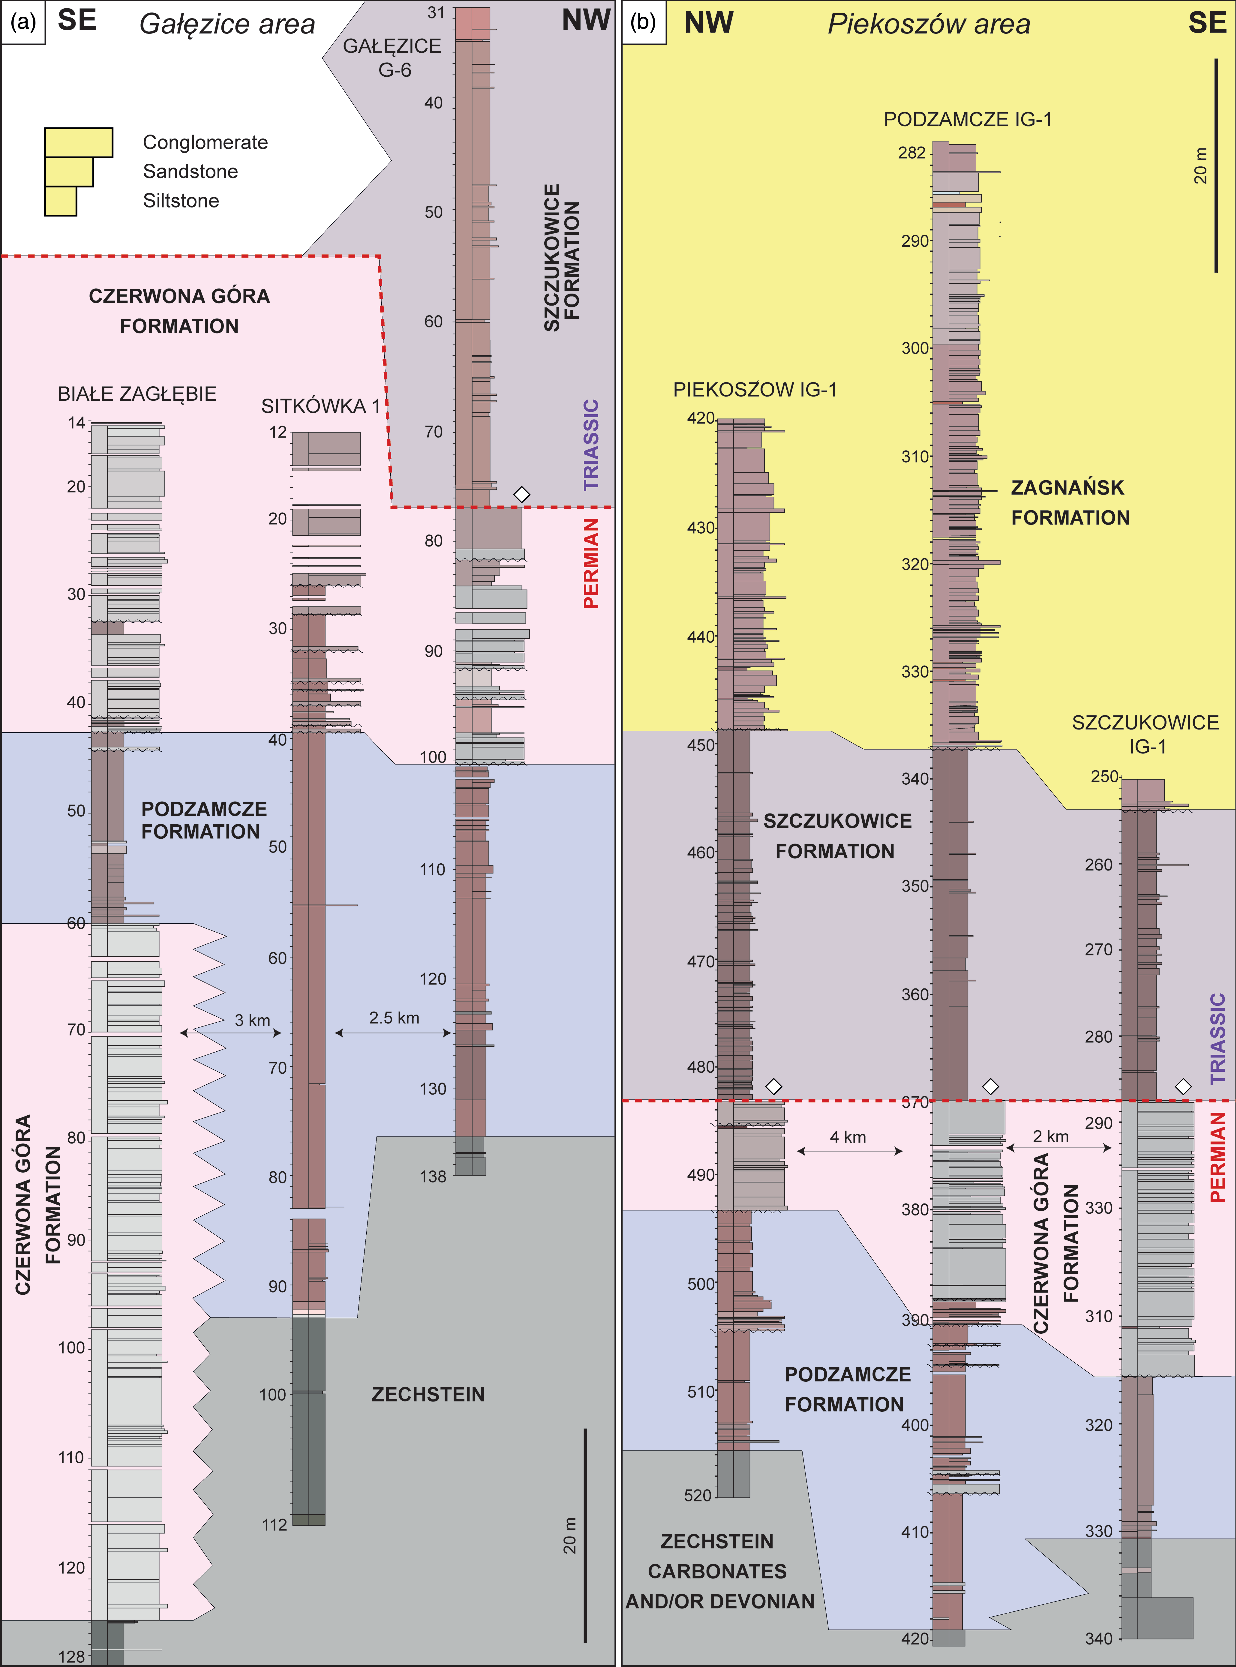
Cross-sections for boreholes drilled in (a) Gałęzice and (b) Piekoszów areas (see Fig. 1c for transect lines).
Miospores of the Permian–Triassic transition interval. (a–j) Assemblage of the late Permian Lueckisporites virkkiae Bc palynological subzone; Tumlin–Podgrodzie IG 1 well, depth: (a–f, h) 283.4 m and (g, i, j) 284.6 m. (a) Lueckisporites virkkiae Potonié et Klaus norm (N) Ab after Visscher (Reference Visscher1971), (b) L. virkkiae NBb, (c) L. virkkiae NBc, (d) Strotersporites sp., (e) Protohaploxypinus cf. jabobii (Jansonius) Hart, (f) Protohaploxypinus sp., (g) Lunatisporites cf. gracilis (Jansonius) Fijałkowska, (h) Jugasporites cf. lueckoides Klaus, (i) Gardenasporites cf. moroderi Klaus and (j) Reduviasporonites catelunatus Wilson al. Tympanicysta. (k–y) Assemblage of the latest Permian? – early Triassic Lundbladispora obsoleta-Protohaploxypinus pantii zone: (k, n, o, q, s, t) Jaworzna IG 1 well, depth 157.1 m; (l, m, p, r, u, v) Tumlin-Podgrodzie IG 1 well, depth 190.7 m, (w–y) Tumlin-Podgrodzie IG 1 well, depth 198.2 m. (k) Lundbladispora obsoleta Balme, (l) L. willmotti Balme, (m) Densoisporites playfordi (Balme) Dettmann, (n) Kraeuselisporites cuspidus Balme, (o) Protohaploxypinus pantii (Jansonius) Orłowska-Zwolińska, (p) P. cf. samoilovichii (Jansonius) Hart, (q) Lunatisporites noviaulensis (Leschik) Scheuring, (r) Cycadopites follicularis Wilson et Webster, (s) Schizospora sp., (t) aff. Microsporonites sp., (u–y) reworked palynomorphs: (u) Tripartites sp., (v) aff. Ancyrospora sp., (w) Ordovicidium sp., (x) Multiplicisphaeridium sp., (y) Chitinozoa indet. Scale bar 30 μm.
The Czerwona Góra Formation consists of red to greyish clast- and matrix-supported calcareous conglomerates, breccias and poorly sorted pebbly sandstones. They form two distinctive horizons: the lower and upper Czerwona Góra Formation (Fig. 2; online Supplementary Material 1). The thickness of this formation is highly variable and changes from 2 m to more than 130 m. Its lower and upper boundaries are erosive. The lowermost conglomerates of the Czerwona Góra Formation are considered to be the Rotliegend deposits, while most of the unit is within the Zechstein Group (see online Supplementary Material 1). Conglomerates and breccias of this unit are widespread in the HCM and occur in outcrops and in boreholes (Fig. 4a–c). At some distance from the HCM massif, Czerwona Góra conglomerates interfinger with Podzamcze and Siodła formations. Czerwona Góra conglomerates are interpreted as deposits of gravel-dominated braided rivers and rock avalanches of alluvial fan (Kostecka, Reference Kostecka1962; Głazek & Romanek, Reference Głazek, Romanek, Piątkowski and Wagner1978) or fan delta setting (Zbroja et al. Reference Zbroja, Kuleta and Migaszewski1998). However, some conglomerates and breccias may represent regoliths (Szulczewski, Reference Szulczewski and Skompski1995) or reworked older conglomerates (Szulc et al. Reference Szulc, Becker, Mader and Skompski2015)
The Podzamcze Formation is made up of a thick (up to 130 m) complex of red and brown, rarely grey, mudstones and calcareous sandstones, commonly displaying disturbed heterolitic features (Fig. 3a, b; see online Supplementary Material 1). A subordinate but distinctive lithofacies in this succession are laminar and nodular calcrets, palustrine carbonates and dark-red clay-rich weathered intervals. This unit occurs along the northern, northwestern and western margins of the HCM where it rests on the Zechstein limestones, or locally (nearby Gałęzice) on the lower conglomerates of the Czerwona Góra Formation (Fig. 6a). The palynological data clearly indicate that the stratigraphic position of the Podzamcze Formation is confined to the upper Zechstein Group (Fijałkowska, Reference Fijałkowska1994 a; online Supplementary Material 1). Its upper boundary is erosive with the upper conglomerates of the Czerwona Góra Formation in the western HCM or continuous with the overlying Siodła Formation in the northern HCM. The Podzamcze Formation is interpreted as a succession representing mudflats of coastal to continental sabkha/playa eroded by ephemeral streams (Kuleta & Zbroja, Reference Kuleta, Zbroja, Skompski and Żylińska2006; Trela & Fijałkowska-Mader, Reference Trela and Fijalkowska-Mader2017).
The Siodła Formation consists of an up-to-80-m-thick succession of variegated, dusky red and often mottled calcareous siltstones and silty mudstones with conspicuous carbonate nodules and rare laminated calcretes (online Supplementary Material 1). Distinctive features of this unit are large rhizoids (developed as calcite tubules or root moulds) and rhizobrecciations (Fig. 3c, d). The subordinate lithotypes are sandy conglomerate and sandstone beds, up to 2 m thick. The Siodła Formation occurs in boreholes located along the northern and northwestern margins of the HCM (Fig. 5). Its lower contact with the underlying Podzamcze Formation is continuous, while the upper contact with the overlying Jaworzna Formation and the uppermost conglomerates of the Czerwona Góra Formation is erosive (Fig. 5). The stratigraphic position of the Siodła Formation was confined to the uppermost Permian strata due to the palynological material from the under- and overlying lithostratigraphic units (the Podzamcze and Jaworzna formations, respectively) and magnetostratigraphic data (online Supplementary Material 1). This succession represents pedogenically altered distal mudflats, developed in a playa–lake setting truncated by rare ephemeral streams (Kuleta & Zbroja, Reference Kuleta, Zbroja, Skompski and Żylińska2006; Trela & Fijałkowska-Mader, Reference Trela and Fijalkowska-Mader2017).
The Jaworzna Formation refers to a red sandstone and mudstone unit, locally interbedded with thin (< 1 m) dark-red or rarely grey clayey mudstones and claystones (Fig. 4b,e; online Supplementary Material 1). The lower part of this formation is made up of a sandstone-dominated interval with sandy conglomerates at the base, commonly with exotic material (Fig. 5). The Jaworzna Formation occurs only in the northern part of the HCM, where its lower and upper contacts are erosive with the Siodła and Zagnańsk formations, respectively (Fig. 5). The thickness of this unit ranges from 1 m up to 30 m. The biostratigraphic and magnetostratigraphic data locate the Jaworzna Formation in the lowermost Triassic strata (Fijałkowska, Reference Fijałkowska1994 a; Nawrocki et al. Reference Nawrocki, Kuleta and Zbroja2003; online Supplementary Material 1). Sandstones and mudstones of this unit were deposited on distal alluvial fan by braided rivers, flood sheets and terminal splays (Trela & Fijałkowska-Mader, Reference Trela and Fijalkowska-Mader2017).
The Szczukowice Formation refers to micaceous and non-calcareous siltstones locally displaying pedogenic features such as small calcareous nodules and rhizoids (Fig. 3g). They form a succession ranging in thickness from 3 m to more than 60 m. In some places (e.g. in Jaworznia quarry; see Fig. 4d) fine-grained intervals are truncated by thin fine-grained micaceous sandstone packages with an overall thickness increasing upwards. The Szczukowice Formation predominates in the western part of the studied area and is a stratigraphic equivalent of the Jaworzna Formation (Fig. 5). It rests on the upper conglomerates of the Czerwona Góra Formation or older Palaeozoic strata (e.g. Fig. 4d), while its top is truncated by fluvial sandstones of the Zagnańsk Formation representing another stage of basin evolution, which is outwith the scope of this paper. The Szczukowice Formation is interpreted as fluvial–lacustrine deposits (Kuleta & Zbroja, Reference Kuleta, Zbroja, Skompski and Żylińska2006). As the Szczukowice Formation is a lateral equivalent to the Jaworzna Formation, it is plausible that this unit represents a distal floodplain with locally developed terminal splays.
6. Stratigraphic proxies of the P/T boundary in the HCM and its correlation with the western CEB
It is difficult to indicate the precise location of the P/T boundary in the HCM because index fossils are scarcely distributed; however, detailed lithostratigraphic analysis can provide necessary data for the recognition of the stratigraphic architecture of the upper Permian and lowermost Triassic succession. The chronostratigraphic subdivision of the P/T transition in the HCM area was mainly established based on the occurrence of miospores belonging to the Lueckisporites virkkiae Bc zone and spore-pollen assemblage of the Lundbladispora obsoleta – Protohaploxypinus pantii zone (Fijałkowska, Reference Fijałkowska1994 a, b) identified in the Podzamcze and Jaworzna formations, respectively (Fig. 5). The separating Siodła Formation is devoid of any biostratigraphic data, but reveals normal magnetic polarity and is therefore correlated with the Tbn1 magnetozone (Nawrocki et al. Reference Nawrocki, Kuleta and Zbroja2003). The overlying Jaworzna Formation yielded conchostracans of ‘Falsisca postera’ and ‘F. vechojanica’ that, according to Ptaszyński & Niedźwiedzki (Reference Ptaszyński and Niedźwiedzki2004), indicate the Permian–Triassic transition zone. Scholze et al. (Reference Scholze, Schneider and Werneburg2016) confine the stratigraphic range of these taxa to the Lower Triassic. The palaeomagnetic studies of rock samples collected from the Jaworzna IG-1 and Goleniawy IG-1 wells and the Zachełmie quarry locate the Jaworzna Formation, together with underlying Siodła Formation, within the normal Tbn1 polarity magnetozone (Nawrocki et al. Reference Nawrocki, Kuleta and Zbroja2003) that corresponds to the T1n magnetozone of Szurlies et al. (Reference Szurlies, Bachmann, Menning, Nowaczyk and Käding2003) in Germany and the LT1n magnetozone in the global magnetic composite scale of Hounslow & Balabanov (Reference Hounslow, Balabanov, Lucas and Shen2018). In contrast, the Podzamcze Formation underlying the Siodła Formation is characterized by the reverse polarity and is assigned by Nawrocki (Reference Nawrocki1997) and Nawrocki et al. (Reference Nawrocki, Kuleta and Zbroja2003) to the uppermost Permian reverse ‘PZr1’ magnetozone, which is equivalent to the CG2r and LP3r magnetozones of Szurlies (Reference Szurlies, Gąsiewicz and Słowakiewicz2013) and Hounslow & Balabanov (Reference Hounslow, Balabanov, Lucas and Shen2018), respectively.
The available bio- and magnetostratigraphic data summarized above allow the correlation of considered formations with well-defined German Zechstein (in older literature known as the Z1–Z7 cyclothems) and Buntsandstein lithostratigraphical units. As such, the Jaworzna Formation can be correlated with the Upper Fulda Formation (upper Z7) and lower part of the Calvörde Formation (or Eck Formation in the case of southern Germany) of the Lower Triassic strata (compare Scholze et al. Reference Scholze, Wang, Kirscher, Kraft, Schneider, Götz and Bachtadse2017). Given the location of the Siodła Formation below the Jaworzna Formation and correlation of its base with the lower boundary of the Tbn1 magnetozone (Nawrocki et al. Reference Nawrocki, Kuleta and Zbroja2003), it appears plausible to correlate this unit with the uppermost Permian strata (uppermost Changhsingian). Considering the abovementioned proxies, the P/T boundary in the HCM can be placed at the base of the Jaworzna Formation, and its lateral equivalent of the Szczukowice Formation within the lower part of the Tbn1 (= LT1n) magnetozone (Fig. 2), which is consistent with upper Permian and Lower Triassic magnetostratigraphy (Szurlies, Reference Szurlies2007; Hounslow & Balabanov, Reference Hounslow, Balabanov, Lucas and Shen2018). It therefore appears that the Siodła Formation corresponds to the uppermost Permian Rewal Formation in the Polish Lowland, while the Jaworzna and Szczukowice formations can be correlated with the Baltic Formation (Fig. 2; see Wagner, Reference Wagner1994). However, it is noteworthy that the upper contact of the Siodła Formation with the overlying Jaworzna and Czerwona Góra formations is erosive, and a stratigraphic gap between these units can be considered (Figs 4b, 5). In this scenario, this hiatus may correspond to the diachronous gap postulated by Ptaszyński & Niedźwiedzki (Reference Ptaszyński and Niedźwiedzki2006) that roughly included the Z5 to lower Z7 formations or even the Z3–Z4 formations in the eastern localities. The erosive truncation at the base of the Jaworzna Formation might have resulted in the juxtaposition of two normal magnetozones, that is, Tbn1 of the Jaworzna Formation and the upper Zechstein normal magnetozone recorded in the Siodła Formation that might be coeval to EV2n and CG2n in the Netherlands and Central Germany, respectively (Szurlies et al. Reference Szurlies, Gąsiewicz and Słowakiewicz2013). In such a scenario, the Siodła Formation could be correlated with the PZ4 cyclothem in the Polish Lowland (Fig. 2; see Wagner, Reference Wagner1994).
The lithological features of the Podzamcze and Siodła formations in the HCM clearly indicate that they form the latest Permian progradational succession truncated by the conglomerates of the upper Czerwona Góra Formation and basal sandstones of the Jaworzna Formation (Figs 2–5). The continental facies of the Podzamcze Formation represent sabkha deposits grading upwards into compound calcisols with calcretes of the Siodła Formation developed in a playa-like setting (Trela & Fijałkowska-Mader, Reference Trela and Fijalkowska-Mader2017). This lithostratigraphic succession can be related to the late Permian climate shift from the arid/semi-arid to more humid state, which in the Polish Lowland part of the CEB started at the end of the PZ3 cyclothem (Fig. 2; Wagner, Reference Wagner1994).
A significant sedimentary change recorded by the upper conglomerates of the Czerwona Góra Formation and lowermost part of the Jaworzna Formation marks a rapid delivery of coarse-grained sediment close to the P/T boundary that was probably produced by a short-term tectonic event responsible for rejuvenation of topographic relief in the hinterland area. It is coeval with the Pfalzic tectonic phase recognized in the German part of the CEB (see Fuglewicz, Reference Fuglewicz1980) and the erosive gap in western Europe (Bourquin et al. Reference Bourquin, Durand, Diez, Broutin and Fluteau2007, Reference Bourquin, Bercovic, López-Gómez, Diez, Broutin, Ronchi, Durand, Arché, Linol and Amour2011). Conglomerates of the Czerwona Góra Formation represent mass-flow (rockfalls and cohesive debris flows) and braided stream deposits that are referred to the alluvial fan (Kostecka, Reference Kostecka1962) or fan delta settings (Zbroja et al. Reference Zbroja, Kuleta and Migaszewski1998). However, conglomerates and breccias developed close to the elevated carbonate bedrock seem to represent colluvial deposits, which is supported by their very poor sorting, presence of angular clasts and a limited extent. As such, due to localized presence in the sedimentary record, often bounded by elevated blocks (e.g. Oblęgór B1 or Białe Zagłębie1 wells), these deposits have only limited stratigraphic significance. The westwards progradation of the upper conglomerates was probably closely associated with the local rejuvenation tectonic pulse at the P/T boundary. It was probably connected with the post-Variscan tectonic mobility of the HCM, and differences in the subsidence rate between juxtaposed depocenters (Kowalczewski & Rup, Reference Kowalczewski and Rup1989), preserved as syndepositional deformations in the upper Permian and Lower Triassic deposits (Szulc et al. Reference Szulc, Becker, Mader and Skompski2015). In the northern margin of the HCM, a sedimentary record of this event and basinwards facies progradation is represented by the sandstone-dominated part of the Jaworzna Formation, deposited as fluvial channel deposits of alluvial fans formed by avulsion of river channels and ephemeral streams. The floodplain facies of this fluvial system are represented by micaceous mudstones of the Szczukowice Formation, while the upper Jaworzna Formation seems to be produced by terminal splays, flood sheets and small channels in the distal fan. The broadening of the catchment area during Early Triassic time is marked by the presence of exotic material in the Jaworzna Formation represented by quartz, mica and igneous and metamorphic rock fragments. Such material is virtually absent from the upper Permian strata of the HCM area. The Jaworzna and Szczukowice formations are truncated by fluvial sandstones of the Zagnańsk Formation (Kuleta & Zbroja, Reference Kuleta, Zbroja, Skompski and Żylińska2006) that finish the upper Permian – Lower Triassic progradational succession in the HCM. There is no sedimentary evidence of marine facies (e.g. oolitic limestones) in the Lower Buntsandstein of the HCM area, which are indicators of transgressive pulses in the CEB (Becker, Reference Becker2005; Szulc, Reference Szulc2019).
A conspicuous influx of coarse-grained sediment close to the P/T boundary in the HCM indicates significant facies change, which may reflect either local tectonic activity, climatically driven instability of the terrestrial environment, or both. It is postulated that switching to greenhouse climate conditions during this interval was responsible for the Early Triassic vegetation loss facilitating enhanced terrestrial weathering and erosion (e.g. Newell et al. Reference Newell, Tverdokhlebov and Benton1999; Retallack, Reference Retallack1999; Sheldon, Reference Sheldon2006; Algeo & Twitchett, Reference Algeo and Twitchett2010; Sun et al. Reference Sun, Joachmski, Wignall, Yan, Chen, Jiang, Wang and Lai2012; Benton & Newell, Reference Benton and Newell2014), although some authors doubt such a significant floral turnover (e.g. Nowak et al. Reference Nowak, Schneebeli-Hermann and Kustatscher2019). However, there is no evidence of climate fluctuation during late Permian – Early Triassic time in the western CEB until the late Olenekian warming (see Bourquin et al. Reference Bourquin, Durand, Diez, Broutin and Fluteau2007, Reference Bourquin, Bercovic, López-Gómez, Diez, Broutin, Ronchi, Durand, Arché, Linol and Amour2011). It is noteworthy that an abrupt change to a fluvial-dominated depositional regime of the Lower Triassic Jaworzna Formation in the HCM can be interpreted as a sedimentary response to the interplay between local tectonic activity and reduced vegetation cover, as in the case of the southern Ural, Russian Platform and South Africa (see Newell et al. Reference Newell, Sennikov, Benton, Molostovskaya, Golubev, Minikh and Minikh2010, Reference Newell, Tverdokhlebov and Benton1999; Ward et al. Reference Ward, Montgomery and Smith2000). Additionally, a shift from well-developed calcisols with large root casts in the Siodła Formation to weakly developed initial soils (as inceptisols) in the overlying Szczukowice Formation correlates roughly with the Permian–Triassic decrease and/or change in composition of flora communities in continental settings (Fijałkowska-Mader, Reference Fijałkowska-Mader2015). In fact, the striking differences between palaeosols across the P/T boundary have been recorded worldwide in many sedimentary basins, for example, in Cis-Ural depressions, Antarctic, Sydney Basin and China (Fig. 1a; Retallack & Krull, Reference Retallack and Krull1999; Michaelson, Reference Michaelson2002; Thomas et al. Reference Thomas, Tabor, Yang, Myers, Yang and Wang2011; Kearsey et al. Reference Kearsey, Twitchett and Newell2012).
The coarse-grained facies, likely equivalent to the Jaworzna Formation (and maybe to the overlying Zagnańsk Formation) appear later in the central part of the CEB, implying diachroneity in the development of sand-dominated facies from the marginal to the central part of the basin, which is a common phenomenon in the terrestrial settings (e.g. Fuglewicz, Reference Fuglewicz1980). Such a diachroneity could support the presence of the P/T boundary within the classical Zechstein facies in a distal part of the CEB, whereas in its marginal zone the P/T boundary could be close to the traditional Zechstein–Buntsandstein boundary.
7. Conclusions
The integration of new and archival litho-, bio- and magnetostratigraphic data were used to redefine the Permian–Triassic stratigraphic framework in the southeastern part of the CEB. Individual formations (Podzamcze, Siodła, Czerwona Góra, Jaworzna and Szczukowice) have been redefined based on detailed sedimentological observations and confronted with available palynological data. As such, the Permian–Triassic interval represents a clear progradational sequence from the restricted marine environments to continental settings dominated by mudflats, distal floodplains and gravel-/sand-dominated alluvial fans and fluvial systems. Despite the scarce biostratigraphic record, palynological data confirmed the presence of a relatively continuous transition from the Permian to the Triassic Period. Such a transition is also visible in facies development, not only by the onset of sedimentation of the coarser Buntsandstein facies, but also by the disappearance of the well-developed calcretes and soils which were replaced by weakly developed initial soils with small rhizoids. These observations, combined with available palaeomagnetic and biostratigraphic data, allow us to place the P/T boundary between the Siodła and Czerwona Góra formations, and Szczukowice and its lateral equivalent of Jaworzna Formation. As such, by combining all data, it was possible to place the chronostratigraphic P/T boundary close to the lithostratigraphic Zechstein–Buntsandstein boundary.
Acknowledgements
This study was supported by PRELUDIUM grant to Karol Jewuła by the National Science Centre, Poland (2018/29/N/ST10/02028). We would like to thank Natalia Wasielka (Durham University), Dr Alex Finlay (Chemostrat, Welshpool, UK), Tim Sheehy (Ikon Science, Houston, USA) and Steve Jenkins (UK) for reading the manuscript and providing comments on language and helpful advice. We also acknowledge the valuable comments of Dr Frank Scholze (Hessian State Museum Darmstadt, Germany) and Professor Sylvie Bourquin (Rennes 1 University, France), which significantly improved the manuscript.
Declaration of Interest
None.
Supplementary material
To view supplementary material for this article, please visit https://doi.org/10.1017/S0016756820000047