Introduction
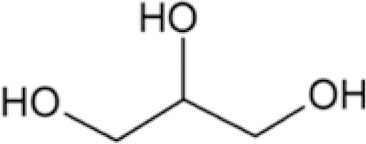
Poly(ethylene glycol) (PEG) is a commonly used biomaterial due to its proven safety record, nontoxicity, and biocompatibility [Reference Hahn, Miller and West1, Reference Patel, Smith and Patrick2, Reference Arcaute, Mann and Wicker3, Reference Cruise, Scharp and Hubbell4, Reference Halstenberg, Panitch, Rizzi, Hall and Hubbell5]. However, as tissue engineering materials specifically for intervertebral (IV) disk applications, PEG hydrogels alone are not sufficient due to their inherent fragility [Reference Varghese, van der Schaft and van Spreeuwel6, Reference Iatridis, Nicoll, Michalek, Walter and Gupta7, Reference Schutgens, Tryfonidou, Smit, Oner, Krouwels, Ito and Creemers8, Reference Khandaker, Orock, Tarantini, White and Yasar9]. Plasticizers are low-molecular-weight (MW) compounds that increase the flexibility of polymers by filling up the network spaces, allowing increased polymer mobility [Reference Sejidov, Mansoori and Goodarzi10, Reference Vieira, da Silva, dos Santos and Beppu11, Reference López-Castejón, Bengoechea, García-Morales and Martínez12]. In this study, to improve the compressive strengths and other important mechanical properties of PEG hydrogels, U.S. Food and Drug Administration (FDA)’s generally recognized as safe (GRAS) substances: glycerol (glycerin), propylene glycol, and sorbitol, and relatively low-MW uncrosslinked PEG were utilized as plasticizers (Table I). The crosslinking process of the bulk PEG matrix was conducted using PEG diacrylate (PEGDA) chain intermediates, and the effect of chemical versus photochemical PEGDA chain elongation leading to gelation was also investigated at various temperature and pressure conditions, as they (type of crosslinkers, temperature, and pressure) affect the physical properties of gels [Reference Vesterinen, Suortti and Autio13, Reference Kim14, Reference Elliott, Macdonald, Nie and Bowman15, Reference Jones, Andrews and Gorman16, Reference Annabi, Mithieux, Weiss and Dehghani17].
Plasticizers used in bulk PEG gels.

Alginate (ALG) biomaterials, the naturally derived polysaccharides that gel via chain interactions linked by multivalent cations (such as Ca2+), have been utilized for IV disk regeneration research [Reference Schutgens, Tryfonidou, Smit, Oner, Krouwels, Ito and Creemers8, Reference Bron, Vonk, Smit and Koenderink18, Reference Pawar and Edgar19]. Laponite (LAP) is a mixture of inorganic minerals with two-dimensional (2D) disk-shaped architecture for the improvement in bulk mechanical properties [Reference Tomas, Alves and Rodrigues20]. Together, these additives (ALG and LAP) were incorporated into the PEG gel assembly to potentially sustain the loads experienced by native lumbar IV disks [Reference Schutgens, Tryfonidou, Smit, Oner, Krouwels, Ito and Creemers8, Reference Bron, Vonk, Smit and Koenderink18, Reference Hong, Sycks, Chan, Lin, Lopez, Guilak, Leong and Zhao21]. Finally, bioactive glass or bioglass [Reference Baino, Hamzehlou and Kargozar22] particles, the engineered slowly-degrading materials known to bind to bones without inducing a foreign-body capsule reaction, were synthesized in the laboratory [Reference Golshan, Curtis, Lianos, Rabbany and de Guzman23] and then layered onto the surfaces of the cylindrical gel and evaluated for blood clotting to imply host tissue integration.
Results and discussion
Compression properties of bulk PEG gels with GLY, PEG, PRO, and SOR
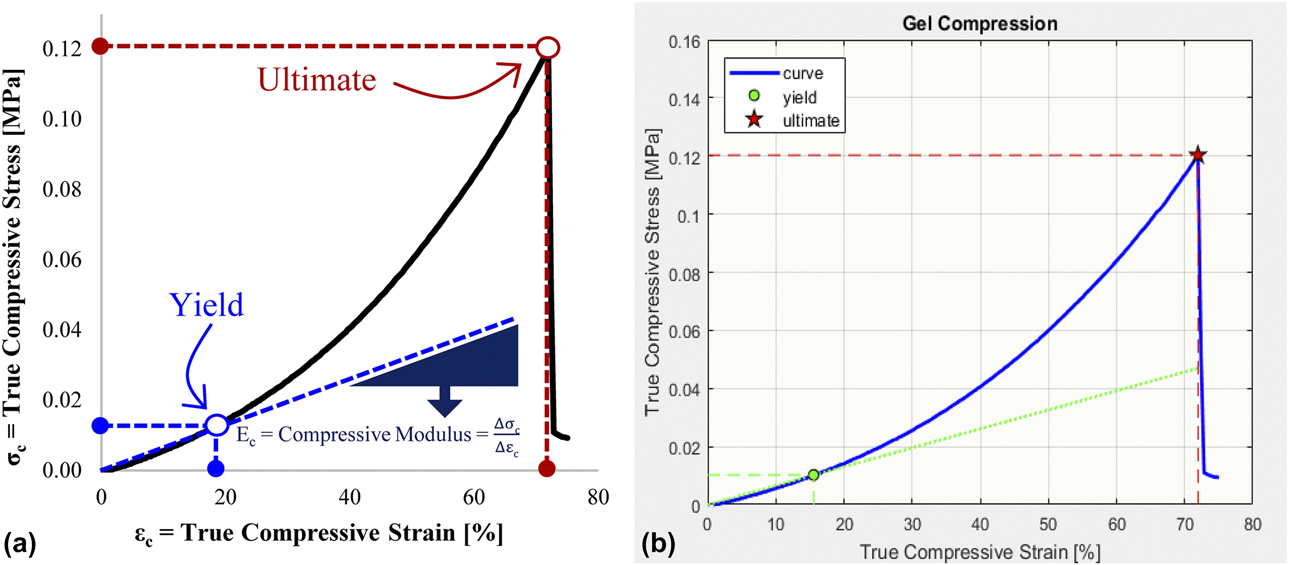
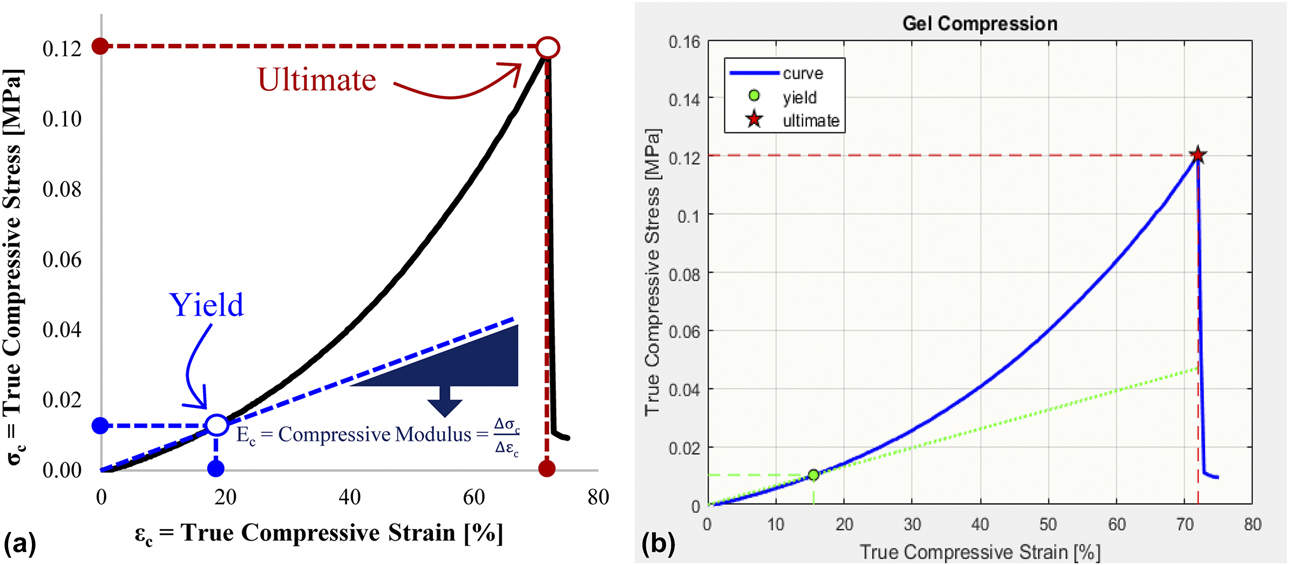
Relative displacements and compressive loads (forces) were converted to true compressive strain and stress values, respectively, and plotted to obtain the elastic modulus at compression or compressive modulus (E c), yield, and ultimate strain and stress properties [Fig. 1].
Representative stress–strain curves in (a) Excel and (b) MATLAB showing the yield and ultimate compressive stress and strain points. The slope of the linear elastic region is the compressive modulus.
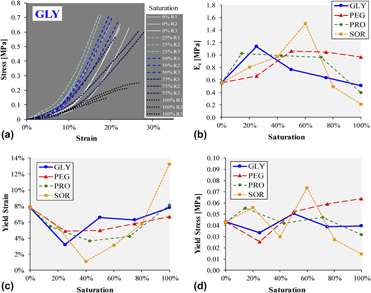
The shapes of the stress–strain curves of PEG gels (using 20% PEGDA) at varying plasticizer saturation concentrations changed expectedly; steepness of slopes increased and then decreased [Fig. 2(a) showing PEG–GLY gels]. Most PEG gels made via photochemical polymerization did not fracture during the compression test. Hence, only E c, yield stress (σc–y), and yield strain (εc–y) data were extracted from the stress–strain scatterplots. Plots of these properties versus plasticizer saturation [Figs. 2(b)–2(d)] revealed some patterns. The E c values (slopes of the linear elasticity region) generally increased and then decreased from 0 to 100% saturation [Fig. 2(b)], corresponding to plasticizing and antiplasticizing effects [Reference Zhang, Rempel and Liu24], respectively. PEG gels with 60% saturated SOR [or 750 mg/mL × 60% = 450 mg/mL SOR (Table I)] produced the highest E c at 1.5 MPa. The staggered conformations of sorbitol [Reference Lerbret, Mason, Venable, Cesaro, Saboungi, Pastor and Brady25] possibly got entangled within the PEG matrix (at 60% saturation), leading to the highest stability and elasticity among the tested plasticizers. In other studies, sorbitol plasticizer also increased the strength properties of structural protein films [Reference Kaewprachu, Osako and Rawdkuen26, Reference Wagh, Pushpadass, Emerald and Nath27]. Glycerol, propylene glycol, and PEG 8000 (PEG with MW = 8000) also exhibited plasticizing effects at low saturation levels: 25%, 14%, and 50%, respectively [Fig. 2(b)].
Compression properties of PEG gels with varying plasticizers (GLY, PEG, PRO, and SOR). (a) Stress–strain curves from triplicates (replicates: R1, R2, and R3) at increasing GLY. Normalized (b) compressive modulus, (c) yield strain, and (d) yield stress values fluctuate relative to the 0% plasticizer level (PEG gel only).

Addition of small amounts of plasticizers decreased the gel flexibility (decrease in εc–y) but reverted to original values (of 8% strain) at plasticizer full saturation levels except for the gel with 100% saturated SOR that increased the εc–y to about 13% [Fig. 2(c)]. Compressive yield stresses erratically fluctuated at different plasticizer quantities [Fig. 2(d)]. Gels with 450 mg/mL SOR recorded 0.074 MPa = 74 kPa of σc–y. Interestingly, the PEG-based gels with 75% saturated GLY (or 0.4 mL/mL × 75% = 0.3 mL/mL = 30% GLY) had E c, εc–y, and σc–y values similar to the gels with no plasticizers, perhaps due to the balance between plasticizing and anti-plasticizing behaviors of glycerol at the 30% concentration.
Effect of temperature and pressure on gel properties
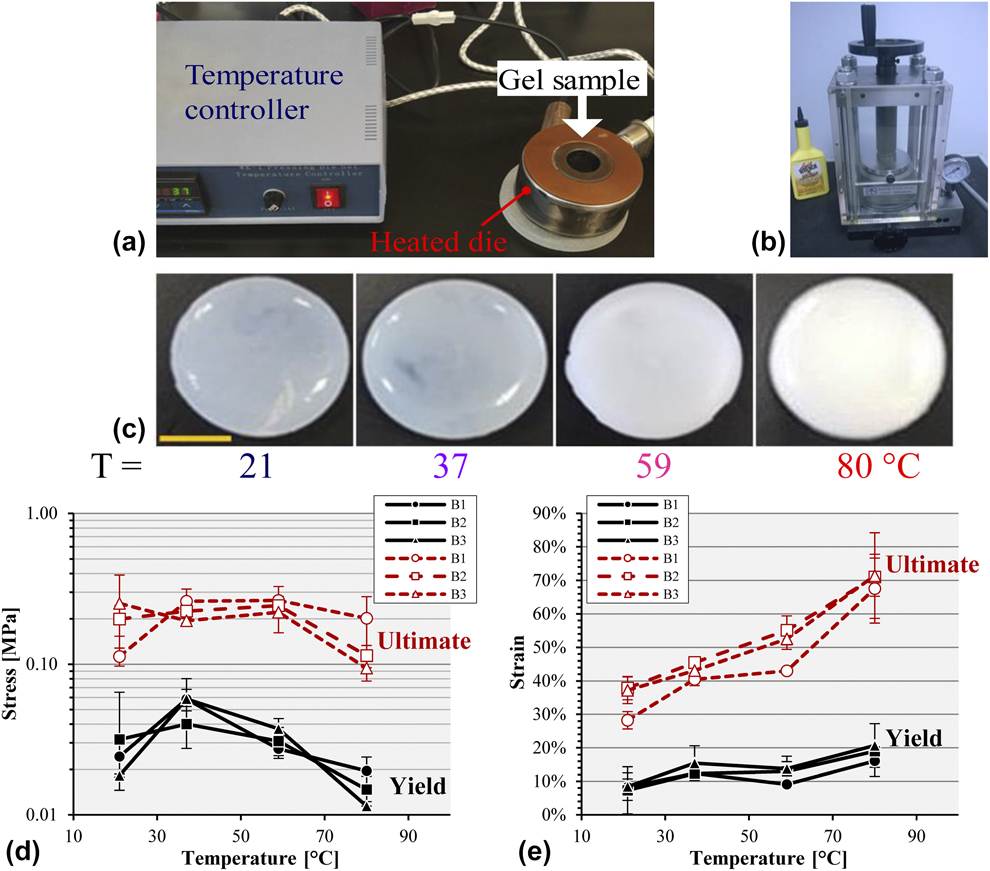
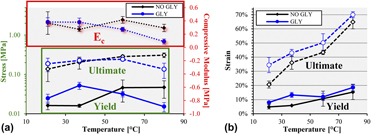
Chemical polymerization was utilized over the photochemical method for better control of gelation, especially for relatively thick gels. The chemically crosslinked PEG–GLY (20% PEGDA with 30% GLY) gels fabricated in a heated die [Fig. 3(a)] showed an increase in opacity as temperature increased [Fig. 3(c)], consistent with the response of poly(N-isopropylacrylamide) (PNIPA) in which lower fabrication temperatures produced translucent gels, while those at higher temperatures turned opaque [Reference Dutta and Dhara28]. Temperatures >80 °C resulted in damaged gels. The measured compression properties generated noticeable trends. Batch variability was small [Figs. 3(d) and 3(e)], suggesting uniformity and repeatability of the chemical gelation process. ANOVA tests revealed significant differences between temperature groups for all the mechanical properties except for the ultimate compressive stress (P = 0.113). Gels fractured at 199 ± 48 kPa of compressive pressure. PEG–GLY gels made at 37 °C had a significantly higher yield stress (at 52 ± 11 kPa) compared to the other temperature groups (P ≤ 0.0308) [Fig. 3(d)]. It was observed that as temperature increased, the compressive strain values also increased [Fig. 3(e)]. Gels polymerized at 80 °C were the most flexible, with yield and ultimate strains of 19 ± 2% and 70 ± 2%, respectively. Additionally, these gels (at 80 °C) produced a significantly (P ≤ 0.0102) lower E c at 89 ± 39 kPa compared to the other temperature groups at 345 ± 63 kPa. Heating increased the molecular motion and randomness of PEG chains’ orientation, producing increased light absorbance (opacity) and spring [Reference Ciepluch, Radulescu, Hoffmann, Raba, Allgaier, Richter and Biehl29] behavior.
(a) The heated die set for temperature-controlled gelation. (b) Pellet press for application of constant pressure. (c) PEG–GLY gels (scale bar = 1 cm) made at varying temperatures (T) with yield and ultimate compressive (d) stresses and (e) strains from experimental batches (B1, B2, and B3), each in triplicate.
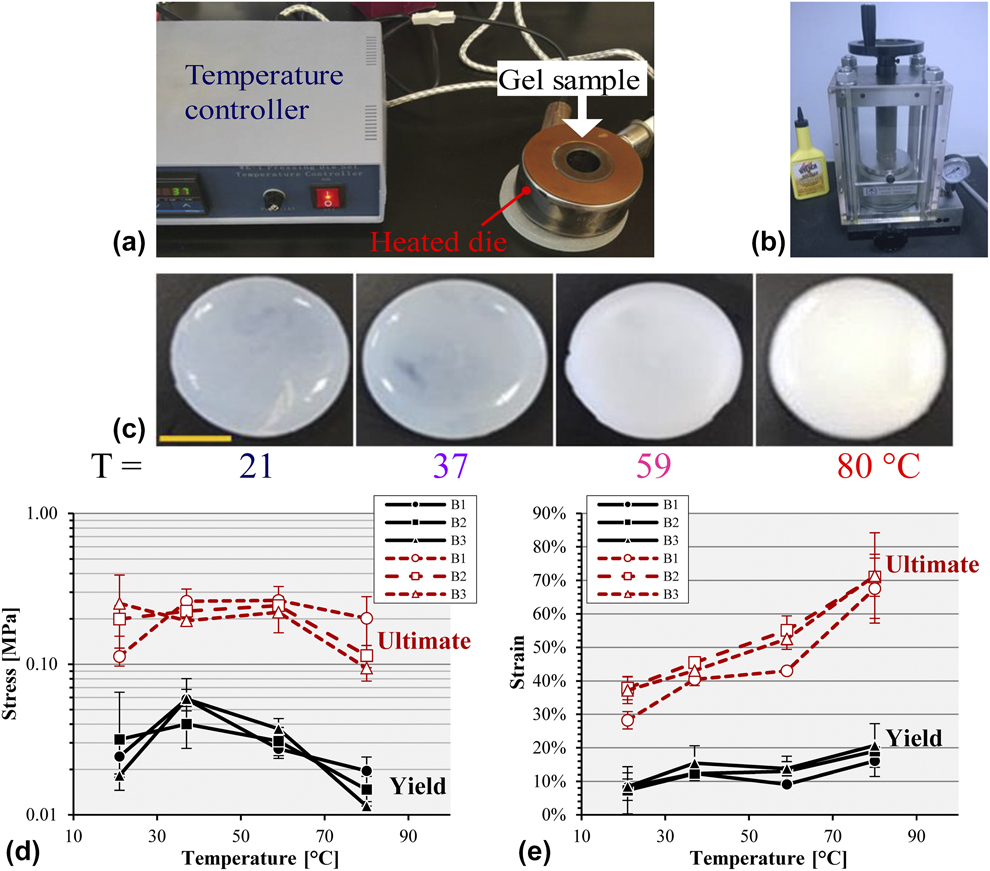
Application of constant gauge pressure of 90 MPa using a pellet press [Fig. 3(b)] at room temperature (RT) produced PEG–GLY gels that had a statistically lower E c (P = 0.0112) at 36 ± 2 kPa and σc–y (P = 0.0228) at 5 ± 2 kPa compared to those made at ambient pressure. The incidence of untestable gels was high due to the die set leakiness at the pressurized condition; thus, the pellet press system needs improvement.
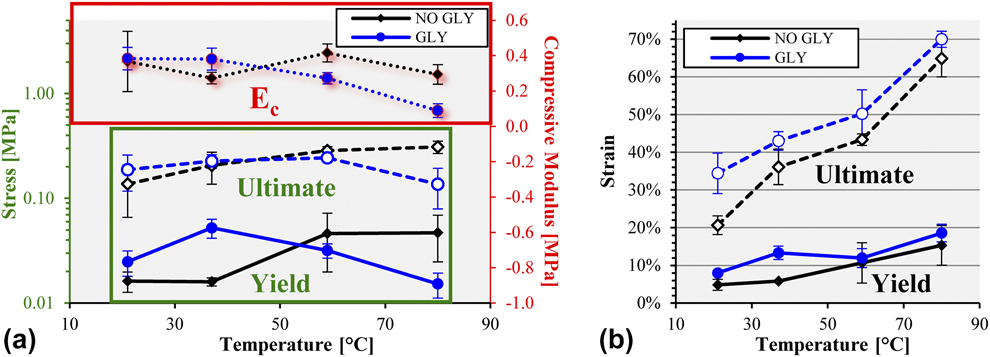
Pairwise comparison of PEG gels revealed that at 80 °C, those with GLY had a statistically lower ultimate compressive strength (136 ± 57 kPa versus 310 ± 42 kPa; P = 0.0194) and compressive modulus (89 ± 39 kPa versus 294 ± 55 kPa; P = 0.0329) than without any plasticizer [Fig. 4(a)]. However, at 37 °C, the addition of GLY led to PEG gels with an increased yield stress (P = 0.031) and yield strain (P = 0.0216) [Fig. 4(b)]. GLY also generated gels with a higher (P = 0.0402) ultimate compressive strain at 21 °C [Fig. 4(b)].
(a) Compressive stress and modulus, and (b) strain comparison between PEG gel without glycerol (NO GLY) and with glycerol (GLY) at various setting temperatures.
Chemical versus photochemical gelation
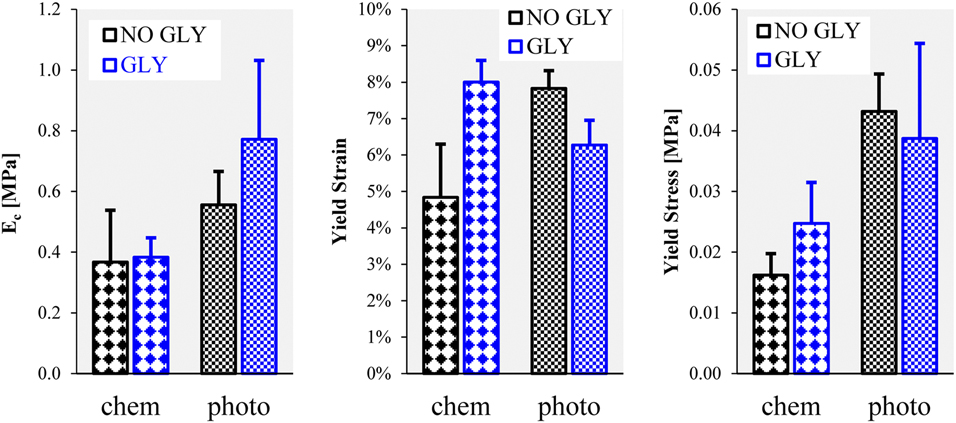
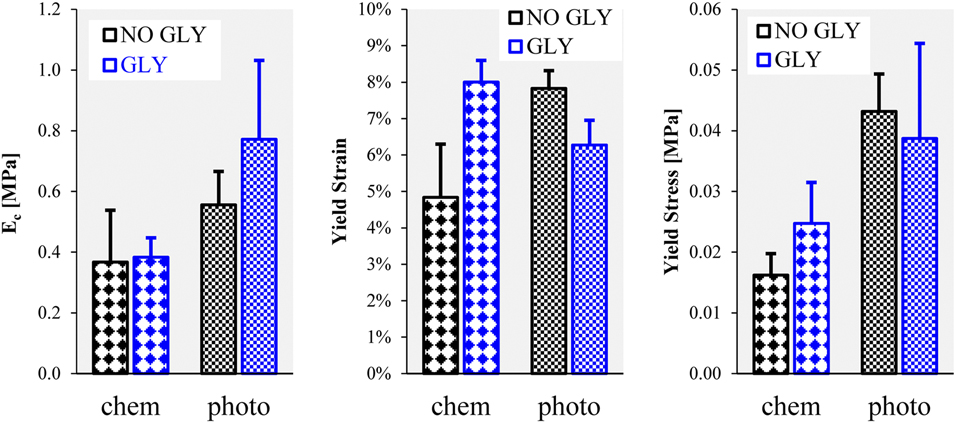
PEG hydrogels were crosslinked and polymerized using chemical (APD and TEMED) and photochemical reactions (I2959 and light at 254 nm). It was determined through mechanical testing that the compressive modulus of PEG gels with GLY was significantly greater (P = 0.0387) when photopolymerized than when chemically gelled [Fig. 5]. Moreover, photochemical PEG-only gels had a statistically higher yield strain (P = 0.0143) and stress (P = 0.0296) compared to those made using chemical crosslinking [Fig. 5].
Properties of chemically (chem) and photochemically (photo) polymerized PEG gels.
Stability of glycerol in PEG hydrogels
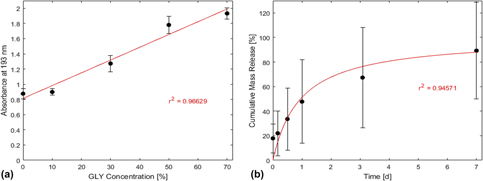
The subsequent experiments employed PEG gels with glycerol as the chosen plasticizer. Accordingly, glycerol’s retention within the PEG matrix was evaluated. The glycerol standard curve followed a linear trendline [Fig. 6(a); r 2 = 0.96629] with the equation: C = (A−0.8137)/1.6809, where C = GLY concentration and A = absorbance at 193 nm. At 193 nm, GLY generated the highest positive signal difference compared to water, PBS, PEGDA, TEMED, and APS (possible substances in the collected liquid). Based on this linear equation, the mass release fraction values were calculated from light absorbances. It was found that the cumulative release of glycerol out of the PEG–GLY gels [Fig. 6(b)] was time dependent and behaved according to the saturation equation (r 2 = 0.94571): R = t/(t h + t), where t h was determined to be 0.9535 day = time needed to release half the amount of GLY from the gel. At the 1-week experimental endpoint, PEG–GLY gels had diffused out 89 ± 39% of the original glycerol mass load, demonstrating that glycerol was not covalently bound to the PEG matrix and leached out quickly into the PBS medium. It is thus advised that PEG–GLY gels are used in minimal liquid environment to prevent glycerol release.
(a) Standard curve of absorbance versus glycerol concentration with a regression line. (b) Cumulative mass release of glycerol out of PEG–GLY gels over a one-week period with fitted saturation curve.

Blood clotting on gels with bioactive glass particles
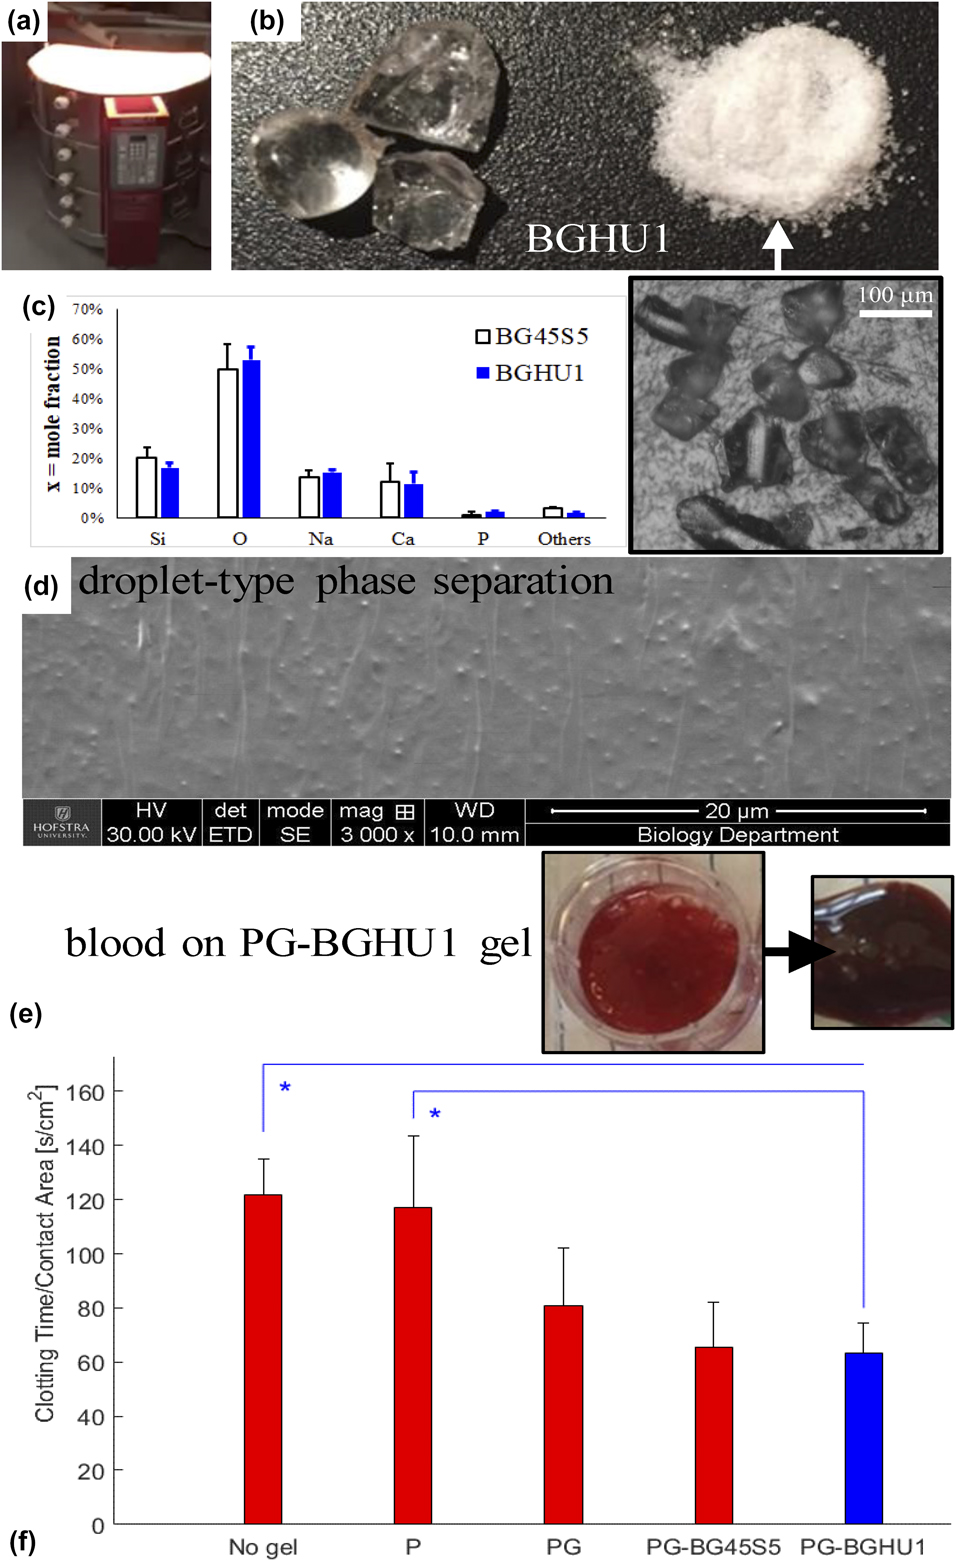
Using electric kilns [Fig. 7(a)] for melting and annealing, bioglass particles with a diameter size of 191 ± 71 μm [Fig. 7(b) and inset] were successfully synthesized and then incorporated into PEG-based gels. The experimental elemental mole fractions based on precursor molecules’ mass fractions matched the expected levels [Fig. 7(c)]. BGHU1 glass samples were found to contain 17% Si, 53% O, 15% Na, 11% Ca, 2% P, and 2% others (Al, Cl, K, Ti, Fe, and In elements). Droplet-type phase separation morphology was observed [Fig. 7(d)] in the fabricated bioglasses, likely due to the relatively low melt and annealing temperatures and the slow rate of quenching [Reference Golovchak, Thapar, Ingram, Savytskii and Jain30, Reference Kowal, Golovchak, Chokshi, Harms, Thamma, Jain and Falk31]. Blood coagulation on gel surfaces [Fig. 7(e)] revealed that PEG–GLY–BGHU1 gels (PEG–GLY hydrogels with BGHU1 bioactive glass particles on exposed surfaces) induced a significantly faster clotting time per unit area compared to poly(styrene) surfaces (no gel; P = 0.0207) and to PEG-only (P = 0.0334) gels [Fig. 7(f)]. The blood coagulation on PEG–GLY–BGHU1 was also lower at 63 ± 11 s/cm2 versus on PEG–GLY at 81 ± 21 s/cm2, but statistically not significant (P = 0.7721). Gels with bioglass (PEG–GLY–BG45S5 and PEG–GLY–BGHU1) activated the similar rates of blood clotting (P = 0.9998), implying that the new bioactive glass mixture (BGHU1) and the control Bioglass 45S5 were alike in their hemostatic capabilities. Other bioactive glass formulations had also been shown to increase hemostasis and in vitro blood coagulation [Reference Ostomel, Shi and Stucky32, Reference Pourshahrestani, Kadri, Zeimaran, Gargiulo, Samuel, Naveen, Hasikin, Kamarul and Towler33]. The faster blood clotting time may suggest the better host tissue integration but ultimately requires actual in vivo implantation experiments.
(a) Kiln for synthesis of (b) bioglass BGHU1 (arrowed inset: reflected light microscopy of particles). (c) Mole fraction elemental analysis of BG45S5 and BGHU1 surfaces. (d) SEM of fractured BGHU1 surface showing the droplet phase separation morphology. (e) A representative PEG–GLY–bioglass (PG-BGHU1) gel with blood, before and after coagulation. (f) Clotting time per surface area versus substrate groups: No gel, PEG-only (P), PEG–GLY (PG), and PEG–GLY with bioglass (PG-BG45S5 and PG-BGHU1) gels. *P < 0.05.
Tulyaganov et al. found that the addition of glycerol to bioglass for 7 days altered the glass network architecture, leading to increased bioactivity [Reference Tulyaganov, Abdukayumov, Ruzimuradov, Hojamberdiev, Ionescu and Riedel34]. They also determined that using alumina crucible during the melt process enabled the incorporation of small quantities of aluminum into the glass network, which lowered the material’s bioactivity [Reference Tulyaganov, Abdukayumov, Ruzimuradov, Hojamberdiev, Ionescu and Riedel34]. BGHU1 contained 1.9% mole fraction of aluminum that may have originated from the HYcor alumina crucible. Accordingly, future work will utilize platinum crucibles for the melt synthesis of bioglass, explore further the use of glycerol, and alter the temperature and time conditions to create spindle-type phase separation [Reference Golovchak, Thapar, Ingram, Savytskii and Jain30, Reference Kowal, Golovchak, Chokshi, Harms, Thamma, Jain and Falk31], all to improve the biological performance of bioglass-based gel constructs.
Biomechanical properties of gels with bioglass, ALG, and LAP additives
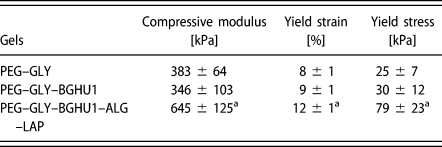
PEG–GLY–BGHU1 gels had compressive modulus, yield strain, and yield strength results that are statistically similar (P > 0.05) to gels (PEG–GLY) without the bioglass particles (Table II). Bioactive glass particles were only added on the gel surfaces and hence did not alter the bulk properties. PEG–GLY hydrogels with added ALG (at 2.5%) and LAP (at 2.5%) constituents (PEG–GLY–BGHU1–ALG–LAP) produced higher E c (P ≤ 0.0431), εc–y (P ≤ 0.014), and σc–y (P ≤ 0.0187) measurements compared to the groups without ALG and LAP (Table II). The ultimate strain and stress points of PEG–GLY–BGHU1 gels were determined to be 34 ± 1% and 254 ± 31 kPa, respectively. In another study using PEG gels, the presence of ALG and LAP additives also increased the mechanical strength of gels, particularly the fracture toughness or ultimate compressive strength due to the supplemental ALG network formation and reinforcing LAP load-bearing structures [Reference Hong, Sycks, Chan, Lin, Lopez, Guilak, Leong and Zhao21]. The 79-kPa yield strength of the PEG-based gel IV disk model was below the 100 kPa computed biomechanical tolerance of a native lumbar IV disk of an average man in supine position [Reference Wilke, Neef, Caimi, Hoogland and Claes35]; therefore, the gel assembly needs further research and development.
Compressive properties of PEG–GLY gels.

a P < 0.05.
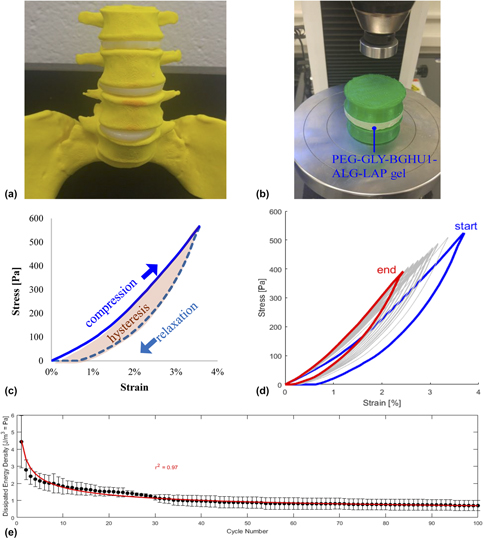
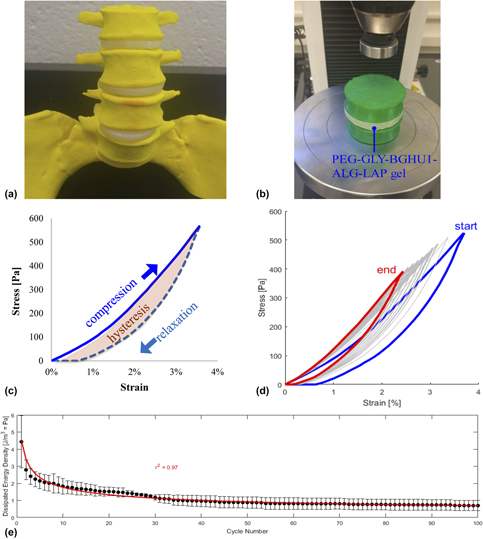
PEG–GLY–BGHU1–ALG–LAP gels were geometrically modeled as cylindrical lumbar spine IV disks [Fig. 8(a)] and tested for cyclic compression [Fig. 8(b)] at an initial compressive strain of 4% (determined to be within the linear elasticity region of the gel). Hysteresis and creep responses were observed during cycles of compression (loading) and relaxation (unloading) [Fig. 8(c)], with similarities to behavior of actual IV disks during cyclic compression [Reference Schmidt, Shirazi-Adl, Schilling and Dreischarf36, Reference Li, Patwardhan, Amirouche, Havey and Meade37]. Stress–strain curves were found to decrease in magnitude at increasing number of cycles (n) [Fig. 8(d)]. Consequently, hysteresis behavior and dissipated energy density (E = area within the hysteresis loop) also decreased following a power regression (r 2 = 0.97) with the equation: E = α n β, where α = 4.5102 J/m3 = dissipated energy density at the first cycle and β = −0.4069 = exponent [Fig. 8(e)], indicative of elastic recovery [Reference Salari-Sharif, Schaedler and Valdevit38] exhibited by biological tissue specimens [Reference Zhu, Kang, Yu and Poh39, Reference Perrini, Mauri, Ehret, Ochsenbein-Kolble, Zimmermann, Ehrbar and Mazza40].
(a) Lumbar spine model with PEG-based gels as IV disks. (b) Cyclic compression setup including the vertebral bodies that sandwich the experimental gel. (c) A representative cyclic loading (compression) and unloading (relaxation) stress–strain curve displaying the hysteresis loop. (d) 100 cycles of overlaid curves with the initial (start) and final responses (end). (e) Scatterplot of dissipated energy density versus cycle number with fitted power curve.

Conclusions
This research study showed improvements in compressive strengths of 20% PEG gels through the use of GRAS plasticizers (sorbitol, glycerol, propylene glycol, and PEG 8000) at relatively low saturation concentrations. Photochemical reaction proved to be the superior method of gelation over chemical means for the creation of stronger gels, but the latter provided better control and product uniformity. The gelation temperature of 37 °C made constructs (PEG with 30% glycerol) with the highest yield strength among the other temperature groups. Gels synthesized at ambient pressure, with the addition of ALG and LAP, led to a greater increase in the mechanical performance. These gels with surface bioglass particles, modeled to cylindrical lumbar IV disks, demonstrated decent biomechanical responses. Additional experimentation and development activities are needed for translational applications.
Experimental
Materials
The following chemicals were purchased from Sigma-Aldrich (St. Louis, Missouri): poly(ethylene glycol) diacrylate (PEGDA; MW = 700 g/mol), glycerol (GLY; MW = 92 g/mol), poly(ethylene glycol) (PEG; MW = 8000 g/mol; n ∼ 181), propylene glycol (PRO; MW = 76 g/mol), sorbitol (SOR; MW = 182 g/mol), ammonium persulfate (APS), tetraethylethylenediamine (TEMED), methanol (MeOH), phosphate-buffered saline (PBS), silica (SiO2), sodium oxide (Na2O), calcium oxide (CaO), phosphorus pentoxide (P2O5), calcium chloride (CaCl2), and sodium alginate (ALG; product #W201502). Irgacure® 2959 (I2959) was obtained from BASF (Vandalia, Illinois) and Laponite® RD (LAP; synthetic layered silicate made from SiO2, MgO, Li2O, and Na2O) from BYK Additives (Gonzales, Texas). Deionized water was used as the solvent for preparing solutions unless stated otherwise.
Gel synthesis using photochemical crosslinking with varying plasticizers
Cylindrical gels were prepared into wells of 24-well poly(styrene) plates at final concentrations of 20% (V/V) PEGDA, 10 mg/mL I2959 (diluted from 100 mg/mL I2959 in MeOH), and varying amounts of plasticizers (GLY, PEG, SOR, and PRO) up to their saturation limits. The saturation limits of respective plasticizers in gels were determined by adding increasing amounts of plasticizers (10%–75%) until the gel could no longer hold the plasticizer (phase separation observed). The maximum amounts of gel-incorporated plasticizers were found to be as follows: GLY at 40% (V/V) = 0.4 mL/mL = 504 mg/mL, PEG at 30% (m/V) = 300 mg/mL, PRO 70% (m/V) = 700 mg/mL, and SOR at 75% (m/V) = 750 mg/mL (Table I). These values were then set to be the 100% relative saturation levels. PEG, SOR, and PRO were prepared at higher concentrations prior to dilutions. After mixing the components into uniform solutions, samples were photo-crosslinked by exposure to a 36-W, 254-nm UV light for 20 min at ambient temperature (21 °C) [Reference de Guzman and Rabbany41].
Gel compression analysis
Strength and viscoelastic properties of gels were characterized through unconfined compression until fracture. Freshly made gels were biopsy-punched to obtain cylindrical specimens with diameter (d) = 11 mm, loaded onto a platen, and then compressed with a parallel blunt probe at a speed of 0.1 mm/s using the Instron 3345 mechanical tester (Instron, Norwood, Massachusetts) with a 100-N load cell. Settings were configured and data (relative displacement versus force) were acquired with the Bluehill 3 software (Instron). Data were processed in Excel (Microsoft, Redmond, Washington) and MATLAB (Mathworks, Natick, Massachusetts) to obtain true stress and strain results [Reference Sheen and de Guzman42]. Compression properties, elastic modulus at compression (E c), and yield and ultimate strains and stresses were determined.
Gel synthesis using chemical crosslinking at different temperatures and pressures
PEG-based gels were fabricated via chemical crosslinking by homogenously mixing the following: 20% (V/V) PEGDA, 30% (V/V) GLY plasticizer, 1% (V/V) TEMED, and 1 mg/mL APS into the chamber of a heated die set (Across International, Livingston, New Jersey). A 10 mg/mL APS intermediate solution was prepared and used prior to the gelation reaction. Gels (d = 25 mm and h = 5 mm) were allowed to set at different temperatures: 21, 37, 59, and 80 °C using a temperature controller for 15 min, equilibrated back to RT, biopsy-punched at d = 8 mm, and underwent unconfined compression testing as described above. Gels without the GLY plasticizer were utilized as controls. Representative PEG–GLY gels were also fabricated under 90 MPa of gauge pressure (compared to gels made in atmospheric pressure) for 15 min at 21 °C within an MP15 desktop pellet press (Across International).
Glycerol release assay
The stability of GLY in PEG–GLY gels was tested by spectrophotometry. Hydrogels (20% PEGDA and 30% GLY) were made similar to the abovementioned protocol using chemical crosslinkers. Eight-millimeter-diameter samples were obtained using a biopsy puncher, and these gels were placed into wells of a 48-well microplate. Three hundred microliters of PBS was added into wells and incubated at RT, and at timepoints 0, 4, 12, 24, 74, and 168 h (or at 0, 0.2, 0.5, 1, 3.1, and 7 days), liquid samples were collected and replaced by fresh PBS. Spectral scans of these specimens were conducted using the NanoDrop spectrophotometer (Thermo Fisher Scientific, Waltham, Massachusetts) at 190–200 nm with PBS as a blank. Chemicals that can potentially leach out of the PEG–GLY gels (PEGDA, GLY, TEMED, and APS) were tested as well. The absorbance values were computed as the difference between samples and the blank PBS at 193 nm. GLY concentration was determined using the linear trendline of the glycerol standard curve. Mass release fraction was computed by dividing the released glycerol mass with the initial mass. A scatterplot of cumulative mass release versus time was then generated, and a saturation curve fitted using least-squares regression in MATLAB with the equation:
 $$R\left( t \right) = {R_{\max }}\left( {{t \over {{t_{\rm{h}}} + t}}} \right)\quad ,$$
where R = cumulative mass release fraction (function of t), t = time, R max = 100% (maximum release), and t h = saturation equation constant = time to release half the load.
Bioactive glass synthesis and incorporation into gels
Bioactive glasses (BGHU1 and control Bioglass 45S5 (BG45S5)) were fabricated based on the modified protocol of Greenspan and Hench [Reference Greenspan and Hench43, Reference Lin, Chang, Liu, Zeng and Shen44]. Briefly, 50 g total of chemical powders: SiO2, Na2O, CaO, and P2O5, was homogenously mixed into a HYcor® alumina ceramic crucible (SELEE® Advanced Ceramics®, Gilberts, Illinois) and melted in an electric kiln at 1288 °C for 4 h. Mass fractions (%) of the following bioglass components were prepared: BGHU1 (44SiO2–26Na2O–23CaO–7P2O5) and BG45S5 (45SiO2–24.5Na2O–24.5CaO–6P2O5). The theoretical calcium-to-phosphorus mole ratios (n Ca/n P) of BGHU1 and BG45S5 were 4.5 and 5, respectively, while their silicon network connectivity (NCSi) was 2.13 and 2.12. Using metal tongs, the melt was poured into a new ceramic crucible in another kiln set at 460 °C, incubated for 8 h (annealing), and allowed to cool to RT for 24 h. The synthesized glasses were removed from the crucible and ground into fine particles with a mortar and pestle. Representative fractured glass surfaces were imaged using a Q250 scanning electron microscope (SEM) (FEI, Hillsboro, Oregon) at 30 kV and particles via Eclipse LV150N reflected light microscopy (Nikon Metrology, Brighton, Michigan). The UltraDry™ (energy-dispersive X-ray spectroscopy) EDS detector (Oxford Instruments, Oxfordshire, England, U.K.) attachment to the SEM was used to quantify the relative surface elemental composition (x = mole fraction). PEG (20% PEGDA)–GLY (30%)–bioglass gels were made with 5% (m/V) bioactive glass particles using chemical crosslinkers. After the gelation process, additional 5% bioglass was added on the gel surface.
Blood coagulation test
To investigate the potential host response effect of bioactive glass additives on gels, a clotting assay was performed. PEG–GLY–bioglass gels (PEG–GLY–BGHU1 and PEG–GLY–BG45S5) were made at 1.5 mL each into wells of a 12-well microplate. Control groups: no gels (surface of the poly(styrene) plate), PEG-only, and PEG–GLY gels were also included. Samples were quickly rinsed with PBS to remove excess and unreacted reagents. Cat bloods in EDTA tubes collected from animal shelters with an Animal Care and Use Committee (ACUC)-approved protocol from Dr. John Foy (Bobbi and the Strays, Freeport, NY) at 100 μL were mixed with 1 M CaCl2 and then immediately added onto the test gel substrates. Blood coagulation time was recorded and normalized over the surface area of blood contact.
Addition of ALG and LAP in hydrogels
To potentially improve the strength properties of PEG–GLY–BGHU1 constructs, ALG and LAP biomaterials were added. Specifically, PEG–GLY–BGHU1–ALG–LAP gels were made by mixing 20% PEGDA, 30% GLY, 5% BGHU1, 2.5% (m/V) ALG, and 2.5% (m/V) LAP and then chemically crosslinked by 1% TEMED and 1 mg/mL APS. After curing for 15 min, gels were soaked in 1 M CaCl2 solution overnight to polymerize the ALG components. Compression until failure test was performed and properties obtained.
Cyclic compression loading
Bigger PEG–GLY–BGHU1–ALG–LAP cylindrical gels were fabricated (at d = 50 mm and h = 10 mm) to model a human IV disk between vertebrae lumbar 3 and 4 (L3 and L4). L3 and L4 vertebral bodies were simplified, modeled as cylinders that slightly taper in the middle, and three-dimensional (3D)-printed using a green poly(lactic acid) (PLA) filament (MakerBot, Brooklyn, New York). The hydrogel “IV disk” was positioned between PLA “vertebrae” and placed on the platen of Instron 3345. The Bluehill 3 software was configured for cyclic loading at a maximum compressive strain of 4% (at 0.1 mm/s) for 100 cycles of compression and relaxation. Stress–strain curves were plotted. Dissipated energy density was calculated as the area of the hysteresis loop using MATLAB. A power equation was fitted using the formula:
 $$E\left( n \right) = \alpha {n^\beta }\quad ,$$
where E = dissipated energy density (function of n), n = cycle number, and α and β = constants.
Statistical analyses and software
Experimental samples were performed in triplicate (n = 3). Values were reported as mean ±1 standard deviation. Student’s t-test and one-way analysis of variance (ANOVA) with multiple comparison (Tukey’s) tests were performed in MATLAB at 5% probability (p) of type I error. Chemical structures of plasticizers were drawn using ChemSketch (Advanced Chemistry Development, Toronto, Ontario, Canada).
Acknowledgments
The authors would like to thank the members of the Bioengineering Materials Lab, including Daniel Foyt and Hazel Consunji for technical assistance, manuscript proofreading, and discussion, Tyler Lavertu for gel fabrication under extreme pressure, Paul Chaleff and Bethany Dill for help with bioglass synthesis, Carol St. Angelo and the Hofstra Biology Department for the electron microscopy assistance, John Foy for providing the animal blood samples, Meir Wieder for the Excel Visual Basic for Applications (VBA) coding, Pierre Llanos and Robert Cerro for 3D printing assistance, and Jacqueline Scarola and Lori Castoria for help with reagents purchasing. Support for this study was provided by Hofstra University internal research funds.