Introduction
Planet Earth was formed during the formation of our solar system about 4.6 billion years ago. At present very few data are available regarding the atmospheric, oceanic or geological conditions on the pre-biological Earth. However, it is assumed that conditions on the young Earth were very hostile due to volcanism, radiation, and bombardment by comets and asteroids. Nevertheless primitive life, in the form of bacteria, had emerged by at least 3.5 billion years ago (Derenne et al. Reference Derenne, Robert, Skrzypczak-Bonduelle, Gourier, Binet and Rouzaud2008) indicating that planet Earth was habitable in its very early history. The apparent exclusivity of our planet as a host for life and its rapid emergence pose the question: could it be that the conditions on Earth are extremely rare and perhaps even unique? Factors such as the right distance from the Sun, the right mass of the Sun, stable planetary orbits, a Jupiter-like neighbour, the right planetary mass, plate tectonics and an ocean may have been among the necessary prerequisites to create life on Earth (Lammer et al. Reference Lammer2009). Earth provides an ideal environment for life to persist and flourish. Dynamic processes in the Earth's interior have established a magnetosphere that protects the Earth from harmful cosmic ray particles impinging Earth's atmosphere. Earth's atmosphere, in turn, shields life from radiation and allows for a stable climate and temperature cycle. A brief look at our planetary neighbours shows that Venus, with an average surface temperature of 500°C, and Mars, with an average surface temperature of −60°C and a thin atmosphere, are both apparently unable to sustain life at their surface. An environment, where one or more parameters (physical and chemical) show values permanently close to the lower or upper limits for life, may be considered an ‘extreme environment’. It is now recognized that extreme environments represent the largest volume of the Earth's biosphere. Although Mars may not be habitable on the surface, regions in the subsurface may still harbour life or remnants from past life.
A strategic search for life on Mars needs a thorough interdisciplinary preparation phase that includes Mars laboratory simulations, computational studies, instrument development and calibration, and extensive terrestrial field tests at Mars analogue sites. In this paper, we report on the results of chemical and physical measurements of Mars soil analogues. Additionally, we tested the stability of amino acids in two samples under simulated Martian conditions. Our results show a heterogeneous distribution of soil properties and abundances of biomolecules in arid deserts. Our understanding of the survival of organics on Mars necessitates an appreciation of subsurface mineral matrices.
Mars: a habitable planet?
Data returned from recent Mars missions indicate that water was once abundant on the surface of Mars (e.g. Heldmann et al. Reference Heldmann, Carlsson, Johansson, Mellon and Toon2007). Gullies on the surface of Mars are attributed to ground water seepage and surface runoff (Malin & Edgett Reference Malin and Edgett2000). Hematite and jarosite, which on Earth are typically formed in an aqueous environment or by aqueous alteration, have been found by the Mars Exploration Rovers (Squyres et al. Reference Squyres2004a). The presence of large deposits of phyllosilicates suggests weathering of the basaltic crust by liquid water (Chevrier & Mathé Reference Chevrier and Mathé2007). Cementation and bleaching along joints in layered deposits have been discovered in observations from the Mars Reconnaissance Orbiter (Okubo & McEwen Reference Okubo and McEwen2007), indicating fluid alterations in the geological past by subsurface flows.
Liquid water is a generally accepted prerequisite for life and its presence for a geologically relevant period of time on Mars suggests the possibility that life could have emerged. If life arose in that period, evidence in the form of organic compounds might still be present on Mars today. However, the 1976 Viking landers, the only spacecraft to date to have searched specifically for organic molecules on Mars, did not detect any organic compounds above a detection limit of a few parts per billion (ppb) within 30 cm of the surface (Biemann & Lavoie Reference Biemann and Lavoie1979). The failure to detect organic compounds is generally attributed to the intense ultraviolet (UV) radiation and highly oxidizing nature of the Martian surface environment that would destroy most organic compounds in a short period of time (Benner et al. Reference Benner, Devine, Mateeva and Powell2000; Squyres et al. Reference Squyres2004a).
Several models for the degradation of organics in the Martian soil have been suggested; most models require UV radiation or oxidants, or a combination of the two. The atmosphere of Mars allows solar light down to ~190 nm to reach the surface of the planet (see Patel et al. Reference Patel, Zarnecki and Catling2002, for a model of the Martian UV environment). The direct impact of UV light on the surface of Mars can degrade small organic compounds directly (Stoker & Bullock Reference Stoker and Bullock1997; ten Kate et al. Reference ten Kate, Garry, Peeters, Quinn, Foing and Ehrenfreund2005). However, the Martian soil blocks UV photons within the first few millimetres and in the absence of Aeolian transport any organics that might be present in the soil below are shielded from the UV radiation.
UV light may also photolyse water molecules in the atmosphere and create reactive species such as H, OH, and HO2 radicals and H2O2. This process is especially effective in the upper atmosphere, where more energetic UV radiation (below 190 nm) is present. The reactive species may diffuse down into the regolith where they can oxidize organic molecules. Finally, oxidizing species may also be created directly in the soil, by Fenton-type reactions (Liang et al. Reference Liang, Hartman, Kopp, Kirschvink and Yung2006). Energetic solar protons and galactic cosmic ray particles can penetrate to a much greater depth than UV radiation. Dartnell et al. (Reference Dartnell, Desorgher, Ward and Coates2007) modelled that E. coli, B. subtilis, and D. radiodurans would be killed by such radiation at 2 m depth in 30,000, 250,000, and 450,000 years, respectively. Organic molecules are susceptible to degradation by MeV protons (Ruiterkamp et al. Reference Ruiterkamp, Peeters, Moore, Hudson and Ehrenfreund2005), although larger organic molecules such as polycyclic aromatic hydrocarbons are altered rather than destroyed (Bernstein et al. Reference Bernstein, Moore, Elsila, Sandford, Allamandola and Zare2003).
In recent years, as new mission data have furthered the understanding of past and present Martian surface conditions, a number of locations on Earth have been described as being Mars analogue sites. Navarro-González et al. (Reference Navarro-González2003) reported that soils from the Yungay region of the Atacama Desert contain levels of micro-organisms that are below the detection limits of dilution plating, levels of measurable organics below the detection limits of the Viking gas chromatograph-mass spectrometer (ppb), and commented on the ability of the soils to abiotically decompose organics. Based on these results Navarro-González et al. (Reference Navarro-González2003) dubbed Yungay soils ‘Mars-like’. Other reports on the number of culturable micro-organisms in the Atacama desert soil vary from less than 10 colony forming units (CFU) g−1, (Cameron Reference Cameron, McGinnies and Goldman1969a, Reference Cameron1969b) to 107 CFU g−1 (Cameron et al. Reference Cameron1965, Reference Cameron1966; Glavin et al. Reference Glavin, Cleaves, Schubert, Aubrey and Bada2004), and from ~102 to 105 CFU g−1 for subsurface samples (Maier et al. Reference Maier, Drees, Neilson, Henderson, Quade and Betancourt2004). More recently, Lester et al. (Reference Lester, Satomi and Ponce2007) found a biomass between 8.5×10⁶ and 6.0×10⁷ cells g−1 based on phospholipid fatty acid measurements, and between 6.3×10² and 5.2×10³ CFU g−1 of culturable biomass in Yungay soils. They also found a very low total organic content, between 560 and 765 μg g−1 (parts per million, ppm).
The Atacama desert has been used as a field test site for the development of a number of new technologies and instruments for future Mars exploration (e.g. Cabrol et al. Reference Cabrol2001; Navarro-Gonzàlez et al. Reference Navarro-González2003; Quinn et al. Reference Quinn, Zent, Grunthaner, Ehrenfreund, Taylor and Garry2005; Buch et al. Reference Buch, Glavin, Sternberg, Szopa, Rodier, Navarro-González, Raulin, Cabane and Mahaffy2006; Skelley et al. Reference Skelley, Aubrey, Willis, Amaskhukeli, Ponce, Ehrenfreund, Grunthaner, Bada and Mathies2006; Lester et al. Reference Lester, Satomi and Ponce2007; Meunier et al. Reference Meunier, Sternberg, Mettetal, Buch, Coscia, Szopa, Rodier, Coll, Cabanec and Raulin2007). Studies of the Atacama soil chemistry suggests highly oxidizing conditions (Sutter et al. Reference Sutter, Dalton, Ewing, Amundson and McKay2005; Ewing et al. Reference Ewing, Sutter, Owen, Nishiizumi, Sharp, Cliff, Perry, Dietrich, McKay and Amundson2006). Salten Skov is a region in Jutland, Denmark that has been proposed as a Mars analogue site, mainly for its electric and magnetic properties (Merrison et al. Reference Merrison, Jensen, Kinch, Mugford and Nørnberg2004). Salten Skov soil is composed mainly of goethite with 5.5 wt% maghemite and 12.8 wt% hematite (Nørnberg et al. Reference Nørnberg, Schwertmann, Stanjek, Andersen and Gunnlaugsson2004). Fresh Salten Skov samples have been reported to contain 1.5×10⁶ CFU g−1 under aerobic conditions (Hansen et al. Reference Hansen, Merrison, Nørnberg, Lomstein and Finster2005).
We have collected samples from arid deserts and subsequently analysed their soil properties and organic and mineralogical content with complementary techniques. Testing the physical and chemical properties of Mars regolith analogues such as pH, redox potential, elemental composition, ion concentrations, conductivity, the organic content, and more specifically amino acid abundance represents an important analysis as part of the interdisciplinary preparation phase to search for organic molecules and life on Mars.
Experimental
We have analysed soil samples from the Atacama desert (Chile and Peru) as well as the Danish sediment Salten Skov (often used as Mars analogue, Seiferlin et al. Reference Seiferlin, Ehrenfreund, Garry, Gunderson, Hütter, Kargl, Maturilli and Merrison2008) using different experimental techniques to investigate their soil properties, mineralogical and organic compositions.
Samples
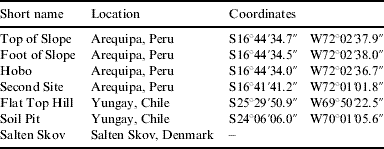
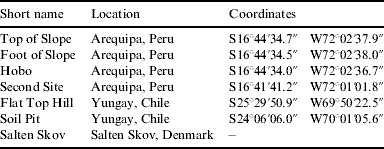
The Atacama desert samples were obtained from the Yungay region in Chile at a site named Flat Top Hill (S25°29′50.9″ W69°50′22.5″). A second sample was taken from an excavation (Soil Pit, S24°06′06.0″ W70°01′05.6″), at a depth of 10 cm. A second set of soil samples was collected from the Arequipa region in Peru, which is a northern extension of the Atacama desert. Surface samples were collected at S16°44′34.7″ W72°02′37.9″ (1165 m altitude) from three spots: in the plane (HOBO site), the top (Top of Slope) and the foot of a nearby slope (about 10 m downhill, designated Foot of Slope). The second Arequipa site (referred to as Second Site) was located 6 km north-east of the first site (S16°41′41.2″ W72°01′01.8″, altitude 1165 m). Salten Skov soil is a finely powdered, dark red Danish sediment collected from 0–20 cm (Nørnberg et al. Reference Nørnberg, Schwertmann, Stanjek, Andersen and Gunnlaugsson2004). The soil names and locations are summarized in Table 1.
Martian soil analogues and locations from where they were obtained
Oxidation-reduction potential and pH value
Oxidation-reduction potential (EH) and pH measurements were taken using an Orion 635 MMS™ Meter with an Orion 61-79 pHuture™ combination Quatrode™ (pH/ORP/temperature) electrode. For pH calibrations, premixed Thermo-Orion buffer solutions were used (pH 4, 7 and 10) and for ORP calibration, Thermo-Orion ORP standard was used to calibrate to the standard hydrogen electrode. The probe uses an integral temperature sensor to automatically compensate measurements for temperature. Measurements were made by adding soil sample to high-purity (18 MΩ) Milli-Q water in a 1:2 (wt:wt) soil-to-water ratio. Ultra-high-purity nitrogen gas was used to purge the soil solutions. The soluble ion content of the soils was determined at the NASA Ames Analytical Laboratory by aqueous solvent extraction using a 1:2 (wt:wt) soil-to-water ratio and analysis by ion chromatography.
Morphological analysis
Sample morphologies were determined using a ZEISS Supra Field Emission Scanning Electron Microscope (FESEM). The magnification ranged between 569 and 2800. Energy Dispersive X-ray (EDX) analysis was performed using an Oxford INCA Energy 350 system attached to the FESEM. For each sample, the EDX analysis was repeated 10 times at different locations (1 μm) of the sample.
X-ray diffraction studies
A stainless steel micro spatula was used to place a small amount of powder into a micro agate pestle and mortar together with a few drops of ethanol. After a short period of grinding/mixing the paste was mounted on a silicon wafer and air dried before analysis. The samples were analysed on a Philips PW1830 diffractometer system using Cu Kα radiation. Data were fitted with a PW1820 goniometer and a graphite monochromator. Generator settings for the measurement was 45 kV, 40 mA. We used Hiltonbrooks controlling and Traces software. Analytical conditions: range two theta=2.5–70 degrees; step size=0.02; count time per step=2 s.
Infrared spectroscopy
A Bruker IFS66v interferometer was used to obtain infrared laboratory spectra. Diffuse reflectance measurements were obtained over the range 7000–400 cm−1 at a resolution of 2 cm−1 using Graseby Specac Mod. selector reflectance accessory. A diffuse biconical configuration was used and sample spectra were recorded relative to the reflectance of KBr. Spectral measurements were performed at low pressure (1 mbar) to prevent changes in environmental conditions (e.g. atmospheric water vapour and carbon dioxide abundance) during measurements.
Laser desorption–mass spectroscopy
Laser desorption (linear) time-of-flight (TOF) mass spectrometry (LD–MS) was used for the detection of organic matter in the desert soil samples. A microlitre of concentrated suspension of the soil in doubly distilled water was placed on a stainless steel disk and transferred by a rapid sample change port into the high-vacuum chamber (~2×10⁻⁷–2×10⁻⁸ mbar) of a Kratos vacuum LD–MS. Neutral and ionized particles were desorbed using a 337 nm (UV) nitrogen laser at low laser densities (~106 W cm−2). Mass spectra of positive ions emitted directly in the desorption process were collected at low laser fluences. Blanks were run between each sample analysis. A blank consisted of a spot on the sample disc that has had no prior sample extract introduced, or a spot of pure doubly distilled water. To ensure statistical accuracy and reproducibility, the spectra were averaged over several 100 laser shots. Previous studies of meteorite samples under identical laser conditions have demonstrated statistical accuracy and reproducibility to within ~3% of the measured standard, averaged over 100 shots.
Mars simulations
The stability of amino acids was tested in a Mars simulation chamber that has been described in detail by Garry et al. (Reference Garry, ten Kate, Martins, Nørnberg and Ehrenfreund2006). Stainless steel cups were filled with 15–20 mg of sample. The samples were placed in a vacuum chamber and pumped down to 3×10⁻⁵ mbar. The chamber was then filled with 7 mbar CO2 (Praxair, 99.996% purity). The CO2 was calibrated by the supplier to contain less than 10 ppm H2O. If the residual gas in the system before filling with CO2 contained only water, the upper limit of water vapour in the system during the experiments can be estimated to be 10−4 mbar, or 14 ppm.
Samples were irradiated through a UV-grade quartz window with a deuterium lamp (Heraeus–Noblelight, DX202). The output of the lamp was measured with a UV sensor (Solartech, model 8.0) and a full range light meter (Extech, model EA30). Integrated over the wavelength range 190–400 nm the Mars model of Patel et al. (Reference Patel, Zarnecki and Catling2002) yields 32 W m−2; the deuterium lamp delivered 3.4 W m−2 in the same range (ten Kate et al. Reference ten Kate, Garry, Peeters, Quinn, Foing and Ehrenfreund2005). In order to best mimic the conditions on Mars, the environmental conditions were varied in a diurnal cycle. The samples were irradiated for 12 h at room temperature, followed by cooling to −60°C without irradiation for another 12 h. This resembles a day (sol) near the Martian equator. Each experiment lasted four diurnal cycles, equivalent to four Martian sols. Mars environmental exposure simulations were performed on the Top of Slope sample from the Arequipa region and the Danish sediment Salten Skov. Serpentine was included in the simulation experiment as a blank control. The serpentine sample was ground to a powder in a glove box under a flow of ultra-high-purity argon, using a ceramic mortar and pestle. The serpentine was heated to 500°C for 3 h before the simulation experiment.
High Performance Liquid Chromatography – Fluorescence Detection
The amino acid content of the samples was measured before and after four diurnal cycles in the Mars simulation setup. The Martian soil analogues and the serpentine blank control were analysed according to the established procedure for extracting, separating, and analysing amino acids in meteorite samples (Zhao & Bada Reference Zhao and Bada1995; Botta & Bada Reference Botta and Bada2002; Martins et al. Reference Martins, Alexander, Orzechowska, Fogel and Ehrenfreund2007a, Reference Martins2007b). All glassware and ceramics used in the amino acid analysis were baked out in an oven at 500°C for 3 h. Approximately 15–20 mg of each powdered Martian soil analogue and serpentine blank samples were flame-sealed inside Pyrex test tubes with 1 mL water and incubated at 100°C for 24 h. After the hot-water extraction, the tubes were rinsed with High Performance Liquid Chromatography (HPLC) grade water, cracked open and centrifuged. Half of each water supernatant was transferred to smaller test tubes, and dried under vacuum. Each small test tube was placed inside a larger Pyrex test tube containing 1 mL of 6 M HCl. The larger test tubes were flame sealed and placed in an oven for 3 h at 150°C. The Pyrex test tubes were rinsed with HPLC water, cracked open, and the small test tubes removed. The hydrolysed extracts were dried under vacuum, dissolved in 3 mL HPLC water, desalted on a AG 50W-X8 cation exchange resin (100–200 mesh, Bio-Rad) column, and eluted with 5 mL 2 M ammonium hydroxide (28–30%, Acros Organics). The eluates were dried under vacuum and re-dissolved in 100 μL HPLC water. Aliquots of 10 μL were added to 10 μL 0.1 M sodium borate buffer. These were dried under vacuum to remove any residual traces of ammonia. After dissolution in 20 μL HPLC water, the amino acids were derivatized by adding 5 μL OPA/NAC (o-phthaldialdehyde/N-acetyl-L-cysteine). After 1 or 15 min, the derivatization reaction was quenched by adding 475 μL 50 mM sodium acetate. The derivatized amino acids were separated on a C18 reverse phase Synergi 4μ Hydro-RP 80A column (250×4.6 mm, Phenomenex) and detected by UV fluorescence on a Shimadzu RF-10AXL (excitation at 340 nm, emission at 450 nm).
Elution was performed by applying a binary mobile-phase gradient, where buffer A contained 50 mM sodium acetate and 4% (v/v). methanol, and buffer B was methanol (Biosolve Ltd.). The gradient was run at a constant flow rate of 1 mL min−1 and starting with 100% buffer A, buffer B was increased in several time steps: 0–4 min: 0%, 4–5 min: increase to 20%, 5–10 min: 20%, 10–17 min: increase to 30%, 17–27 min: increase to 50%, 27–37 min: increase to 60%, 37–49 min: 60%, 49–50 min: decrease to 0%, 50–60 min: 0%. Amino acids were identified by retention time comparison to known standards. The abundances of the identified amino acids were determined by the ratio of the integrated peak area to the integrated peak area of the standards, corrected for the abundances found in the serpentine blank control sample.
Results
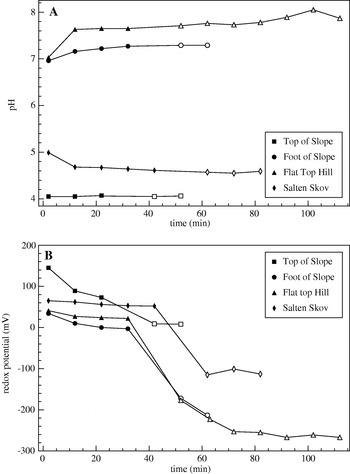
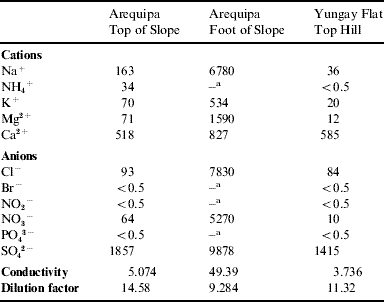
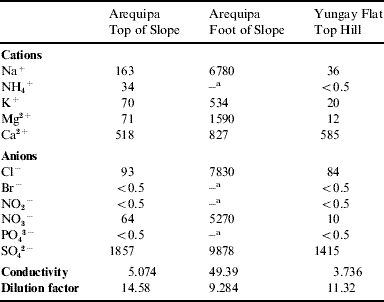
The pH and redox potential of the Yungay, Arequipa, and Salten Skov soils are displayed in Figs 1a and b. The closed symbols in Fig. 1 display the data directly after dissolution. After 20–30 minutes the samples were purged with nitrogen to displace the dissolved oxygen. The pH and redox potential of the purged solutions are depicted by open symbols in Fig. 1. While the pH of Flat Top Hill (Yungay) and Foot of Slope (Arequipa) samples were near neutral (7.6 and 7.3, respectively), the pH was much lower for the Salten Skov and Top of Slope (Arequipa) samples (4.6 and 4.0, respectively). A pH of 4.6 for Salten Skov is in good agreement with the pH found by Nørnberg et al. (Reference Nørnberg, Schwertmann, Stanjek, Andersen and Gunnlaugsson2004). Upon nitrogen purging of the soil solutions the redox potential dropped to levels expected for systems dominated by the presence of sulfate. The trends in redox potential across samples is consistent with an redox potential increasing as sample pH decreases. After the pH and redox potential measurements, the soil solutions were centrifuged and the supernatants decanted off. The supernatants were diluted by a factor between 9.3 and 14.6 (Table 2), followed by conductivity and ion concentration measurements. The results for those measurements are also given in Table 2. The results show that the Foot of Slope (Arequipa) sample has a very high salt content, 50–500 times higher than the concentrations in the sample from the top of the same slope and Flat Top Hill sample (Yungay). The conductivity is also ~10 times higher for the Foot of Slope sample. The Foot of Slope sample shows high concentrations of Na+, K+, Mg2+, Ca2+, Cl−, NO2−, and SO42−, while the Top of Slope and Flat Top Hill samples' main constituents are Ca2+ and SO42−, with the other ions available at much lower concentrations.
pH (a) and redox potential (b) of different soils. Top of Slope (Arequipa) soil is designated by squares, Foot of Slope (Arequipa) by circles, Flat Top Hill (Yungay) by triangles, and Salten Skov by diamonds. The closed symbols refer to the dissolved samples in air, while the open symbols display the pH of the same samples purged with nitrogen. Time is counted from the moment of dissolution, while purging with nitrogen started immediately after the last non-purged measurement (last closed symbol in the graph).

Ion concentrations (ppm) and conductivity (mS cm−1) for three different soil samples. The values are corrected for dilution by the given dilution factor
a Below detection limit.
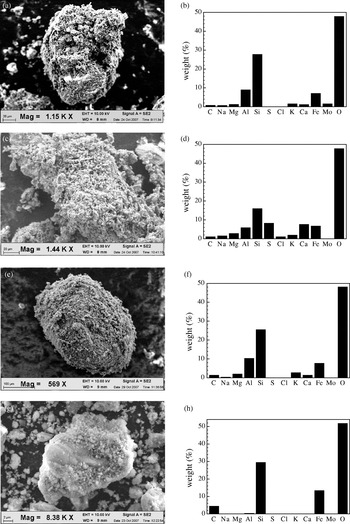
SEM pictures of the Arequipa, Yungay and Salten Skov soils are shown in Fig. 2. FESEM analyses exhibit morphologies recalling porous structure coating grains. Sands with micron-size grains are trapped, forming cushion-like pellets shading the soil beneath. More structured micro-crystals are also observable together with smooth variants forming aggregates. A highly porous structure retains water better, favouring the activation of dried micro-organisms. Elemental composition of the soil samples was measured with energy dispersive X-ray spectroscopy and the results are shown in the right panel of Fig. 2. All samples have an oxygen fraction of ~45 wt%. The silicon fraction varies between samples from ~30 wt% for the Top of Slope (Arequipa), Flat Top Hill (Yungai), and Salten Skov, to ~20 wt% for Foot of Slope (Arequipa). The iron content is around 7 wt% for most samples, while being higher (~13 wt%) for the Salten Skov sample.
Field emission scanning electron microscopy pictures of the soil samples. Electrons were accelerated to 10 kV. The pictures show (a) Top of Slope (c) Foot of Slope (e) Flat Top Hill and (g) Salten Skov. The magnification is given in each plot. The corresponding elemental compositions of the grains are shown in (b), (d), (f) and (h). The elemental composition was measured by energy dispersive X-ray spectroscopy at 15 kV detector voltage. The analysed region is ~1 μm in each direction. The bars in this figure show an average of 10 measurements, recorded at different locations of the sample.

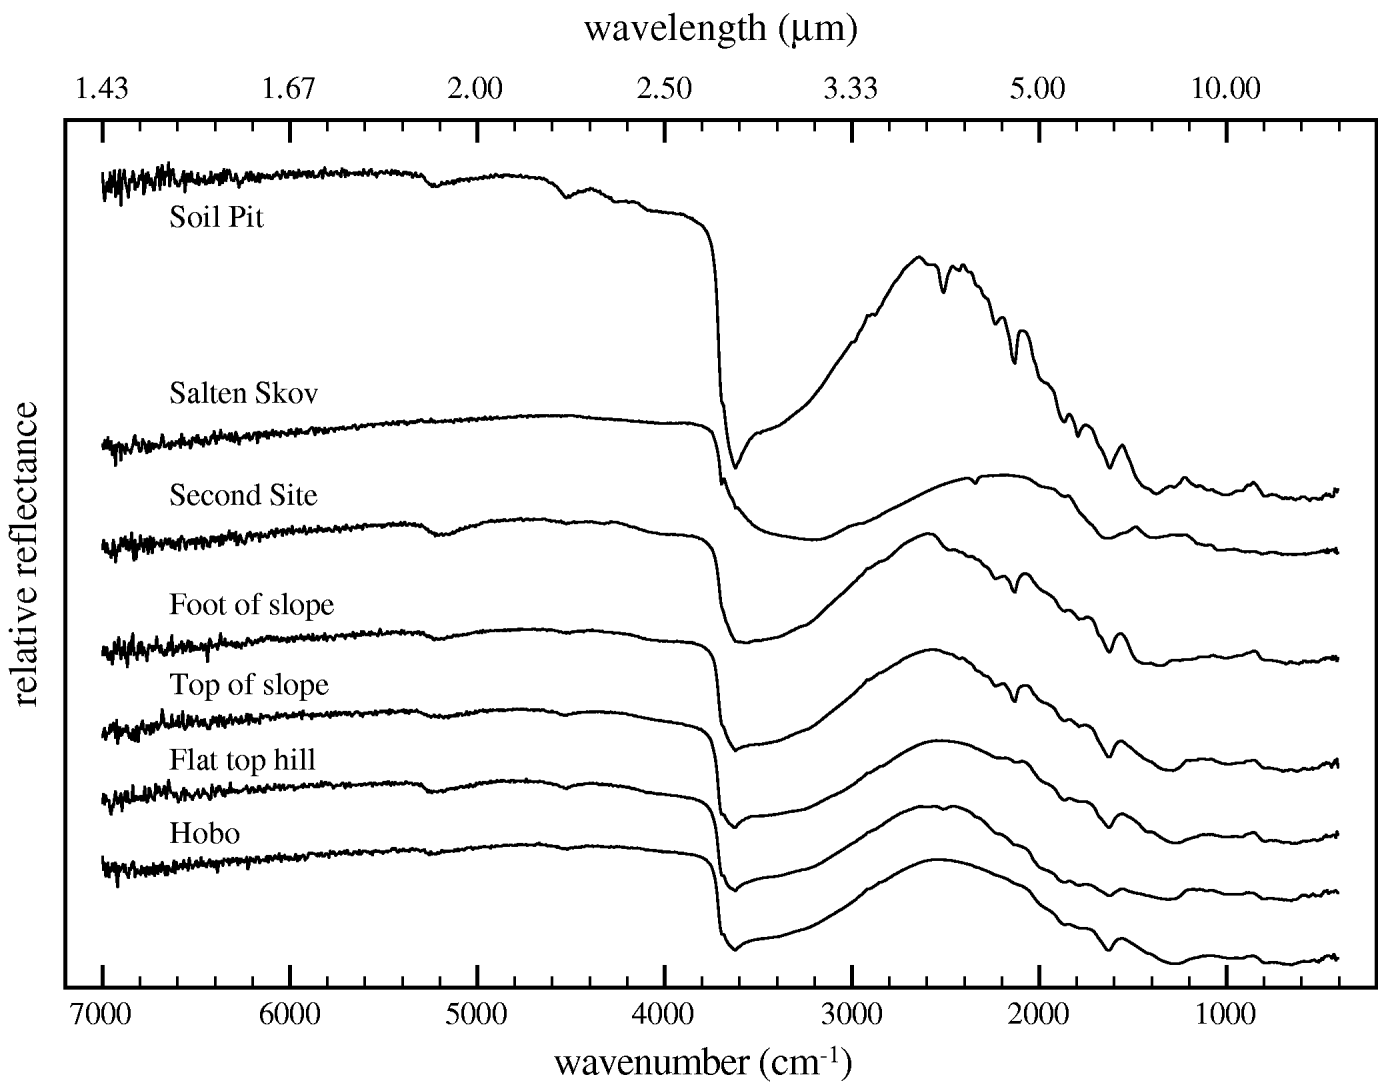
Figure 3 shows the diffuse reflectance infrared spectra of various soil samples. All spectra are on the same scale, but vertically offset. All samples have a very broad absorption band between 2600 and 3800 cm−1 due to adsorbed water or structural OH. This broad band has two superimposed features at 3620 and 3695 cm−1 related to dangling OH bonds that are present in all samples, although the relative intensities of these two features change between the samples. Other features of water are found at 1627 cm−1 in Soil Pit, Second Site and Foot of Slope, and 854 cm−1 in all samples except Salten Skov. Salten Skov has a band at 2345 cm−1 due to CO2 adsorbed or trapped in the matrix. Soil Pit additionally has intense features at 2511, 2234, 2130, and 1630 cm−1 that are also clearly observed in Second Site and Foot of Slope soils. Features at 2234, 2130 and 1630 cm−1 and EDX analysis clearly indicate the presence of calcium sulfate hydrate minerals in Soil Pit, Second Site and Foot of Slope samples. Carbonate salts show an intense feature around 2510 cm−1, which is observed in Soil Pit, Second Site and Flat Top Hill samples although with different intensities. Features at 1866 and 1793 cm−1 could also be associated with the presence of pyroxene jadeite, even if chlorite compounds are not completely excluded. The reflectance spectra measured for all the samples resemble those of andesitic rocks. In particular anorthite is the dominating mineral observed in all the Atacama desert samples: Top of Slope, Foot of Slope, Second Site, Hobo, Flat Top Hill, and Soil Pit. Andesite, instead, is observed in Foot of Slope, Second Site, Flat Top Hill, and Soil Pit (Salisbury et al. Reference Salisbury, Walter, Vergo and D'Aria1991; Esposito et al. Reference Esposito, Colangeli and Palomba2000). These data complement the X-ray diffraction (XRD) identification and indicate that several techniques are necessary to define accurately the mineralogical composition.
Infrared spectra of the soil samples. The spectra were recorded as diffuse reflectance spectra, relative to KBr reflectance, over the range 7000–400 cm−1 at a resolution of 2 cm−1. The spectra were obtained at low (1 mbar) pressure. All spectra are on the same scale, but offset in vertical direction.
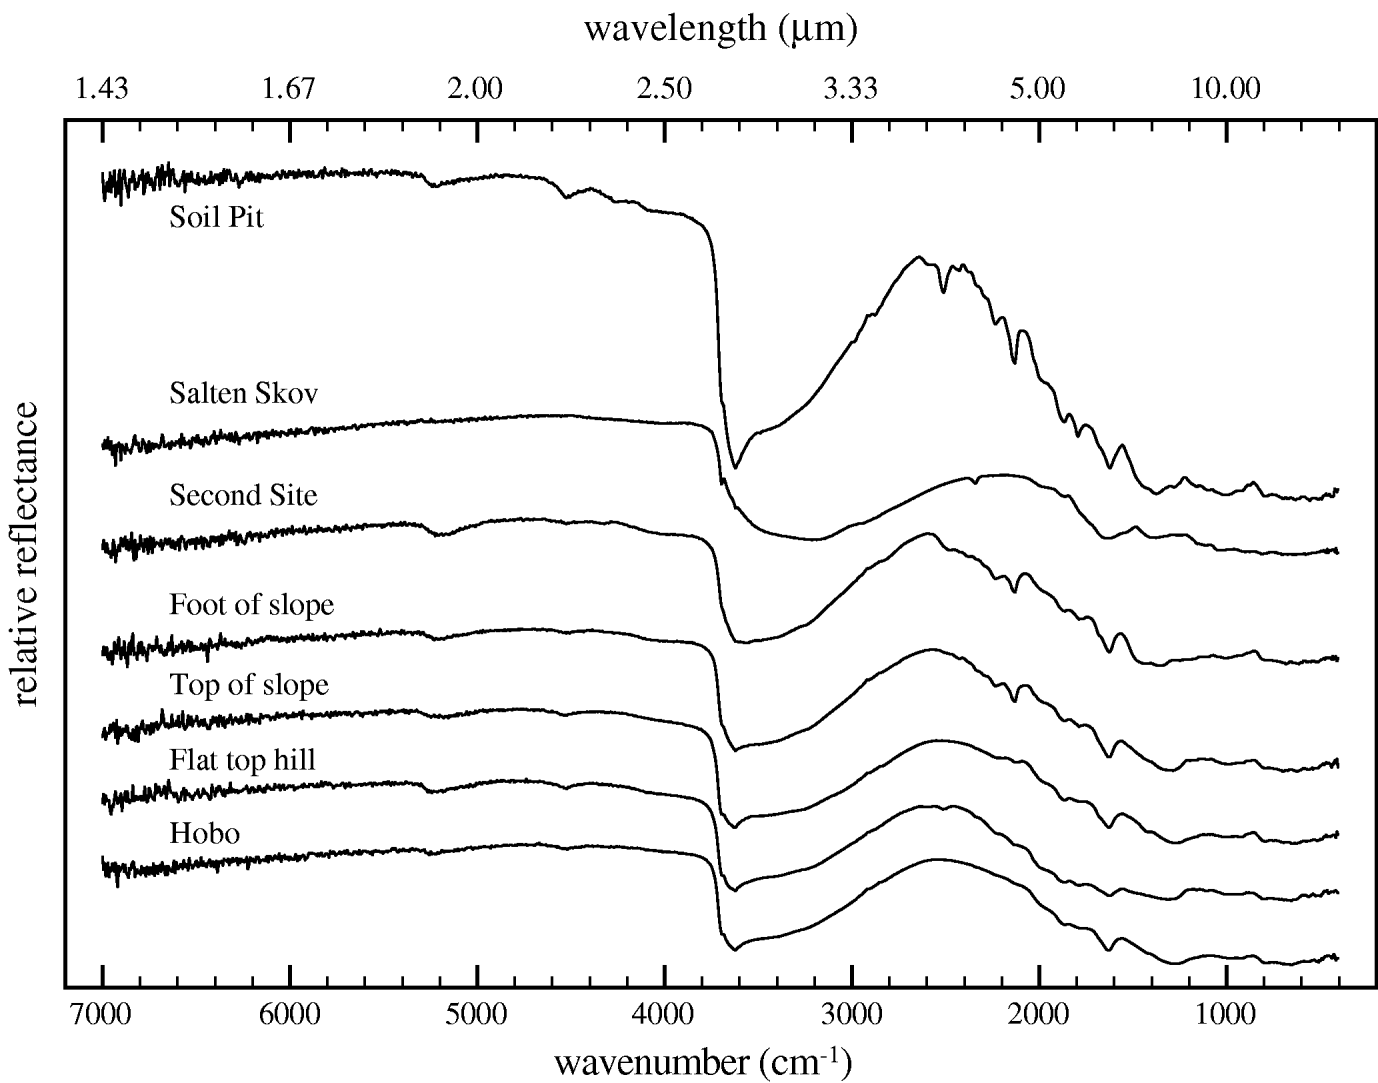
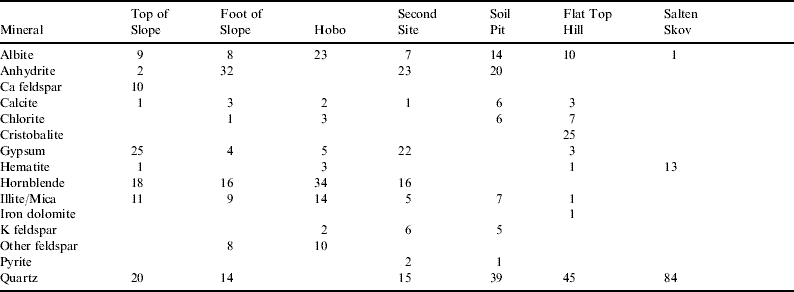
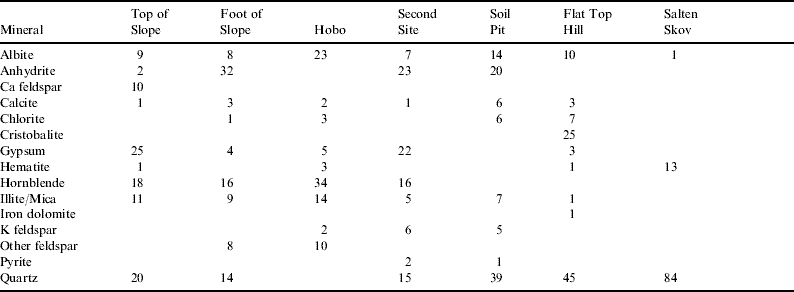
Table 3 displays XRD data measured as relative abundance in percent. The quartz fraction is between 15 and 20% in samples from the Arequipa region, and approximately twice as high in the soil samples from the Chilean part of the Atacama desert (Yungay). Flat Top Hill has up to ~70% of quartz when cristobalite is included. Salten Skov has the highest quartz fraction at 85%. The Peruvian soil samples are high in CaSO4, with the exception of HOBO (5%). Foot of Slope and Top of Slope have similar amounts of CaSO4 (respectively 36% and 27%), but in the Foot of Slope soil it is mainly in the form of anhydrite (CaSO4), while in the Top of Slope soil, gypsum (CaSO4⋅2H2O) is the dominating form. Second Site soil contains 45% CaSO4 in equal quantities of gypsum and anhydrite. Hematite is only found in Salten Skov at 13%, which is in good agreement with Nørnberg et al. (Reference Nørnberg, Schwertmann, Stanjek, Andersen and Gunnlaugsson2004).
X-ray diffraction data of Mars soil analogues (relative abundance in percent)
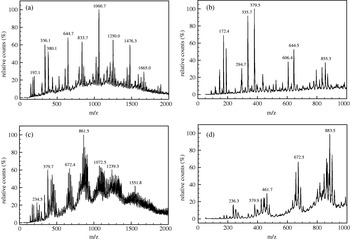
The organic content of the Atacama desert soils was measured with laser desorption–mass spectrometry (LD–MS). The soil samples were analysed using straight-up laser desorption without any further sample preparation. The resulting spectra are shown in Fig. 3. In all of the LD–MS spectra a variety of high-molecular-weight compounds up to at least 1900 atomic mass units (amu) was observed. Peaks at 335 and 380 m/z in the Foot of Slope (Arequipa) sample (Fig. 4(b)) are characteristic of cyclic alkenes that are derived from desert plants such as cacti. Other peaks in the spectra separated by 12 or 14 amu (for example around 600 amu mass peaks) can be assigned to the loss of hydrocarbon fragments C, CH, and CH2 from the parent ion. Mass separations of 16 and 32 amu may represent a loss of one or two oxygen atoms (e.g. 855, 833, or 817 m/z). The Top of Slope soil (Arequipa, see Fig. 4(a)) displays peaks at 644, 834, 1060, 1250 and 1476 m/z that all exhibit multiple mass unit clusters that may arise from several compounds incorporating the same distribution of fatty acids (e.g. phospholipids). Several high-molecular-weight mass unit clusters are also seen in the Second Site sample (Fig. 4(c)). The peaks within each cluster are separated by 12 or 14 amu and are, again, attributed to hydrocarbon fragments as seen in the soil collected from the Foot of Slope (Fig. 4(b)). The Second Site sample also displays a prominent high-mass envelope with peak separations of 12, 14 and 16 amu assigned to mass losses of carbon, methyl groups and oxygen (C, CH, CH2, and O) from the parent peak. These multiple clustered peaks may also be products of an insoluble macromolecular component such as kerogen or humic acids. Both of these constituents are not easily desorbed and/or ionized intact, resulting in the fragmentation of smaller side groups as is observed in all of the Arequipa soils. The Soil Pit (Yungay, Fig. 4(d)) sample displays a mass spectrum very similar to the Second Site sample, with peaks clustered in groups around 461, 672, and 883 m/z. Compared with Second Site, the Soil Pit sample shows less peaks within each cluster. An important future analytical technique to apply to these soil samples would be to perform tandem mass spectrometry (MS/MS) on some of the more prominent masses or ‘parent peaks’ observed in these spectra. This would allow for better characterization of the mass separations and may give some insight into the possible origin of the parent peaks (e.g. bacterial, plant etc).
Laser desorption–mass spectra (LD–MS) of (a) Top of Slope (Arequipa), (b) Foot of Slope (Arequipa), (c) Second Site (Arequipa), and (d) Soil Pit (Yungay). The molecules were desorbed directly from the soils with a 337 nm nitrogen laser at an intensity of 106 W cm−2.

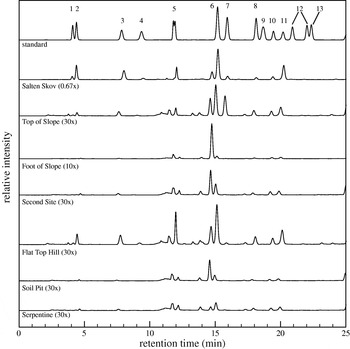
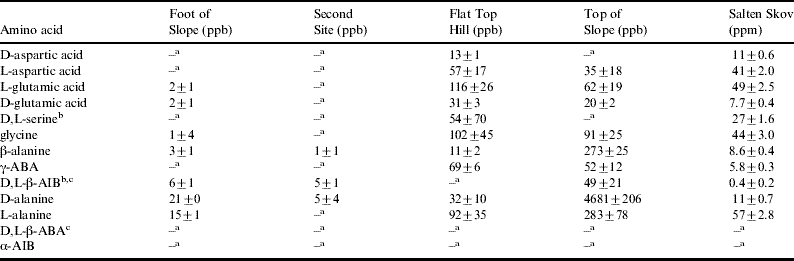
Abundances of the amino acids present in the Mars soil analogues were determined before the Mars simulation experiments were conducted. Figure 5 shows typical high-performance liquid chromatography with fluorescence detection (HPLC–FD) chromatograms of the acid-hydrolysed hot-water extracts of the soil samples, as well as a chromatogram of an amino acids standard and a chromatogram of a serpentine blank. The chromatograms were scaled for clarity; the scale factors are shown in brackets in Fig. 5. The abundances of the amino acid, in ppb by weight and corrected for any abundance found in the serpentine blank, are given in Table 4 along with the associated standard error margins. The desert soil samples Foot of Slope and Second Site from the Arequipa region and Soil Pit from the Yungay region all have low amino acid abundances of a few ppb, or even below the detection limit. Only the Top of Slope and Flat Top Hill samples had measurable levels of amino acids, with L-amino acids and glycine being the most abundant amino acids, while D-amino acids probably result from the racemization of microbial detritus. The measured amino acid distribution and the reported abundances are typical of Atacama soils (Buch et al. Reference Buch, Glavin, Sternberg, Szopa, Rodier, Navarro-González, Raulin, Cabane and Mahaffy2006) and other desert soils (Martins et al. Reference Martins2007b). Salten Skov has a very high amino acid content compared with the desert samples, with abundances in the order of parts per million. L-alanine, L-glutamic acid, glycine and L-aspartic acid are the most abundant amino acids, which is a typical sign of biological activity in the soil. The abundances for Salten Skov listed in Table 4 agree well with the values obtained by Garry et al. (Reference Garry, ten Kate, Martins, Nørnberg and Ehrenfreund2006).
HPLC–FD chromatograms of the OPA/NAC derivatized (1 min.) amino acid standard, acid-hydrolysed hot water extracts of Mars soil analogues, and a serpentine blank. The numbers in brackets are scale factors. The numbers in the chromatograms designate the identified peaks of 1. D-aspartic acid, 2. L-aspartic acid, 3. L-glutamic acid, 4. D-glutamic acid, 5. D- and L-serine, 6. glycine, 7. β-alanine, 8. γ-amino-n-butyric acid, 9. D- and L-β-aminoisobutyric acid, 10. D-alanine, 11. L-alanine, 12. D- and L-β-amino-n-butyric acid, and 13. α-aminoisobutyric acid. Peaks labelled with a * were not identified.

Abundances of selected amino acids as measured by HPLC–FD. The Soil Pit sample from the Yungay region did not yield any detectable amino acid abundance. The error margins are the standard error of the mean (SEM, n=7)
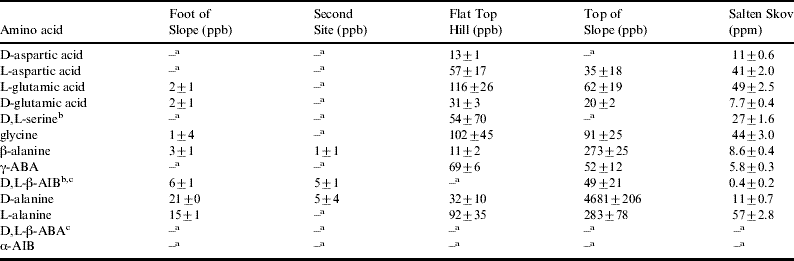
a below detection limit. b Enantiomers could not be separated under the chromatographic conditions. c Optically pure standard not available for enantiomeric identification.
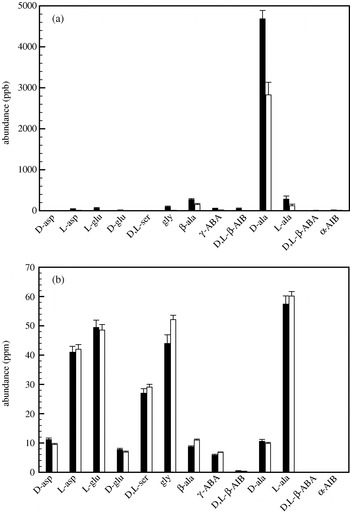
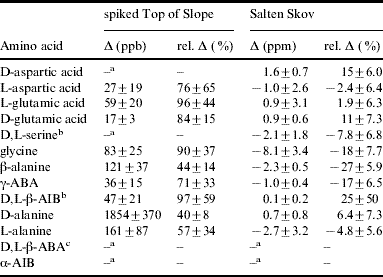
The goal of the Mars simulation experiments was to measure the stability of amino acids in Mars soil analogues after exposure to a simulated Martian environment. As the Arequipa samples contained low levels of amino acids, one sample (Top of Slope) was spiked with 4.5 ppm D-alanine before exposure to simulated Mars conditions. The Salten Skov and spiked Top of Slope samples were exposed to simulated Martian conditions of four diurnal cycles (an equivalent of four Martian sols). After exposure, amino acid abundances were determined using HPLC–FD as described for the non-exposed samples. The resulting abundances are shown in Figs 6a and b (white bars), along with the abundances of the non-exposed samples (black bars). The amino acid difference between the exposed and non-exposed samples is listed in Table 5. Negative values in Table 5 signify an increase in abundance. The Top of Slope sample from the Arequipa region contained very low abundances of amino acids (see Fig. 5). Most amino acids had a much lower abundance after exposure to the simulated Mars environment. A decrease of ~85% was observed for most amino acids (see Table 5). Of the 4.5 ppm D-alanine that were added to the soil before exposure 2.7 ppm were recovered, a difference of 40%. After exposure to Mars-like conditions, the Salten Skov sample still contained a high concentration of amino acids, in the ppm range rather than ppb for the other Mars soil analogue (see Fig. 5). The change in amino acid abundance in Salten Skov upon exposure varied per amino acid. Some amino acids (D-aspartic acid, L- and D-glutamic acid, α-amino-isobutyric acid (α-AIB), and D-alanine) showed a decrease, while others (L-aspartic acid, D,L-serine, glycine, β-alanine, γ-amino-n-butyric acid (γ-ABA), L-alanine, D,L-β-amino-n-butyric acid (β-ABA), and α-AIB) were found at increased levels after exposure. However, for most compounds the change was small and within the error margin. Only glycine, β-alanine, and γ-ABA displayed an increase in abundance after exposure that was larger than the associated error margin. The abundance change for α-AIB, β-AIB, and β-ABA is apparently large, but so is the associated error margin. This can be explained by the low abundances of these species in the original (unirradiated) Salten Skov sample.
Amino acid abundances in (a) Top of Slope (Arequipa) spiked with D-alanine and (b) Salten Skov. In each panel, the black bars give the abundance before exposure to a simulated Mars environment and the white bars after exposure. The error bars denote the standard error of the mean (SEM, n=7).

Absolute and relative differences (Δ) in amino acid abundance in Atacama and Salten Skov soils after exposure to simulated Mars conditions, shown in Fig. 6. The error margins shown in this table were propagated from the error bars in Fig. 6
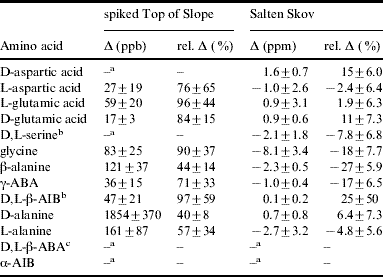
a below detection limit b Enantiomers could not be separated under the chromatographic conditions. c Optically pure standard not available for enantiomeric identification.
Discussion
Parts of the Atacama desert are among the driest places on Earth. For this reason, the soils in these desert regions have been used as analogues for the regolith of Mars (Navarro-González et al. Reference Navarro-González2003). Besides being extremely dry, the Martian regolith is also depleted in most organic compounds above ppb levels, as inferred from the Viking data (Biemann et al. Reference Biemann, Oro, Toulmin, Orgel, Nier, Anderson, Simmonds, Flory, Diaz, Rushneck and Biller1976, Reference Biemann1977; Biemann Reference Biemann2007). From the results in Table 4 it is clear that the Arequipa and Yungay soils are largely devoid of amino acids. This makes them ideal to use in Mars simulation experiments, especially in experiments where the stability of amino acids – and possibly other organics – are investigated. The two samples named Top of Slope and Foot of Slope were taken from the same slope in the Arequipa region, only meters apart. The data in Fig. 1 and Table 2 show a remarkable difference in chemical and physical properties between the two samples. The Top of Slope sample has a low pH (4.0) compared with the neutral pH (7.1) of the Foot of Slope sample. The ion concentrations in the Foot of Slope sample are 10–80 times higher than in the Top of Slope sample.
However, when the results of the pH, redox potential and ion concentrations measurements of the Top of Slope sample are compared with the Flat Top Hill sample from the Yungay region – 800 km south-east of the Arequipa region – they are very similar. The similarity extends to the amino acid abundances, which are low but measurable for both the Top of Slope (Arequipa) and Flat Top Hill (Yungay) samples. The abundances for those samples are in the range of 10–200 ppb. For the Arequipa samples Foot of Slope and Second Site and the Yungay sample Soil Pit, the amino acid abundances are mostly below the detection limit. Overall, the Arequipa and Yungay soils appear highly heterogeneous.
We have tested the stability of amino acids in the Top of Slope soil sample from the Arequipa region. Due to the low abundance of amino acids in that sample, the soil was spiked with D-alanine before exposure to a simulated Mars environment. The results in Fig. 6 and Table 5 show a decrease in amino acid abundance for the Arequipa soil, but not for the Salten Skov sample. Degradation of amino acids directly by UV radiation is possible (ten Kate et al. Reference ten Kate, Garry, Peeters, Quinn, Foing and Ehrenfreund2005), but UV radiation will be attenuated by the first layer of soil grains it encounters. Direct degradation by UV radiation in the absence of Aeolian processes would therefore only photolyse the amino acids that are located on top of the soil grains and a destruction of only a few per cent would be the result. However, Fig. 6 and Table 5 show that the loss of amino acids is much larger for the Arequipa sample, which implies that additional mechanisms for degradation are active. The Mars simulation experiments were conducted in a diurnal cyclic mode. The Mars simulation chamber contained less than 14 ppm water during the experiment (see above), comparable to the lower end of the range in which water vapour varies in the Martian atmosphere, between 10 and 1000 ppm (Encrenaz et al. Reference Encrenaz, Lellouch, Atreya and Wong2004). Upon cooling of the samples, water froze from the atmosphere onto the samples. Table 2 shows that the Top of Slope sample from the Arequipa desert contains 64 ppm NO3−. When the samples are irradiated, photoactivation of nitrate can occur and, through interactions with adsorbed water, result in the production of OH radicals. Similar UV-assisted reactions with soil metal oxides can also result in the production of OH radicals in soils. In combination with iron-bearing minerals, a photon-enhanced Fenton-type (photo-Fenton) reaction can occur.
Recent research has shown that OH radicals and H2O2 can also be formed by mechanical pulverization of basaltic rocks, i.e. by impact and Aeolian abrasion (Hurowitz et al. Reference Hurowitz, Tosca, McLennan and Schoonen2007). Radicals produced in the above reactions can oxidize the amino acids in the soil, leading to their destruction. The loss of amino acids in the Top of Slope sample from the Arequipa region is ~40%, while for Salten Skov, exposed to the same conditions, the loss is marginal. The production of radicals and the linked degradation of amino acids are dependent on the mineralogical composition of the soil. Salten Skov is mainly composed of goethite, with additions of hematite and maghemite (12.8 wt% and 5.5 wt%, respectively, Nørnberg et al. Reference Nørnberg, Schwertmann, Stanjek, Andersen and Gunnlaugsson2004). The mineralogy for the Top of Slope sample shows gypsum and quartz in relative abundance of ~20% and contains calcium and sulfate ions (see Table 2). The Top of Slope was sampled from the top layer, which included a duricrust. Our results indicate that the mineral matrix can effectively influence the degradation of organic material in the soils.
Recent space missions, including orbiters and rovers such as Mars Global Surveyor, Mars Odyssey, the Mars Exploration Rovers, Mars Express and Mars Reconnaissance Orbiter have strongly enhanced our knowledge of the mineralogical composition of the Martian surface. Many of the minerals identified in the investigated Mars regolith analogues, including sulfates, have recently been found on Mars. Chevrier & Mathé (Reference Chevrier and Mathé2007) give a comprehensive overview of the mineralogical details found by the Mars Exploration Rovers and Mars Express, which include phyllosilicates, serpentine, sulfate minerals, goethite, hematite, and widespread anhydrous ferric oxides. Hydrated ferric oxides (Morris et al. Reference Morris2006) and hydrated sulfate minerals have been identified in numerous studies (Squyres et al. Reference Squyres2004b; Bibring et al. Reference Bibring2005; Gendrin et al. Reference Gendrin2005; Grotzinger et al. Reference Grotzinger2005; Bibring & Langevin Reference Bibring, Langevin and Bell2008). Hydrated phyllosilicates have been identified by the Mars Express OMEGA instrument and are of particular importance for the search for life, revealing the aqueous history of Mars (Poulet et al. Reference Poulet, Bibring, Mustard, Gendrin, Mangold, Langevin, Arvidson, Gondet and Gomez2005; Bibring et al. Reference Bibring2006; Bishop et al. Reference Bishop2008). Amorphous silicate deposits (Squyres et al. Reference Squyres2008) and putative chloride salt deposits (Osterloo et al. Reference Osterloo, Hamilton, Bandfield, Glotch, Baldridge, Christensen, Tornabene and Anderson2008) have been reposted. The investigation of Victoria crater showed that this eroded impact crater was formed in sulphate-rich sedimentary rocks and shows evidence for regional water-induced alteration (Squyres et al. Reference Squyres2009). Results from the Phoenix mission have yielded new insight into the composition of the Martian soil. A slightly alkaline soil pH measured by the Phoenix Wet Chemical Laboratory and CO2 release in the Thermal Evolved Gas Analyzer indicates the presence of calcium carbonate (Boynton et al. Reference Boynton2009). The dominate soluble anion measured by the Wet Chemical Laboratory was perchlorate (Hecht et al. Reference Hecht2009). Although natural occurrences are relatively rare on Earth, the most abundant (naturally occurring) deposits are found in Atacama desert soils (Ericksen Reference Ericksen1981).
In the Atacama, soils frequently are composed of primary silicate minerals (pyroxene, feldspar, and quartz), and small amounts of iron oxides/hydroxides, carbonates, clays, and zeolites. Deposits of sulfates, perchlorates, iodates, bromates, and particularly nitrates are likely to have formed through several mechanisms including deflation around playas and spring deposits (Rech et al. Reference Rech, Quade and Hart2003). However, many of the deposits are heavily concentrated soil horizons, formed by the accumulation of soluble constituents over long time spans (Ericksen Reference Ericksen1981). The ultimate origin of these salts (and their elements) is in some cases obscure, but it appears that they are of atmospheric origin (Ericksen Reference Ericksen1981; Böhlke et al. Reference Böhlke, Erickson and Revesz1997). The porous aggregate morphology of desert soils (confirmed by FESEM) retains water better, favouring the survival of micro-organisms in very dry soils. Desert micro-organisms can gather enough moisture from rainfall and/or condensation to support their growth, but numbers are drastically reduced when the soil dries out. Some can produce cysts, spores or mucilage, which reduce the rate of water loss and enable them to survive anhydrobiotically.
Field and laboratory studies in support of future landing site selection for the next Martian surface probes such as Mars Science Laboratory and Exomars are vital. Several landing sites have been proposed for future habitability studies, including Mawrth Vallis, Nili Fossae, Meridiani Planum, Holden Crater and Gale Crater. Mawrth Vallis shows the strongest alteration measured to date and phyllosilicate minerals that are integrated with ancient bedrock. Meridiani Planum south shows a mixture of sulphate-bearing terrain and ancient phyllosilicate-containing bedrock (Michalski et al. Reference Michalski, Bibring, Poulet, Mangold, Loizeau, Hauber, Altieri and Carrozzo2008).
However, instrument capabilities and conservation of organic material in the mineralogical matrix will determine how efficiently organic material can be extracted and identified. This is where an extensive preparation phase in Earth laboratories and the described results play an important role: to define scientific criteria, construct habitability models and provide constraints for future landing sites. The successful selection of landing sites for future surface missions on Mars will also be a crucial step in the pathway to an international Mars Sample Return mission.
Conclusion
We have obtained soil samples from different regions of the Atacama desert, and measured the physical and chemical properties of those samples including pH, redox potential, ion concentrations, conductivity, the organic content, and more specifically the amino acid abundance. The results show that samples which are located close together, separated by only a few meters, can vary strongly in chemical and physical properties. HPLC–FD measurement of hot-water extracts of the Arequipa and Yungay soil samples show that they are largely devoid of amino acids, although there is variation between the samples. Three desert soil samples (two Arequipa and one Yungay) have amino acid abundances near or below the detection limit, while two others (an Arequipa and one Yungay sample) have abundances in the 10–200 ppb range. This is still a factor of 100 lower than the precipitated sediment of Salten Skov, which has amino acids in the ppm range. One of the Arequipa desert samples (Top of Slope) and the Salten Skov sample were exposed to a simulated Mars environment of four Martian diurnal cycles. The Arequipa desert soil showed low amino acid abundance after exposure to the simulated Mars environment, whereas Salten Skov did not show a significant change. The Salten Skov sediment may protect the amino acids from destruction but more experiments with longer exposure times are needed to verify this conclusion. The mineralogical composition of the soil influences the stability (or destruction) of the amino acids. It is therefore important that future missions to Mars consider the complex interactions between organic compounds and the mineralogy of a proposed landing site, to increase the chance of finding organic molecules on Mars.
Acknowledgements
PE and ZP were supported by grant NWO-VI 016.023.003 and ESA grant for Ground based facilities: ‘Simulations of organic compounds and micro-organisms in Martian regolith analogues: SocMar’. This work is conducted in the framework of being the Recognized Cooperating Laboratory/Geochemistry for Mars Express. PE is also supported by NASA grant NNX08AG78G and the NASA Astrobiology Institute NAI. ZP is also supported by NASA grant NNG05GL46G and the Goddard Center for Astrobiology. ZM was supported by Fundação para a Ciência e a Tecnologia (scholarship SFRH/BD/10518/2002). ZM and MAS also acknowledge financial support from the Science and Technology Facilities Council (STFC). This research was conducted in the framework of the Mars Express Recognized Cooperating Laboratory for geochemistry. JRB activity is supported by ASI contract I/015/07/0. We thank Lauren Fletcher for logistic support in the Arequipa desert.