Herbicides have been an important and effective tool in weed management worldwide, and usage of herbicides below recommended doses has always been the point of interest. However, there are some concerns over the use of herbicides at below-label rates such as partial or complete weed control failure resulting in reduced crop yields, increased weed seed production (O’Donovan et al. Reference O’Donovan, Harker, Blackshaw and Stougaard2003), and evolution of herbicide resistance (Manalil et al. Reference Manalil, Busi, Renton and Powles2011). Although there are perceived negative effects of herbicide usage, a complete elimination of them in weed management is not a practical solution. Therefore, to avoid overreliance on herbicides, other useful weed management practices may need to be integrated to control weeds effectively.
Cultural practices that enhance crop competitive ability, such as increased crop seeding rate and reduced crop row spacing, can increase weed suppression and improve crop yields (Kirkland Reference Kirkland1993; O’Donovan et al. Reference O’Donovan, Newman, Harker, Blackshaw and McAndrew1999; Zhao et al. Reference Zhao, Bastiaans, Atlin and Spiertz2007). Ahmed et al. (Reference Ahmed, Salim and Chauhan2014) reported greater weed suppression and reduced yield losses when rice (Oryza sativa L.) seed rate was increased from 20 to100 kgha−1. Recent work in organically grown lentils in Canada has shown that seeding rate should be greater than the recommended rate for conventionally grown lentils and that increasing seeding rate to 375seedsm−2 provided maximum yield and weed suppression (Baird et al. Reference Baird, Shirtliffe and Walley2009). Increasing crop–weed competition by increasing seeding rates has been found to be an effective tactic that can be integrated with other methods (Lemerle et al. Reference Lemerle, Lockley, Koetz and Diffey2013; Walsh and Powles Reference Walsh and Powles2007). Similarly, Blackshaw et al. (Reference Blackshaw, O’Donovan, Harker, Clayton and Stougaard2006) proposed that cultural practices that increase crop competition and decrease weed density can be used in combination with herbicides as part of an integrated weed management strategy. Although some studies have shown empirically that lower herbicide rates are more likely to be effective at greater than recommended seeding rates, no comprehensive study that investigates how seeding rate alters the dose–response curve measuring herbicide efficacy has been performed (Barton et al. Reference Barton, Thill and Shafii1992; Blackshaw et al. Reference Blackshaw, O’Donovan, Harker, Clayton and Stougaard2006; O’Donovan and Newman Reference O’Donovan and Newman2004; Walker et al. Reference Walker, Medd, Robinson and Cullis2002).
The relationship between herbicide dose and plant response has been well studied using different dose–response models (Seefeldt et al. Reference Seefeldt, Jensen and Fuerst1995). However, this approach has been somewhat underutilized in the area of integrated weed management, where more than one weed control tactic is employed. Dose–response models can be used to explore the relationship between the herbicide rate and cultural practices that alter crop competition such as crop seeding rate. Previously, O’Donovan and Newman (2004) attempted to explain the relationship between seeding rate and herbicide rate using dose–response models. Their study showed markedly improved weed control with increased seeding rates in a canola–barley (Brassica napus L.--Hordeum vulgare L.) rotation when reduced herbicide rates were applied.
When crop seeding rate is increased and the competitive balance with weeds is altered, it is believed that the parameters of the dose–response curve will shift, and herbicide efficacy will increase. Practically, this shift in the dose–response curve would mean that producers could achieve acceptable weed control when applying less efficacious herbicides and in conditions when herbicides fail to achieve good efficacy due to environmental conditions. The impacts of these interactions on grain yield and weed suppression are important for informed decision making for producers. Therefore, this study aimed to understand how dose–response analysis can be used to examine the herbicide rate–seeding rate relationship and more precisely describe how seeding rate influences the parameters of the herbicide dose–response curve.
For this study, we used lentil as a test crop. Lentil’s short stature, slow canopy closure, and relatively slow development rate make it a poor competitor against weeds (Kirkland et al. Reference Kirkland, Holm and Stevenson2000). However, increasing the seeding rate of lentil can greatly alter its competition with weeds (Baird et al. Reference Baird, Shirtliffe and Walley2009). To test this concept we applied varying rates of the broadleaf herbicide fluthiacet-methyl to lentil sown at different target plant densities. The current rate of fluthiacet-methyl usage is in the range of 3 to 15 g ai ha−1 (Shaner 2014). We chose this herbicide because it is being evaluated as an alternative herbicide in lentil to control acetolactate synthase (ALS) herbicide–resistant broadleaf weeds, which are widespread in lentil-growing areas. In previous trials (unpublished data) fluthiacet-methyl showed partial control of broadleaf weeds, but lentil tolerance was marginal. We hypothesize that increasing the crop seeding rate will alter the dose–response curve to allow for acceptable weed control at lower herbicide doses. We chose the imidazolinone-resistant crop, Indian mustard [Brassica juncea (L.) Czern.] as the model weed, as it is genetically and morphologically similar to wild mustard, which is the primary ALS-resistant weed in lentil production.
Materials and Methods
Site Description and Experimental Design
Field experiments were conducted at two locations near Saskatoon, SK, in 2012 and 2013. Sites were located at the Kernen Crop Research Farm (KCRF) (52.27°N, 106.85°W; Sutherland orthic dark brown loam; 10% sand, 40% silt, and 50% clay) and Skarsgard Research Farm (SKARS) (52.08°N, 106.72°W; Elstow orthic dark brown loam; 28% sand, 55% silt, and 17% clay) in 2012, and in 2013 sites were located at KCRF and Goodale Crop Research Farm (GOOD) (52.10°N, 106.82°W; Bradwell fine sandy loam; 42% sand, 41% silt, and 17% clay).
The experimental design was a two-way factorial randomized complete block design with four replicates. The first factor was seeding rate with four levels, targeting 70, 140, 280, and 560plantsm−2. These seeding rates were calculated based on the actual germination percentage of the seed lot and a mortality rate of 10% in an attempt to achieve the desired plant stand. The current recommended lentil seeding rate in western Canada is 140plantsm−2 (Saskatchewan Pulse Growers [SPG] 2012). The second factor was rate of the herbicide fluthiacet-methyl (Cadet™) herbicide with seven levels of herbicide rate. Fluthiacet-methyl herbicide was chosen, as it was showing potential for in-crop registration in lentil (C Willenborg, personal communication). A plot size of 2.25 by 6 m was used at all sites.
Experimental Procedures
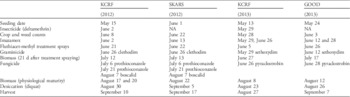
The lentil variety ‘CDC Improve’ was obtained from a local pedigreed seed grower (LL Seeds, Lumsden, SK) and seeded in each plot. CDC Improve is a large green imidazoline-tolerant variety, identified in previous University of Saskatchewan research to have the greatest tolerance to fluthiacet-methyl among current germplasm (C Willenborg, personal communication). Lentils were seeded using a cone seeder with disk openers on 20-cm row spacing at a depth of approximately 4 cm. Tag Team® fungal and rhizobial granular inoculant was applied with the seed at the recommended rate of 4.6 kgha−1 (Novozymes, Saskatoon, SK). Granular 11-52-0 fertilizer was applied mid-row in accordance with soil test recommendations. Immediately following lentil seeding, ‘Xceed’ canola-quality Indian mustard was seeded perpendicular to the direction of lentil at a rate of 100 seeds m−2 as a proxy for wild mustard. Seeding rates for both the lentils and the Indian mustard were adjusted for thousand-kernel weights and percent germination. All plots were treated with glyphosate at a rate of 450 g ai ha−1 before seeding. Non-target weeds, insects, and diseases were controlled using pesticides at recommended label rates (Table 1).
Field operations for the dose–response study.

Fluthiacet-methyl was applied at rates of 0, 0.94, 1.87, 3.75, 7.5, 15, and 30 g ai ha−1 with Agral-90 surfactant at 0.5% v/v when Indian mustard reached the 2- to 3-leaf stage at SKARS and KCRF in 2012 and 2013, respectively. However, at KCRF and GOOD in 2012 and 2013, rain caused application to be delayed to the 5- to 6-leaf stage of the Indian mustard. Applications of fluthiacet-methyl were made with a tractor-mounted sprayer equipped with Airmix™ 100015 nozzles (Greenleaf Technologies, Covington, LA) calibrated to deliver a volume of 150 Lha−1 at 275 kPa.
Crop and weed density counts were taken at the 4-node stage of the crop. Two 0.25-m2 quadrats were counted per plot. Lentil plants were counted and recorded; wild mustard and other weedy plants were identified by species and enumerated. Crop and weed biomass sampling was conducted at 21d after fluthiacet-methyl application and again at crop physiological maturity in two 0.25-m2 quadrants. The crop was separated from the weeds, and the wild mustard was subsequently separated from the other weed species. Samples were oven-dried at 70 C for 48 h and then weighed.
Disease severity ratings were calculated by estimating a percentage for the area of the plot exhibiting severe disease and for the area of the plot exhibiting little to no disease. Percentage of plant surfaces exhibiting disease symptoms within each of these two areas was then determined. For each area, the percentage of plant surfaces exhibiting symptoms was multiplied by the portion of the plot occupied by that area. These two values were summed together to arrive at a final disease severity rating (Madden et al. Reference Madden, Hughes and van den Bosch2007).
The plots were desiccated with diquat (Reglone™, Richardson Pioneer, Saskatoon, SK) at a rate of 415 g ai ha−1 when the bottom third of the lentil pods had turned a tan color and rattled when shaken (SPG 2012). Once dry down occurred, the middle 1.8-m section of the plots was harvested with a plot harvester. The harvested samples were cleaned using a KornService™ machine (Continental Agra, Newston, KS), and dockage was recorded. The samples were then weighed to determine clean yield, and thousand-kernel weights were taken.
An economic analysis was performed to determine differences between treatments in net profits. Revenue for seed yield for each treatment was discounted by the costs associated directly with the weed control treatments. Assumptions made in this analysis (based on data available at the time of analysis) were that pedigreed large green lentil seed cost Can$0.38 per pound, and the crop had a selling price of Can$0.22 per pound. The cost of fluthiacet-methyl herbicide was difficult to discern, as it is not currently available for purchase in western Canada. A cost of Can$315 per liter was assumed based on what comparable herbicides currently sell for locally and the value of the herbicide in the United States (information from online farm message boards). Cost of herbicide application was based on the Saskatchewan Ministry of Agriculture Farm Machinery Custom Rate and Rental Guide (SMA 2013).
Statistical Analysis
Statistical analysis was conducted using the ‘drc’ package (Ritz and Streibig 2005) of R (R Core Team 2013) and the MIXED procedure in SAS (SAS Institute 2011). PROC MIXED was used to conduct variance components analysis and remove the variation for site and replicate. These adjusted data were then used to construct nonlinear models with the ‘drc’ package in R. Data were analyzed separately for each year due to highly significant treatment by year interactions. When data were examined for individual years, there were no site by treatment interactions, and all models converged in DRC.
The three-parameter log-logistic model was used to model early wild mustard biomass in both years and late wild mustard biomass in 2012 (Equation 1). However the four-parameter log-logistic model better fit the late wild mustard biomass data collected at maturity in 2013 (Equation 2). In the four-parameter model, Y represents mustard biomass, d and c parameters represent the upper and lower horizontal asymptotes, respectively, the e parameter is commonly referred to as the ED50 and describes the dose required to reduce biomass by 50%, while the b parameter describes the slope around the ED50. The three-parameter model is a simplification of the four-parameter model in which the c parameter (lower asymptote) is fixed at 0. In both 2012 models and in the 2013 maturity model, a strong heterogeneity of variance was noted, and the optimal Box-Cox transformation was applied to correct for heterogeneity and ensure true SEs were reported (Box and Cox 1964).
 $$Y\, {\equals}\, {d \over {(1{\plus}{\rm exp}\{ b({\rm log}\left( x \right)\, {\minus}\, {\rm log}(e))\} }}$$
 $$Y\, {\equals}\, c{\plus}{{d\, {\minus}\, c} \over {\left( {1{\plus}{\rm exp}\left\{ {b\left( {{\rm log}\left( x \right)\, {\minus}\, {\rm log}\left( e \right)} \right)} \right\}} \right]}}$$
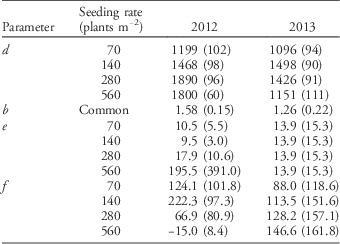
The four-parameter Brain-Cousens hormesis model was used to model yield data (Equation 3) (Brain and Cousens 1989). Hormesis occurred where low doses of herbicide caused a stimulation in lentil yield. In this equation, both the b and e parameters lack a direct biological interpretation. The d parameter represents the upper asymptote. The f parameter indicates the magnitude of the hormesis response.
Model selection for all models was based on criteria of lack-of-fit test and examination of model fit to the data and of the model residuals. In some cases no differences existed between parameter estimates among the four seeding rates. When this occurred a common parameter was fit when doing so resulted in an improved model lack-of-fit test statistic.
 $$Y\, {\equals}\, {{d{\plus} fx} \over {1{\plus}{\rm exp}\{ b({\rm log}\left( x \right)\, {\minus}\, {\rm log}(e)\} }}$$
Measurements of crop emergence, crop biomass, and disease severity ratings were examined using mixed-model analysis in SAS. The effects of seeding rate and herbicide rate were treated as fixed effects. The effects of site and replicate nested in site were considered random factors. Least squared means were used to determine treatment differences with significance declared at P<0.05.
Results and Discussion
In this study, lentil densities ranged from 69% to 79% of the targeted plant population and there was no statistical difference in percent emergence between any of the seeding rates (unpublished data).
Weed Biomass
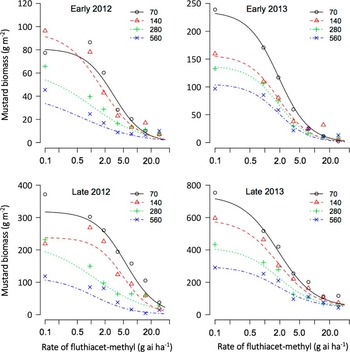
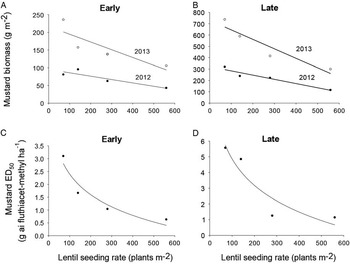
Increasing seeding rate resulted in a reduction in mustard biomass when fluthiacet-methyl was not applied or applied at low rates (Figure 1). In each year of the study at both the early and late biomass timings, increasing seeding rate resulted in a near-linear relationship between increased seeding rate and the value of the d parameter, which indicates that less mustard biomass was present in the untreated plots at increased seeding rates (Figure 2A and B).
Dose–response curves for early and late mustard biomass in 2012 and 2013. Curves indicate seeding rates (plants m−2).

Effect of lentil seeding rate on mustard biomass and ED50 at both early (A and C) and late (B and D) sampling in 2012 and 2013, respectively.

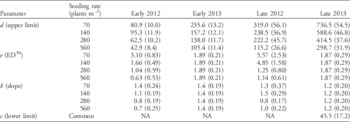
In 2012 increasing seeding rate lowered ED50 value at both early and late biomass timings (Table 2). At the early biomass timing, a relatively constant reduction in ED50 was observed as seeding rate increased (Figure 2C). At the late biomass timing, there was a large difference between the ED50 values of the lowest two seeding rates and the highest two seeding rates (Figure 2D). ED50 was 3.6 g ha−1 lower for the 280 plants m−2 targeted rate than for the 140 plants m−2 targeted rate (Table 2).
Model parameter estimates for early and late wild mustard biomass with SEs in parentheses.Footnote a

a Lack-of-fit test statistics for early 2012 and 2013 models and late 2012 and 2013 models are 0.8374, 0.9998, 0.9515, and 0.9728, respectively.
In 2013 ED50 was not affected by increasing seeding rate and a common ED50 parameter was fit to all four seeding rate curves. This ED50 estimate is much lower than the 2012 estimates for the lower two seeding rates. The ability of seeding rate to cause such a significant reduction in the d parameter (mustard biomass of the unsprayed check plots) meant that although ED50 was not reduced by increasing seeding rate in 2013, there was still less actual mustard biomass in the plots at a given seeding rate up to the 7.5 g ha−1 rate.
Increasing the crop seeding rate results in the alteration of the dose–response curve for mustard biomass. In both years the d parameter was reduced (Table 2) as the competitive effect of increased crop density resulted in lower mustard biomass in the unsprayed plots. Increasing seeding rate resulted in lower weed biomass at all but the highest herbicide rates in both years. This agrees with previous findings in other crops (O’Donovan and Newman Reference O’Donovan and Newman2004; O’Donovan et al. Reference O’Donovan, Harker and Clayton2001). In 2012 the ED50 parameter was lower at increased seeding rates.
Crop Seed Yield
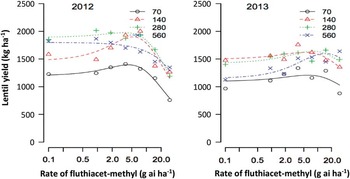
In general, lentil seed yield increased because of reduced mustard biomass at all seeding rates as herbicide rate was increased up to the herbicide rate of 7.5 gha−1. Seed yield then generally decreased at herbicide rates above 7.5 gha−1, presumably due to the phytotoxic effects of the herbicide on the lentil plants (Figure 3). Greatest yields in this study were generally obtained at targeted seeding rates of 140 and 280 plants m−2, with reduced yields at lower and higher rates (Figure 3).
Lentil seed yield models for 2012 and 2013 indicate a general trend of yield increasing until rates of fluthiacet-methyl exceed 7.5 g ai ha−1. Model lack-of-fit test statistics for 2012 and 2013 yield models are 0.7023 and 0.8537, respectively (Equation 3). Curves indicate seeding rates (plants m−2).

In 2012 the 140 and 280 targeted seeding rates achieved similar yields when herbicide was applied at rates of 3.75 or 7.5 g ha−1. However, at herbicide rates below 3.75 g ha−1, the yields were significantly lower for 140 plants m−2 when compared with the 280 plants m−2 targeted seeding rate (Figure 3). Therefore, it is implied that the 140 plants m−2 targeted seeding rate was much more reliant on herbicide application to achieve higher yield. In 2013 the greater reliance on herbicide application to achieve maximum yield observed in the 140 plants m−2 targeted rate versus the 280 plants m−2 targeted seeding rate observed in 2012 was not seen, and yield remained relatively stable at both seeding rates.
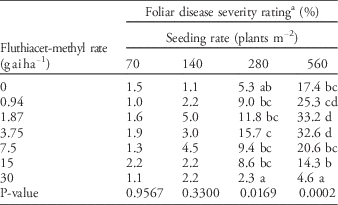
Interestingly, at 560 targeted plants m−2, a yield decline was observed for 2012 all along the curve as herbicide rate was increased. It is believed that the seed yield was affected by agronomic responses other than increased weed control. There was greater lodging than recorded for the recommended seeding rate at one of the two locations in 2012 (unpublished data). Disease was also much more severe in the 560 plants m−2 targeted rate treatment than any other treatment at both locations in 2012 (Table 3). The 560 plants m−2 rate in either year did not generally yield as high as the 140 and 280 plants m−2 rates, and this is likely also explained in part by the effect of intraspecific competition among the lentil plants (Table 4). Reduction of yield due to intraspecific competition at high seeding rates has been documented (Forbes and Watson Reference Forbes and Watson1992).
Foliar disease severity ratings in 2012.

a Mean values followed by different letters within columns are significantly (P≤0.05) different.
Parameter estimates for lentil yield models in 2012 and 2013 with SEs shown in parentheses.

Increasing seeding rate in the crop beyond the targeted rate of 140 plants m−2 did not result in increased maximum yields when fluthiacet-methyl was applied at 3.75 g ha−1 or more in 2012. In 2013 the 280 plants m−2 targeted seeding rate occasionally achieved slightly greater yield than the 140 plants m−2 rate, but not with any pattern or regularity. These results indicate that although increasing seeding rate may help to achieve greater weed biomass reduction, this will not always result in increased yield, particularly if herbicides can be applied at sufficient rates to provide effective weed control. Yield increases may be achieved in some years with increasing seeding rate if no herbicide is applied, or if herbicide efficacy is poor. An herbicide such as fluthiacet-methyl, which can cause significant crop injury in the available lentil germplasm, may only be an option in lentil if usage rates are kept relatively low, which resulted in low efficacy on wild mustard. Thus the low efficacy of this herbicide at these rates does not provide adequate control of mustard. However, increasing the crop seeding rate interacts with lower rate fluthiacet-methyl application, allowing for greater control of wild mustard and higher crop yields. The complementary effect of crop seeding rate and herbicide application does have agronomic constraints, as increasing seeding rate to 560 plants m−2 resulted in lower crop yield even though weed control was improved. Agronomic problems associated with excessive crop density observed in this study were increased lodging and disease severity (unpublished data).
Nonlinear dose–response curves were used to determine the level of interaction between herbicide dose and crop seeding rate in terms of integrated weed management. In 2013 the herbicide appeared to have a greater phytotoxic effect on both crop and weed. The better efficacy resulted in the ED50 and lentil yield not changing with increasing seeding rate in 2013. These results indicate that when herbicides effectively control weeds, increased seeding rates may not be beneficial. However, increased seeding rate was able to maintain yield at lower application rates and reasonable ED50 levels in 2012 when the herbicide had reduced phytotoxicity, as ED50 levels were much higher at lower seeding rates. Thus higher seeding rates may be a strategy to ensure adequate weed control levels are attained even with marginally efficacious herbicides.
Based on the lentil yields in the study, as effected by herbicide dose and seed rate interaction, the greatest economic return was achieved when lentils were seeded at the 140 plants m−2 targeted rate and fluthiacet-methyl herbicide was applied at 7.5 g ha−1 in 2012 and 3.75 g ha−1 in 2013 (Supplementary Material). In 2012, returns with the recommended seeding rate dropped dramatically when application rates were lower than 3.75 g ha−1. At herbicide rates of 1.87 and 0.94 g ha−1, returns were greatest when lentils were seeded at a targeted rate of 280 plants m−2 in 2012. In 2013 the 140 plants m−2 targeted rate maximized returns even at 0.94 and 1.87 g ha−1 (Supplementary Material). This indicates that if herbicide efficacy is compromised, enhancing weed control with increased seeding rate can be a useful tactic to maintain profits.
These results show that by integrating the cultural practice of increasing seeding rate, producers can help ensure weeds are managed more effectively and can expand the usefulness of herbicide chemistries. This approach of optimizing the dose response of an herbicide by increasing the crop’s competitive ability is particularly important in the development of a successful integrated weed management strategy (Kim et al. Reference Kim, Marshall, Caseley and Brain2006). With growing interest in reducing herbicide inputs, these approaches may aid in decision making for integrating reduced herbicide dose with other cultural practices without any weed control failure.
In conclusion, increases in seeding rate increased herbicide efficacy. The differences in the 2 yr of data demonstrate an increased herbicide efficacy trend, even under varying environmental conditions. This suggests that even under unpredictable conditions, increasing seeding rate can be a useful tactic to help mitigate this risk. This dose–response study shows that the cultural practice of increasing seeding rate can interact with herbicide application to both reduce the upper asymptote of weed biomass and, in one of two years, to reduce the amount of herbicide necessary to achieve 50% weed biomass reduction. These shifts in the dose–response curves led to better weed control at higher seeding rates. In addition, increased seeding rates resulted in higher and more stable seed yields across a wider range of herbicide dosages. Indeed, if seeding rate were considered to be another herbicide input, one would term the response synergistic. Finally, these results suggest that dose–response models can be used to evaluate the efficacy of other cultural practices that can interact with herbicide performance.
Acknowledgments
The authors would like to acknowledge the Agriculture Development Fund, the Natural Sciences and Engineering Research Council, Saskatchewan Pulse Growers, the Western Grains Research Foundation, and the University of Saskatchewan for providing funding for this project. We gratefully acknowledge the technical assistance of Shaun Campbell, Gerry Stuber at Kernen Research Farm, and Tristan Coelho at Scott Research Farm, Saskatchewan.
Supplementary Material
For supplementary material/s referred to in this article, please visit https://doi.org/10.1017/wsc.2017.9