

The premise of this paper is simple: America is changing, and that has important implications for political behavior. The United States is experiencing a significant demographic transformation characterized by a marked increase in the non-White population. According to recent Census data, nearly every county in the United States has become more diverse over the past decade, with more than a third of the population now living in counties where people of color are the majority (Frey Reference Frey2020; Melotte Reference Melotte2022). This shift is not only occurring in urban centers of the country but also in traditionally White rural counties, reflecting a broader national trend of increasing racial and ethnic diversity.
These demographic changes have far-reaching social, economic, and political consequences. As non-White populations grow, their contributions to the labor force, economy, and cultural landscape become increasingly significant. This diversification influences voting patterns, party strategies, and policy priorities, necessitating that elected officials adapt their platforms to address the needs and concerns of these emerging demographic groups (Frey Reference Frey2020). The changing demographic landscape can also lead to varying political and social attitudes across different regions, further impacting national and local political dynamics.
One event that highlights the potential impact of these demographic changes on political attitudes is the January 6, 2021 attack on the U.S. Capitol. How individuals interpret this event—whether as a protest or an insurrection—can be influenced by the demographic context of their communities. As counties experience rapid demographic shifts, feelings of political disenfranchisement and perceived threats to cultural and social dominance can shape how such political actions are perceived. These interpretations are crucial for understanding the broader implications of demographic changes on political stability and social cohesion (Gest Reference Gest2022).
Using the latest release of the 2020 Collaborative Multiracial Post-Election Survey (CMPS), we examine the relationship between demographic change in U.S. counties and respondents’ attitudes toward the January 6th event. After controlling for a variety of relevant factors, our key findings reveal a curvilinear relationship between county non-White population change and whether respondents refer to the January 6th attack as a protest or an insurrection. Specifically, we find that in counties with moderate increases in non-White population, respondents are more likely to refer to the event as an insurrection. By contrast, in counties experiencing either more dramatic shifts in population (high increases or high decreases in non-White populations), respondents are more likely to label the event as a protest. This suggests that Americans who experience significant demographic changes in racial composition feel a heightened perception of instability and racial threat. Importantly, this result holds regardless of the race of the respondent. This is an important finding that illustrates the broader influence of demographic shifts on political perceptions, as the political consequences associated with growing diversity are not limited only to White Americans. Furthermore, our results are largely driven by respondents who did not vote for President Donald Trump in 2020, suggesting that non-Trump voters are especially sensitive to demographic changes when interpreting politically charged events. Overall, our findings show the role of demographic change in shaping political perceptions of major events and provide insights into how voters responded to political messaging about President Trump’s connection to January 6th—an issue that shaped the 2024 presidential election.
Demographic Change
The demographic landscape of the United States is undergoing significant transformation, characterized by a marked increase in the non-White population. This shift is reshaping communities nationwide, including traditionally White rural regions, and has important implications for the country’s social, economic, and political dynamics. According to the 2020 Census, the United States recorded its first decline in the White population. Nearly every county in the United States has become more diverse over the past decade. Census data reveals that more than a third of the U.S. population now lives in counties where people of color are the majority. This diversification is driven by substantial growth in Hispanic, Black, and Asian populations, each contributing significantly to the changing demographic landscape (Frey Reference Frey2018; Reference Frey2020; Lu, Smart, and Gamio Reference Lu, Smart and Gamio2021).
The demographic transformation in the United States is not limited to urban areas but extends into rural America, a region historically known for its predominantly White population. Recent Census data reveals a shift towards greater racial and ethnic diversity in these areas, mirroring the broader national trends. From 2010 to 2020, the non-White rural adult population increased from 17.5% to 20.8%, a significant change. This increase is primarily driven by both domestic and international migration, highlighting the role of mobility in shaping these demographic shifts. Rural counties close to metropolitan areas have witnessed notable demographic changes, with significant gains in their non-White populations (Lu, Smart, and Gamio Reference Lu, Smart and Gamio2021).
Some of the most dramatic demographic shifts have occurred in areas of the country that are historically predominantly White. Figure 1 depicts the percent change in the non-White populations by county across the United States, as per the latest Census data. Areas shaded in lighter colors indicate smaller changes, while those in darker shades signify more substantial increases in non-White populations. The map highlights significant demographic shifts in traditionally White regions, particularly in parts of the Intermountain West, Texas, and the southeastern United States. These areas have seen substantial increases in their non-White populations, reflecting broader national trends of increased diversity that are transforming the demographic landscape across both urban and rural regions. Furthermore, major metropolitan areas like Dallas-Fort Worth, Orlando, Atlanta, Sacramento, New Orleans, and Austin have experienced significant demographic changes, with White residents becoming a minority in these regions. This shift is accompanied by the dispersal of minority populations to new areas, contributing to reconfiguring traditional racial and ethnic landscapes across the United States (Frey Reference Frey2018; Reference Frey2020; Melotte Reference Melotte2022).
% Change in Non-White Population by County (2010–2020).

Looking ahead, the United States is on a trajectory to become a “majority-minority” nation, a significant demographic milestone projected to occur by 2045 (Gest Reference Gest2022). This projection suggests that White residents will constitute less than half of the U.S. population. This impending shift highlights the rapid pace at which the country is diversifying, a trend that is reshaping the population dynamics and influencing social and political structures. As non-White populations grow, their contributions to the labor force, economy, and cultural landscape will become increasingly significant, marking a new era in the country’s demographic landscape (Frey Reference Frey2018; Reference Frey2020).
The demographic changes bring significant socioeconomic implications, particularly in how communities adapt to and integrate these growing populations. For instance, historically Black neighborhoods in cities like Atlanta and New Orleans have seen an influx of White residents due to gentrification. Meanwhile, the White population in these areas has declined, creating communities adjusting to these demographic shifts that challenge traditional racial and ethnic boundaries (Melotte Reference Melotte2022). The premise of this paper is that these changes matter to political behavior. For instance, as non-White populations increase in traditionally White regions, the political landscape becomes more diverse, necessitating that political parties, candidates, and office holders adapt their platforms to address the needs and concerns of these emerging demographic groups. This shift can influence election outcomes, alter the balance of power in legislative bodies, and reshape national and local political contexts.
Consequences of Demographic Change
The consequences of demographic change in the United States, particularly the shift toward a majority-minority population, have garnered significant interest (Craig, Rucker, and Richeson Reference Craig, Rucker and Richeson2018). Research generally focuses on the psychological, social, and political implications, exploring how these changes influence racial attitudes, intergroup relations, and political behavior. The salience of the majority-minority shift has significant implications for intergroup relations. Research on perceived threats from increasing racial diversity highlights the potential of demographic change to promote intergroup hostility (Blalock Reference Blalock1967; Blumer Reference Blumer1958). The Racial Threat Hypothesis provides a framework for understanding these reactions. It suggests that proximity to large or growing minority populations can increase hostility toward these groups which, in turn, can influence political behavior (Enos Reference Enos2017; Key Reference Key1949).
Not surprisingly, most literature examines the impact of these shifts on Whites, the traditional majority (Craig, Rucker, and Richeson Reference Craig, Rucker and Richeson2018). Many White Americans perceive the impending majority-minority shift as a threat to their dominant status, resulting in heightened concerns about declining societal standing compared to racial minorities (Craig and Richeson Reference Craig and Richeson2014a; Reference Craig and Richeson2014b; Reference Craig and Richeson2017; Danbold and Huo Reference Danbold and Huo2015; Outten et al. Reference Outten2012). Exposure to demographic changes can lead to increased anxiety and negative affect among White Americans (Burrow et al. Reference Burrow, Garcia and Hudson2014; Myers and Levy Reference Myers and Levy2018), including a sense of threat regarding their historical dominance in social and political spheres (Jardina Reference Jardina2019; Major, Blodorn and Blascovich Reference Major, Blodorn and Blascovich2018; Mutz Reference Mutz2018; Schildkraut Reference Schildkraut2007). As Barreto et al. (Reference Barreto2023) discuss, this can cause some Whites to react defensively to increasing diversity by attempting to reinforce their status as the prototypical racial group in America (Bai and Federico Reference Bai and Federico2020; Danbold and Huo Reference Danbold and Huo2015; Jardina Reference Jardina2019; Schildkraut Reference Schildkraut2010). This defensive reaction is sometimes expressed through resentment and opposition to immigration, as Whites may view growing non-White populations as a challenge to their societal dominance (Abrajano and Hajnal Reference Abrajano and Hajnal2015; Ramirez and Peterson Reference Ramirez and Peterson2020). They may also adopt more conservative views on a range of social policy issues (Major et al. Reference Major2016; Willer et al. Reference Willer, Voelkel and Levine2016), which often translate into increased support for conservative parties, candidates, and political events, such as the Tea Party, Donald Trump, and the insurrection (Abramowitz and McCoy Reference Abramowitz and McCoy2019; Barreto et al. Reference Barreto2023; Craig and Richeson Reference Craig and Richeson2017), as well as other specific policy preferences, both related and unrelated to race (Craig and Richeson Reference Craig and Richeson2014b; Reference Craig and Richeson2017; Myers and Levy Reference Myers and Levy2018; Tesler Reference Tesler2012).
Increasing racial diversity thus has far-reaching implications for political and social dynamics. Indeed, this sense of threat and its consequences are not unique to White Americans. Non-White communities may also experience anxiety and have similar behavior changes in response to demographic changes, particularly when these changes threaten their social or economic status. Craig and Richeson (Reference Craig and Richeson2018) show that non-Hispanic minorities may react to the growth of the Hispanic population with increased concerns about their group’s status and political power leading to greater conservatism. On the other hand, Levy and Myers (Reference Levy and Myers2021) find that non-White Americans generally respond positively to narratives about increasing diversity, regardless of framing. Furthermore, Maggio (Reference Maggio2021) finds that Blacks and Latinos living in counties undergoing rapid growth of Black and Hispanic populations, respectively, have higher perceptions of “racial problems.” There is also research that finds that Republicans of all racial groups become more conservative on immigration policy when they live in counties that have experienced diversification (Hawley Reference Hawley2011). This indicates that demographic shifts can trigger group threats across different racial groups, leading to defensive political behaviors aimed at protecting perceived group status, indicating that perceived threats from demographic shifts are a broader phenomenon (Hawley Reference Hawley2011; Maggio Reference Maggio2021).
As America grows more diverse, addressing identity and status concerns among dominant groups will be crucial for social cohesion and democratic stability (Knowles and Marshburn Reference Knowles and Marshburn2010; Sides, Tesler, and Vavreck Reference Sides, Tesler and Vavreck2017). Furthermore, more research is needed on how demographic changes affect interpretations of national political phenomena. For instance, areas experiencing significant demographic changes may develop differing narratives about the legitimacy and nature of political violence. Examining these effects is essential for understanding representation and the health of U.S. democracy.
Hypotheses
This paper explores the relationship between demographic shifts in the U.S. and the differing perceptions of the January 6th attack on the U.S. Capitol. Our logic is grounded in previous research that demographic changes lead to feelings of political disenfranchisement, shaping how individuals perceive the legitimacy and nature of political actions. At its core is the work of scholars interested in testing the racial threat hypothesis, which suggests that population changes can motivate a perceived threat to the dominant population’s cultural norms and political and economic well-being (Blumer Reference Blumer1958; Blalock Reference Blalock1967; Bobo and Hutchings Reference Bobo and Hutchings1996). Many scholars have explored the relationship between social contexts and racial attitudes. For example, as discussed above, some studies find that a large presence of non-White populations corresponds with greater White racial animosity (see also Fossett and Kiecolt Reference Fossett and Kiecolt1989; Giles and Buckner Reference Giles and Buckner1993; Glaser Reference Glaser1994; Quillian Reference Quillian1996; Taylor Reference Taylor1998).
The concept of political threat plays a crucial role in shaping attitudes toward significant political events. As the demographic composition of counties shifts, the political landscape transforms, often threatening the political power of established groups. This transformation can evoke political disenfranchisement among various populations, not just the traditional majority. Gest (Reference Gest2022) argues that demographic changes can lead to feelings of political disenfranchisement, prompting individuals to question the legitimacy of the existing political system. Shifts in demographics and a threat of lost political power have been found to have very powerful influences on political behavior, including advancing the Tea Party social movement (Parker and Barreto Reference Parker and Barreto2014). Most recently, Schaller and Waldman (Reference Schaller and Waldman2024) find that a sense of political disenfranchisement and lack of substantive representation among White Americans who live in rural counties can lead to dangerous consequences, including acceptance of political violence. This sense of disenfranchisement can manifest in a reinterpretation of actions taken against the state, such as the January 6th attack, with interpretations varying based on feelings of marginalization and threat.
Although Barreto et al. (Reference Barreto2023) did not include non-Whites in their analysis, we believe that their underlying theory that Trump’s inflammatory and inaccurate campaign messaging about undocumented immigrants voting and 2020 being a stolen election could apply to all Americans, not just whites. After all, the 2020 CMPS that we leverage for this analysis reveals that racial and ethnic minorities are highly susceptible to misinformation regarding voter fraud, as 38% of Latinos and 30% of African Americans think there might have been at least some fraud in 2020. It is similarly plausible that there are non-White Americans who are anxious about a country they may feel is changing too quickly demographically and culturally as described in the Barreto et al. (Reference Barreto2023) theory.
For instance, as non-White populations increase in a county, individuals—regardless of their racial background—might feel a collective sense of political disenfranchisement and competition with newly arrived residents from diverse backgrounds. Scholars have found evidence that not only do many racial and ethnic minorities see each other as a source of political competition (Bobo and Hutchings Reference Bobo and Hutchings1996; Oliver and Wong Reference Oliver and Wong2003), but that increased diversity heightens “competitive anxiety” with both in and out-group members (Gonzalez, Barreto, and Sanchez Reference Gonzalez O’Brien, Barreto and Sanchez2019).
Social science research also suggests that some racial minorities may harbor negative stereotypes about growing diversity driven by newly arrived immigrants (McClain Reference McClain2007), and may wish to distinguish themselves from immigrants of their own racial group who they may feel devalue their group’s standing in society (Hickel et al. Reference Hickel, Oskooii and Collingwood2024; Waters et al. Reference Waters, Kasinitz and Asad2014). Hickel et al. (Reference Hickel, Oskooii and Collingwood2024) use the term “Latino Immigration Resentment” to explain how this process manifests itself among the Latino community. An increase in diversity can cue this sense of resentment and disenfranchisement among both White and non-White Americans experiencing dramatic shifts in racial demographics.
This shared sense of threat can lead to viewing the Capitol attack as a “protest,” reflecting a belief that the attack was a misguided but legitimate expression of political dissent against perceived illegitimate governance. This perspective aligns with historical experiences of political movements, where protest is seen as a means to address grievances within the political system. Conversely, in counties experiencing less demographic change, individuals may feel less politically marginalized and more secure in their political influence. Consequently, they might interpret the January 6th attack as an “insurrection,” emphasizing its unlawfulness and danger to democratic institutions.
There is a strong possibility that the relationship between the diversification of an individual’s county and insurrection attitudes is not linear in nature. In fact, research exploring the relationship between demographic change and racial attitudes has found that the relationship does not fit a linear distribution. For example, Barreto et al. (Reference Barreto, Gonzalez, Sanchez, Pulido and Kun2010) find that Latino perceptions of competition with Blacks increase in a linear pattern as the percentage of Blacks in their county reaches roughly 30%. However, after this “tipping point” perceptions of competition with Blacks decrease, resulting in a curve–linear relationship. This finding is consistent with several other papers that find a curvilinear pattern between the size of a racial or ethnic minority and its impact on a host of policy or attitudinal outcomes (see Branton and Jones Reference Branton and Jones1999; Johnson Reference Johnson2001). This non-linear pattern is also relevant in research exploring the impact of diversity within congressional districts on the behavior of members of Congress, as Latino population growth has a differential impact on the voting behavior of Republican members of Congress. Republican MC’s roll-call behavior becomes more conservative until the district’s Latino population reaches the 37% “tipping point” where they begin to incorporate Latino interests and reduce their extreme conservative fervor (Sanchez Reference Sanchez2024).
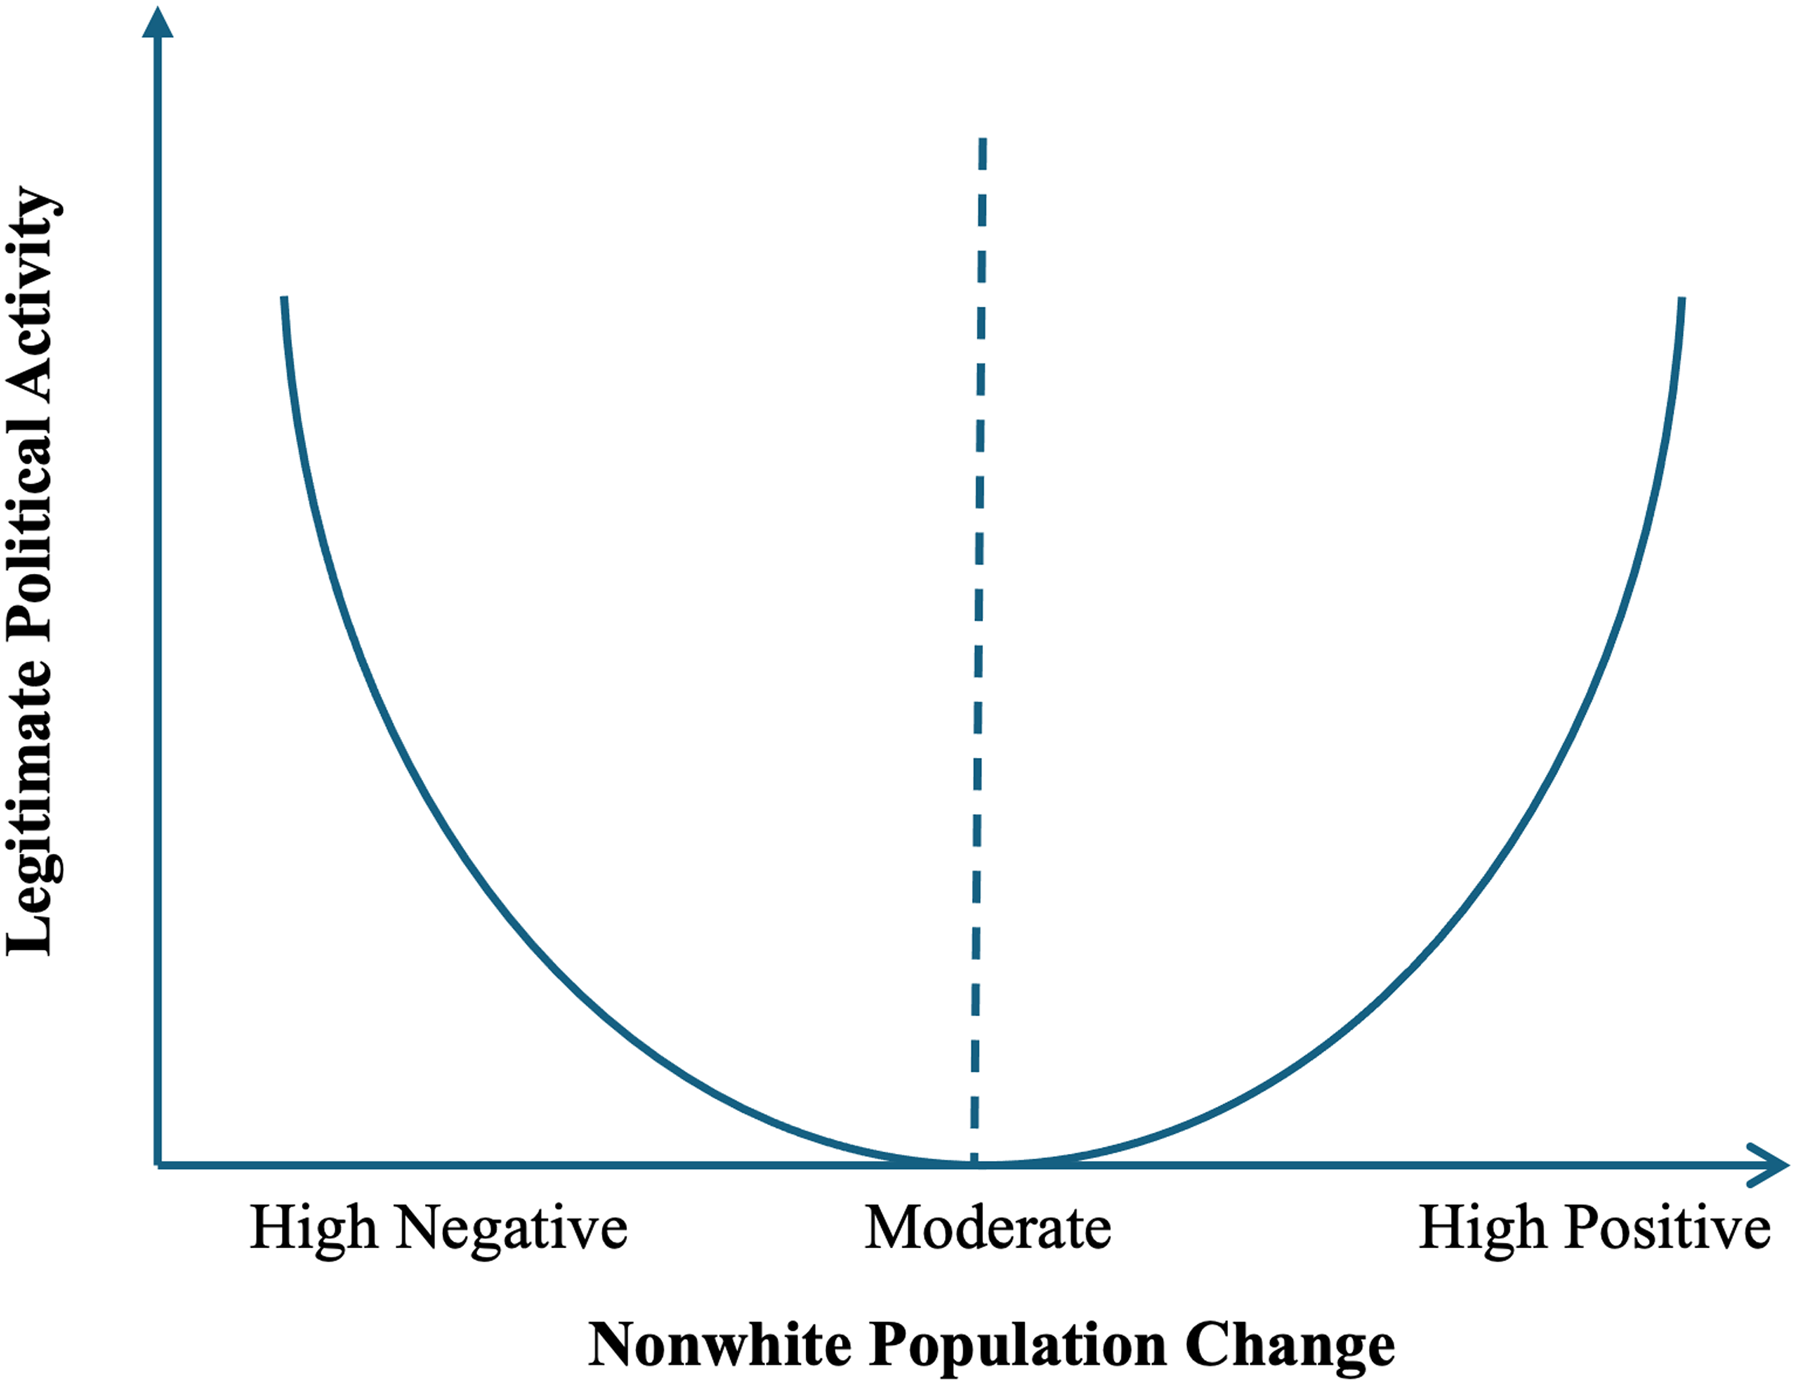
Consistent with findings of a curvilinear relationship between demographic change and political behavior, we expect changes in the non-White population to influence political attitudes regarding January 6th through the lens of racial threat theory. The hypothetical relationship is depicted in Figure 2. At high negative levels of non-White population change, respondents may experience heightened perceptions of instability and uncertainty, as such shifts disrupt established community structures and social networks. This may evoke anxiety and perceptions of threat, leading respondents to view January 6th as a protest that reflects broader concerns about social and economic instability. Similarly, at high positive levels of non-White population change, respondents may experience perceptions of racial threat as rapid demographic growth challenges existing social hierarchies and heightens competition for political and social dominance. In this context, January 6th may be framed as a protest legitimizing actions to reinforce in-group status and resist perceived challenges to the dominant group’s position.
Hypothetical Relationship Between Non-White Population Change and Attitudes on January 6th. Note: the y-axis depicts the probability of calling January 6th a legitimate political activity (or, more specifically, a “protest”).

By contrast, at slow to moderate levels of non-White population change, demographic shifts may not be dramatic enough to activate strong perceptions of threat or instability. These gradual changes allow communities to adapt more easily to evolving demographics, leading to a decline in the likelihood of interpreting January 6th as a protest. Taken together, this curvilinear relationship highlights how both high negative and high positive demographic changes can amplify perceptions of threat, whereas moderate changes dampen their salience.Footnote 1
Thus, we expect the following:
Legitimizing Hypothesis: The likelihood an individual views the January 6th attack on the Capitol as a “protest” rather than an “insurrection” increases as the percent of non-White population in their county increases, holding all else constant.
Curvilinear Hypothesis: Changes in the non-White population will have a curvilinear effect on the likelihood an individual views the January 6th attack on the Capitol as a “protest” rather than an “insurrection,” where negative or no change increases the likelihood of viewing the event as a protest due to identity reinforcement, moderate increases reduce this likelihood due to low salience, and large increases heighten perceptions of racial threat, leading to a renewed likelihood of viewing it as a protest.
Data and Methods
This paper examines the potential influence of population diversification at the county level on Americans’ views and justification of the January 6th attack. We leverage the 2020 Collaborative Multi-Racial Political Survey (CMPS), an ideal set for our study given the large sample size of 2020 voters and the depth of content in the study that included insurrection attitudes (Frasure et al. Reference Frasure2016). The CMPS is a nationwide survey that captures the perspectives of both voters and non-voters on political and social issues in the aftermath of elections, highlighting variations in political attitudes and policies across different racial groups. CMPS is administered by the University of California, Los Angeles (UCLA), and its innovative approach transforms the methodology for collecting high-quality survey data among various racial and ethnic communities in the U.S.
A total of 14,988 completed interviews were collected online in a respondent self-administered format from April 2, 2021 to August 25, 2021. The CMPS is particularly useful for our project given that the initiation date of the survey was determined, in part, in response to national events unfolding in real-time in the aftermath of the 2020 election. This allows the CMPS to capture attitudes and reactions to post-election disturbances in December 2020 and January 2021. Rather than relying on recent surveys that asked Americans to recall their views about the insurrection years later, the CMPS was fielded when this event was still being discussed in the media. The survey (and invitation) was available to respondents in English, Spanish, Chinese (simplified), Chinese (traditional), Korean, Vietnamese, Arabic, Urdu, Farsi, and Haitian Creole. Because of the primary interest in the 2020 election, the project started with a large sample of registered voters from online sources that were pre-matched to the voter file. In addition, the data include a sample of non-registered adults, including non-citizens.
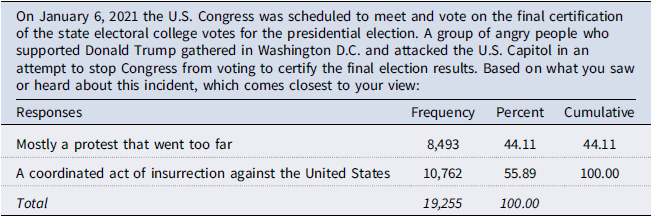
Our dependent variable for the analysis is a measure within the CMPS focused on reactions to the insurrection that asked respondents if they felt this was a “protest that went too far” (coded as 0), or a “coordinated act of insurrection against the United States” (coded as 1). This is an ideal measure to test our theory, which was captured close enough to the event while the national media constantly discussed the event in their coverage and has been used in previous research on the topic as well (Barreto et al. Reference Barreto2023). As reflected in Table 1, there is significant variation across the sample on this measure, with 56% of respondents reporting that they felt it was a coordinated act of insurrection. This provides an ideal context for our analysis.
Dependent variable, CMPS Q53

The CMPS provides the county of residence for all respondents in our sample, which was used to merge population data derived from the U.S. Census. Given our interest in population change, we use each county’s percent increase or decrease over the last decade. More specifically, our measure is a continuous percent change in the non-White population of each county between 2010 and 2020. We treat the Latino/Hispanic population as non-White in our coding scheme. Figure 3 depicts these percent changes across U.S. countries, but only for counties included in the CMPS data. The key takeaway is that the CMPS data contain healthy variation in the county-level data, with population change ranging from a low of about—40% to a high of over 400%. We employ a quadratic equation to this measure, allowing the measure to take on a curve-linear pattern if the relationship does not follow a linear pattern to test our hypothesis regarding the nature of the relationship.
% Change in Non-White Population by Counties in CMPS (2010–2020).

There are a number of geographic identifiers that we could employ to capture population change. We rely on the county for two principal reasons. First, as reflected in the discussion of population change in the paper’s introduction, the US Census relies extensively on county when displaying population changes.Footnote 2 Consequently, much of the applied policy research that discusses population changes over time relies on county-level data and examples in their narratives (e.g. Frey Reference Frey2020). Second, county-level data has been instrumental in American politics research, enabling the analysis of geographic patterns in voting behavior, including variations in party affiliation, candidate support, and voter turnout.
The focus on county-level data is particularly prominent with research focused on racial threat theory, the primary theory driving our research design (Barreto, Gonzalez, and Sanchez Reference Barreto, Gonzalez, Sanchez, Pulido and Kun2010; Campbell, Wong, and Oliver Reference Campbell, Wong and Citrin2006; Hopkins Reference Hopkins2010). County is also the geographical unit used in research exploring how race and ethnicity correlate with political preferences (Maggio Reference Maggio2021; Mayda et al. Reference Mayda, Peri and Steingress2018), the nationalization of elections (Amlani and Algara Reference Amlani and Algara2021), economic accountability across levels of government (de Benedictis-Kessner and Warshaw Reference de Benedictis-Kessner and Warshaw2020), the relationship between demographic change and partisan competition (Aistrup Reference Aistrup2004), and local COVID-19 lockdown policies (Goolsbee and Syverson Reference Goolsbee and Syverson2021).Footnote 3
One of the challenges facing our research design is the ability to isolate the impact of population shifts on insurrection attitudes. For example, there is a high likelihood that attitudes toward the January 6th event are correlated with perceptions that the 2020 Presidential election was stolen. We, therefore, control for several relevant variables. These variables can be grouped into demographic, ideology/party, and political attitudes categories. We include race/ethnicity, whether the respondent voted for President Trump in 2020, self-identified political ideology, and party affiliation. The rationale for separating Trump and non-Trump voters is rooted in our expectation that partisanship and ideological alignment moderate how individuals perceive and respond to demographic change.
We also include perceived threats by non-White communities to the respondent’s vision of American society and belief in election fraud. Additionally, we control the log of the 2020 county population to account for any urban/rural differences. For more details on the individual measures, please see the Appendix.Footnote 4
Results
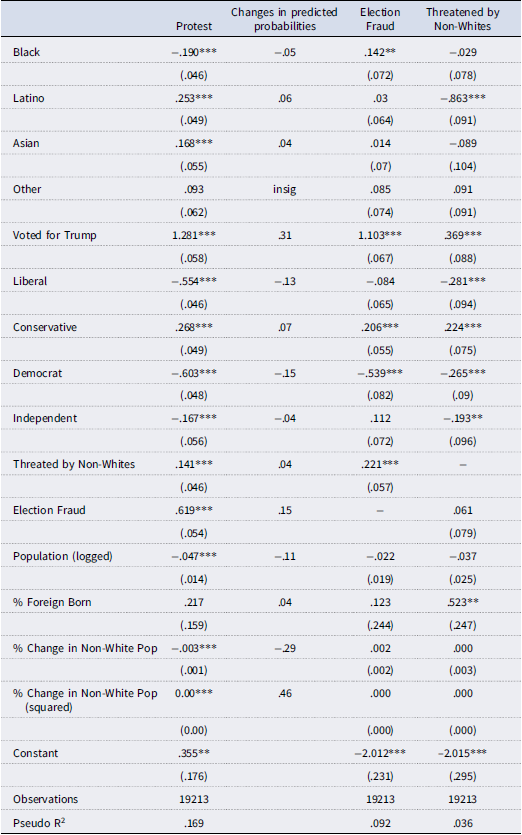
We begin with our main model of interest, labeled “Protest” in Table 2. It reveals a curvilinear relationship between the change in the non-White population and respondents’ characterizations of the January 6th attack. Specifically, we find that in counties with relatively low or negative increases in the non-White population, respondents are more likely to refer to the event as an insurrection. Percent Change in Non-White Pop is statistically significant (p < .01) and negative. Changes in the predicted probabilities for the main model are shown in the second column of Table 2. Moving from the lowest value of percent change (–42.47%) to the highest (416.63%) decreases the probability of calling January 6th a “protest” versus an “insurrection” by 29%. Conversely, in counties with very high increases in non-White populations, respondents are more likely to label it as a “protest.” Percent Change in Non-White Pop Squared is statistically significant (p < .01) and positive. Specifically, moving from its lowest to highest values increases the probability of calling the event a “protest” by 46%.
Explaining January 6th as a protest

Note: Standard errors are in parentheses; *** p<.01, ** p<.05, * p<.1 Changes in predicted probabilities for all variables, calculated from their minimum to maximum values.
This finding indicates a non-linear relationship where both high negative and high positive changes in the non-White population are associated with a greater likelihood of labeling the event as a protest, while moderate changes dampen this likelihood. This relationship is depicted in Figure 4, which plots predicted probabilities against non-White population change. The figure shows that at high negative levels of change, the probability of calling the event a protest is elevated, likely reflecting heightened perceptions of instability and uncertainty caused by significant demographic disruptions. As the percentage change approaches zero, this likelihood declines, as moderate or minimal changes in the non-White population fail to activate perceptions of threat or instability. However, as non-White population growth increases beyond moderate levels, such as 100% (a doubling), the probability of labeling the event as a protest remains negative but begins to increase. By around 200% (a tripling), the effect becomes positive again, reflecting heightened perceptions of racial threat as rapid demographic growth challenges social hierarchies and intensifies competition. The effect becomes most pronounced at these very high levels of change, consistent with racial threat theory, where rapid demographic shifts amplify perceptions of instability and social threat, leading respondents to legitimize January 6th as a protest. While we did not have a priori beliefs about the specific tipping points, the empirical results demonstrate a clear U-shaped relationship between demographic change and political perceptions, supporting our second hypothesis.
Probability of Calling Jan 6th a “Protest” by % Change in Non-White Population.

Several control variables in the model provide important insights into perceptions of January 6th. As shown in Table 2, racial and ethnic identity significantly shape these views: Black respondents are less likely to view the event as a protest, while Latino and Asian respondents are more likely to do so. Vote choice, party affiliation, and ideology also play key roles, with Trump voters and conservatives more likely to see the event as a protest, whereas liberals are less likely. Similarly, Democrats and independents are less inclined to interpret the event as a protest compared to other groups. County-level controls further highlight contextual influences. The total population (logged) is significant (p < .01) and negatively associated with viewing the event as a protest, suggesting that respondents in less populated counties are more likely to hold this view. Additionally, the proportion of foreign-born residents is significant at the 0.1 level and positively associated with the likelihood of calling the event a protest, indicating that areas with higher foreign-born populations may influence respondents’ perceptions in this direction.
Our additional models in Table 2 examine whether respondents feel threatened by non-Whites or believe there was fraud in the 2020 election. The results indicate that demographic change does not significantly impact these attitudes. This suggests that the relationship between demographic change and attitudes towards the January 6th attack is direct and does not filter through these other attitudinal dimensions about the 2020 election and racial threats. Furthermore, these models demonstrate that the observed effect is real and not random, reinforcing the validity of our main findings.
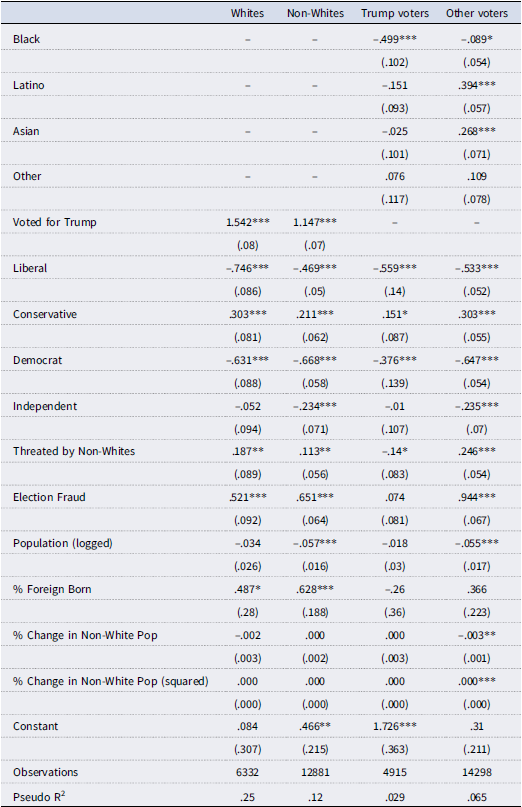
Table 3 extends the analysis by examining whether the curvilinear relationship between demographic change and attitudes toward January 6th differs between White and non-White respondents. The results suggest it does not. The population change variables are not statistically significant at the .05 level for either group, indicating that the relationship between demographic change and perceptions of the January 6th attack is consistent across racial lines. One possible exception is the squared term for percent change in non-White population in the non-White model, which is significant at the 0.1 level and positive. However, given its marginal significance, we are hesitant to draw strong conclusions from this finding. Overall, the lack of statistical significance in these models suggests that the influence of demographic change on whether respondents label the event as a protest or an insurrection does not depend on the racial composition of the respondents themselves. Instead, it highlights the broader impact of demographic shifts on political perceptions, affecting individuals similarly regardless of their race.
Explaining January 6th as a Protest, By Race and Trump Vote

Note: Standard errors are in parentheses; *** p<.01, ** p<.05, * p<.1.
However, it is very interesting that this is not the case for the other two models in Table 3, which separate Trump and non-Trump voters. The rationale for separating Trump and non-Trump voters is rooted in the expectation that partisanship and ideological alignment moderate how individuals perceive and respond to demographic change. Trump voters, as a cohesive group ideologically aligned with Trump’s messaging, are likely to interpret January 6th through the lens of their strong partisan loyalty, which may override the influence of local demographic context. This alignment may make them less sensitive to shifts in their counties’ racial composition, as their perceptions are shaped more directly by national political narratives and their support for Trump.
Non-Trump voters, on the other hand, represent a more ideologically diverse group and are less anchored by a singular political identity.Footnote 5 This diversity makes them more likely to respond to contextual cues, such as demographic changes in their local environment. In counties with greater non-White population growth, these shifts may heighten their awareness of social and political changes, leading to interpretations of January 6th that reflect their sensitivity to these demographic transitions. For instance, the framing of January 6th as a protest may reflect an effort to legitimize or understand the grievances associated with such shifts, even if they do not align politically with Trump.
By separating these groups, we can better understand how the interaction between partisan identity and local demographic change shapes political perceptions. This approach reveals a critical distinction: while Trump voters exhibit relative uniformity in their attitudes, non-Trump voters show greater variation that is influenced by local context. Table 3 shows the curvilinear relationship exists for non-Trump voters but not for Trump voters. This difference suggests that demographic change influences the political perceptions of non-Trump voters more significantly, potentially making them more sensitive to shifts in the racial composition of their counties. On the other hand, Trump voters’ attitudes appear less affected by these demographic changes, likely due to their strong ideological alignment and support for Trump, which could overshadow the effects of local demographic dynamics. This relationship is depicted in Figure 5, which plots predicted probabilities by percent change in non-White population. It is worth noting that while the shape looks similar to Figure 4 above, the tipping point is below the previously noted 100% increase. For non-Trump voters, the point at which population change triggers an increased probability of referring to January 6th as a “protest” occurs between 70% and 80% change in the non-White population.
Probability of Calling Jan 6th a “Protest” by % Change in Non-White Population, Non-Trump Voters.

Finally, the variable indicating whether a respondent voted for Trump appears to be the most influential variable in the model. This variable consistently shows a strong positive association with labeling the January 6th event as a protest, highlighting the significant impact of political allegiance on perceptions of the event. Trump voters are markedly more likely to view the attack as a protest, reinforcing the role of partisan identity in shaping interpretations of political events. This finding emphasizes the strong influence of political affiliation on how individuals interpret and react to pivotal national events such as the January 6th attack on the U.S. Capitol.
Conclusion
America is rapidly changing, and that has important implications for political behavior. According to recent Census data, nearly every county in the United States has become more diverse over the past decade, with more than a third of the population now living in counties where people of color are the majority (Frey Reference Frey2020; Melotte Reference Melotte2022). This shift is not only occurring in urban centers but also in traditionally White rural regions, reflecting a broader national trend of increasing racial and ethnic diversity. One event that highlights the potential impact of these demographic changes on political attitudes is the January 6th attack on the U.S. Capitol. How individuals interpret this event—whether as a protest or an insurrection—can be influenced by the demographic context of their communities. As counties experience rapid demographic shifts, feelings of political disenfranchisement and perceived threats to cultural and social dominance can shape how such political actions are perceived. These interpretations are crucial for understanding the broader implications of demographic changes on political stability and social cohesion (Gest Reference Gest2022).
This paper shows that demographic change across the United States has significant implications for political behavior and perceptions regarding major political events, particularly concerning the January 6th attack on the U.S. Capitol. Using the 2020 Collaborative Multiracial Post-Election Survey, we examined the relationship between demographic change in U.S. counties and respondents’ attitudes regarding the January 6th event. After controlling for a variety of relevant factors, our key findings reveal a curvilinear relationship between county non-White population change and whether respondents refer to the January 6th attack as a protest or an insurrection. Specifically, we find that in counties with moderate increases in the non-White population, respondents are more likely to refer to the event as an insurrection. By contrast, in counties experiencing either high increases or high decreases in non-White populations, respondents are more likely to label the event as a protest, reflecting heightened perceptions of instability and racial threat.
One of the main findings from our analysis is that this result holds even when controlling for the race of the respondent, underscoring the broader influence of demographic shifts on political perceptions. It is well established that increased diversity influences the political attitudes and behavior of White Americans (Parker and Barreto Reference Parker and Barreto2014; Schaller and Waldman Reference Schaller and Waldman2024). We build on this work with our findings that dramatic changes in racial diversity also influence the political attitudes of all Americans experiencing dramatic demographic shifts.
Overall, our findings illustrate the role of demographic change in shaping political perceptions and provide insight into some key themes that almost certainly shaped the 2024 presidential election. Our analysis reveals that population change does not predict attitudes about feeling threatened by non-Whites or belief in 2020 election fraud. Furthermore, our results are driven mostly by respondents who did not vote for President Donald Trump in 2020. This suggests that the relationship between demographic change and attitudes toward January 6th is direct, rather than mediated through these beliefs. This finding does not contradict prior research, such as Barreto et al. (Reference Barreto2023), which highlights the role of negative attitudes toward immigrants and White replacement theory in shaping support for the insurrection. Instead, it illustrates an alternative possible mechanism: demographic change operates as a contextual cue that influences political perceptions by altering the social environment, even when individuals do not explicitly express feelings of racial threat or related beliefs. Visible shifts in racial composition may evoke subconscious group dynamics or perceptions of social change, influencing interpretations of events like January 6th without being directly tied to overt racial attitudes.
In other words, it is possible that the direct effect of demographic change on attitudes toward January 6th reflects implicit biases rather than explicitly expressed racial threats. Respondents may experience social desirability pressures that discourage overtly racist or discriminatory responses when asked about feelings of threat or attitudes toward other racial groups. However, these biases could manifest indirectly when interpreting a politically charged event like January 6th. Supporting the “protest” framing of the event may serve as an outlet for expressing underlying concerns about demographic shifts without directly articulating racially charged sentiments. This interpretation strengthens our racial threat hypothesis by suggesting that demographic change influences political attitudes in ways that are not always captured through explicit measures of racial threat but may be revealed in responses to other political stimuli, such as January 6th.
Moreover, the lack of a significant difference between White and non-White respondents in this relationship indicates that the impact of demographic changes on political perceptions is not confined to any single racial group. However, the distinct responses between Trump and non-Trump voters illustrate the powerful role of political allegiance in shaping interpretations of the January 6th attack, with Trump voters consistently viewing the event as a protest due to their strong ideological alignment and support for Trump. Our findings reveal that non-Trump voters in areas with significant demographic changes were more likely to view the events as a protest. This may be partially explained by the resonance of Trump’s messages in these areas, which framed demographic change and political grievances in ways that appealed not only to his supporters but also to segments of the population who might not align with him politically. These voters may have viewed the protest framing as a way to legitimize grievances tied to demographic and social transformation.
Our findings are strikingly consistent with the outcome of the 2024 presidential election, in which Donald Trump gained significant ground among working-class Democrats and non-Trump voters in counties experiencing substantial demographic change (Bloch et al. Reference Bloch2024; Zitner Reference Zitner2024). Trump’s nationalistic platform and messages about cultural and economic grievances resonated powerfully with these voters, many of whom felt politically disenfranchised by the rapid transformation of their communities. This alignment illustrates the critical role demographic change plays in shaping political perceptions, even among those not traditionally aligned with Trump.
President Joe Biden and, later, Vice President Kamala Harris’ strategy of emphasizing the January 6th attack as a justification for supporting them over Trump fell short with this key voter base. Non-Trump voters in these counties, sensitive to the demographic changes around them, may have viewed Democrats’ democracy-focused messaging as disconnected from their immediate economic and social concerns. These findings suggest that Trump’s ability to channel these anxieties into support for his nationalistic agenda was a decisive factor in his success. Biden and Harris, by contrast, might have strengthened their connection with these voters by addressing their economic and cultural concerns directly, rather than focusing on January 6th. The results of the 2024 election thus provide compelling validation of our theoretical framework and highlight the enduring salience of demographic change in shaping political outcomes.
In closing, these findings illustrate the role of demographics and demographic change in understanding political behavior, especially in terms of political stability and social cohesion. As the United States moves toward becoming a majority–minority nation, it is essential to continue researching the relationship between demographic change and political attitudes in our rapidly diversifying society.
Appendix