Introduction
The Ministry of Agriculture, Animal Industry and Fisheries (MAAIF), and the Uganda Bureau of Statistics (UBOS, 2009) reported the population of indigenous cattle to be 10.64 million, spread throughout the country's agro-ecological zones (AEZs). The key indigenous cattle breeds comprise the Ankole (Bos taurus indicus) and EASZ (Bos indicus), although several variations of these two occur, named in respect of their keepers such as the Nganda, Nyoro, Karamojong and Nkedi breeds (Balikowa, Reference Balikowa2011). The Ankole are present in the western and southwestern (Ndumu et al., Reference Ndumu, Baumung, Hanotte, Wurzinger, Okeyo, Jianlin, Kibogo and Sölkner2008b; Kugonza et al., Reference Kugonza, Nabasirye, Mpairwe, Hanotte and Okeyo2011), while the EASZ cattle are established in the eastern, northeastern, northern and west Nile regions of Uganda (MAAIF/UBOS, 2009; Balikowa, Reference Balikowa2011). Several regions in central Uganda exhibit composite breeds between the Ankole, EASZ and Friesians giving rise to various grades of crossbred cattle such as the Nganda, Nkedi, Serere, Nsoga and Kyoga (Bett et al., Reference Bett, Okeyo, Malmfors, Johansson, Agaba, Kugonza, Bhuiyan, Filho, Mariante, Mujibi and Philipsson2013). They provide livelihoods to 26.1 percent of all households in Uganda through delivery of several goods and amenities as described by Kugonza et al. (Reference Kugonza, Nabasirye, Mpairwe, Hanotte and Okeyo2011); Hanotte, Dessie and Kemp (Reference Hanotte, Dessie and Kemp2010); Food and Agricultural Organisation of the United Nations (FAO, 2009). In addition, they facilitate sustainable utilization of marginal resources where no other type of agricultural investment is possible (Anderson, Reference Anderson2003; FAO, Reference Rischkowsky and Pilling2007). This is because indigenous cattle have become tolerant to endemic infections and have the ability to live on poor quality feed resources (Scarpa et al., Reference Scarpa, Ruto, Krinstjanson, Radeny, Drucker and Rege2003; Taberlet et al., Reference Taberlet, Valentini, Rezaei, Naderi, Pompanon, Negrini and Ajmone-Marsan2008; Rege et al., Reference Rege, Marshall, Notenbaert, Ojango and Okeyo2011). In this report, adaptation is used to refer to anatomical, physiological or behavioural traits that contribute to an individual's ability to survive and reproduce (“fitness”) in an environment which it has evolved (Lamy et al., Reference Lamy, van Harten, Sales-Baptista, Guerra, de Almeida, Sejian, Naqvi, Ezeji, Lakritza and Lal2012).
Local farmers exploit indigenous cattle adaptive traits to selectively breed for agro-ecological fitness and socio-cultural identity (Ndumu et al., Reference Ndumu, Baumung, Wurzinger, Drucker, Okeyo, Semambo and Sölkner2008a; FAO, 2009). Consequently, selective breeding has resulted into the evolution of undefined diverse indigenous cattle morphometric population structures (Ndumu et al., Reference Ndumu, Baumung, Wurzinger, Drucker, Okeyo, Semambo and Sölkner2008a, Reference Ndumu, Baumung, Hanotte, Wurzinger, Okeyo, Jianlin, Kibogo and Sölkner2008b). These morphometric variations signify diversity and constitute appropriate genetic resources for future generations (Hoffmann, Reference Hoffmann2010) which deserve adequate conservation efforts. Present national policies favour the utilization of industrial cattle breeds for higher productivity to meet the increasing population food demands (MAAIF, 2012; Galukande et al., Reference Galukande, Mulindwa, Wurzinger, Roschinsky, Mwai and Sölkner2013). But exotic breeds have inadequate adaptive agro-ecological fitness compared with indigenous cattle (Scarpa et al., Reference Scarpa, Ruto, Krinstjanson, Radeny, Drucker and Rege2003) and therefore require more resource inputs to thrive under the local tropical conditions. Present policies aiming at higher productivity put local cattle genotypes at risk of obliteration (Taberlet et al., Reference Taberlet, Valentini, Rezaei, Naderi, Pompanon, Negrini and Ajmone-Marsan2008; Wilson, Reference Wilson2009). Knowledge of morphometric variation is useful for making inferences about farmers’ roles in the evolution of indigenous livestock morphological diversity, landscape fitness and adaptation (Mwacharo et al., Reference Mwacharo, Okeyo, Kamande and Rege2006; Kugonza et al., Reference Kugonza, Nabasirye, Mpairwe, Hanotte and Okeyo2011). For example, smaller and stout body frames have evolved to enhance long-distance trekking and survival on scarce, less nutritive feed resources (Loquang and Köhler-Rollefson, Reference Loquang and Köhler-Rollefson2005; FAO, Reference Rischkowsky and Pilling2007; Nalule, Reference Nalule2010; Herrero et al., Reference Herrero, Thornton, Notenbaert, Msangi, Wood, Kruska, Dixon, Bossio, van de Steeg, Freeman, Li and Rao2012).
Studies of indigenous cattle morphometric diversity in the different AEZs constitute an initial step in conservation of genetic resources and can be a basis for genetic improvement programmes. Additionally, body morphometric traits and adaptive features are useful for identification of breed qualities relevant to livestock farming community utility needs. The current advocacy for sustainable agricultural systems favours well-evolved local breed types as future candidates for conservation and utilization. Modern technics have now enabled the association of such traits with the genotypes enhancing the application of genetic marker-assisted selection with conservation of adaptive traits (Zhang and Li, Reference Zhang and Li2011). Presently, Uganda's indigenous cattle morphometric population structure is partly described. The main objectives of this study were: (1) to establish nationwide indigenous cattle morphometric structure associated with AEZs and farmers’ selective breeding practices; (2) to provide support to upcoming improvement and conservation schemes; and (3) to provide basic information for genome wide association studies (GWAS).
Materials and methods
Study area
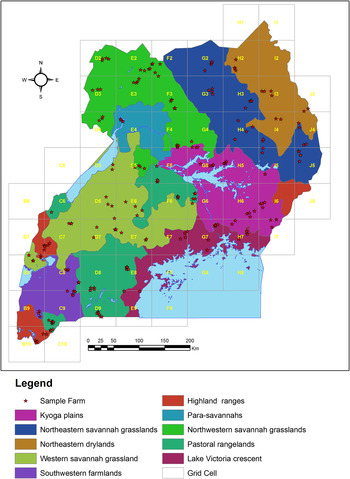
This study covered the whole of Uganda due to the widespread distribution of indigenous cattle. The study area has been described in Kabi et al. (Reference Kabi, Masembe, Muwanika, Kirunda and Negrini2014). Briefly, Uganda's total area is 241 550.7 square kilometres (sq. km), with open waters and land occupying 41 743.2 and 199 807.4 sq. km, respectively. The county's altitude ranges from 620 m (Albert Nile) to 5 111 m (Mt. Rwenzori peak) above sea level. The temperatures range from 16 to 26 °C (April and November) and over 30 °C (December and March) in most regions. Southern Uganda receives more rainfall (>2 100 mm), which decreases towards the north and northeast (<500 mm) turning into semi-arid conditions. These conditions influence the occurrence of well-vegetated savannah in western, southern and central regions, while dry plains occur in northern and northeastern regions of Uganda (UBOS, 2013). Several lakes and rivers occur, which influence the availability of natural pasture and water on which indigenous cattle systems entirely depend. Uganda's 10 AEZs have been described (Figure 1) as areas with homogeneous socio-economic, ecological and farming systems (MAAIF, 2004). They include the northeastern drylands (NED), northeastern savannah grasslands (NESG), northwestern savannah grasslands (NWSG), Kyoga Plains (KP), Lake Victoria Crescent (LVC), western savannah grasslands (WSG), western highland ranges (WHR), pastoral rangelands (PR), southwestern farmlands (SWF) and para savannahs (PS). Different indigenous cattle breeds are reared in all the AEZs, preferred for their tolerance to endemic tick-borne diseases and ability to survive on poor quality feeds (MAAIF/UBOS, 2009).
Agro-ecological zones (AEZs) of Uganda (adopted from MAAIF, 2004), grid cells and sampling sites.

Data collection procedure
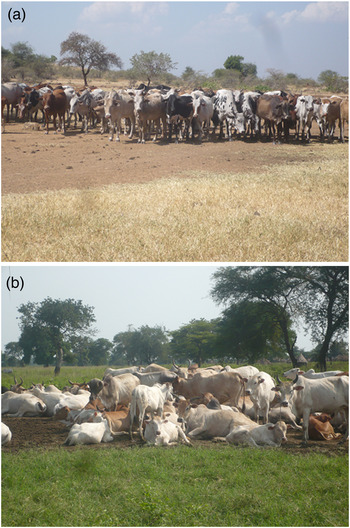
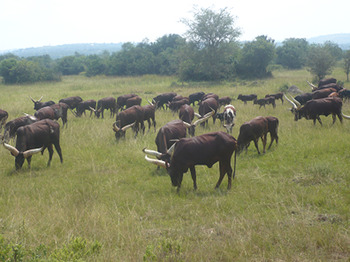
This study embraced a landscape sampling strategy defined by 50 grid cells, enabling an inclusive sampling across the 10 AEZs as previously explained in Kabi et al. (Reference Kabi, Masembe, Muwanika, Kirunda and Negrini2014). Only female cattle were used in this study due to the low numbers of males available in the sampled herds. Ten linear morphological traits were measured from 801 randomly selected female cattle from 209 herds comprising 46 Nganda (B. indicus,), 368 Ankole (B. taurus indicus) and 387 EASZ (B. indicus). The Nganda sample size was quite low compared with other breed groups, however, they were considered due to the fact they are reared within crop–livestock localities and are regarded as B. indicus with unique attributes. An Etrex® global positioning system (GPS) handset device which employs satellite navigation system was used for recording the topographical positions of the different sample farms/herds. Locations (latitudes and longitudes) of the 209 were overlaid on the 10 AEZ using ArcGIS® version 10 to show the countrywide pattern of data collection as shown in Figure 1. Examples of indigenous cattle herds with unique but similar morphological feature and body colour patterns are shown in Figures 2 (a, b) and 3 observed during our field visits.
(a) A herd of the East African shorthorn zebu (EASZ) cattle from northeastern drylands (NED) of Uganda. (b) A herd of the East African shorthorn zebu (EASZ) cattle from northwestern savannah grasslands (NWSG) of Uganda.

A herd of the Ankole cattle from pastoral rangelands of Southwestern Uganda.

For each well-restrained female cattle positioned on a relatively even surface, sex, breed, age (months) based on dentition, 10 linear body measurements were recorded to the nearest centimetre (cm) using a flexible tape by the first author to minimize in between-individual variations as previously explained by Mwacharo et al. (Reference Mwacharo, Okeyo, Kamande and Rege2006) and Alderson (Reference Alderson1999). The linear measurements taken on each animal were:
-
(a) horn length (HL) – the distance from the base of the horn to its tip,
-
(b) animal length (AL) – the distance from the top of the head to the base of the tail,
-
(c) fore arm length (FAL) – the distance from the elbow joint to the extreme end of hoof,
-
(d) fore arm circumference (FAC) – the perimeter distance of the metacarpal joint of the fore arm,
-
(e) face length (FL) – the distance from the muzzle to the top of the head,
-
(f) horn base circumference (HBC) – the perimeter distance at the base of the horn,
-
(g) length between the horn bases (LHB) – the distance between one horn base to the other,
-
(h) length between the horn tips (LHT) – the distance between one horn tip to the other,
-
(i) muzzle circumference (MC) – the perimeter distance of the muzzle
-
(j) tail length (TL) – the distance from the base of the tail to the end of tail switch.
The measurements were made before the cattle were grazed to avoid ascending biases of certain variables due to feed intake. Gestating females were excluded from this study. The age groups were estimated by dentition and clustered into four categories 7–24, 25–36, 37–72 and 73–192 based on minimal differences observed within the categories.
Statistical analysis
Data coding, cleaning and transformation were done in STATA® statistical package (2013). The analyses were performed using the linear regression model of STATA® (2013) and Statistical Package for Social Sciences (SPSS) version 21 (IBM® SPSS® 2012, New York, USA). Means alongside the standard errors (SE) and statistically significant differences between morphological traits based on the study cattle breeds, age groups and AEZs were calculated. Descriptive statistics of the morphometric traits and analysis of variance (ANOVA) were used to establish significant differences at P ≤ 0.05.
Application of multivariate analysis to interrogate morphometric diversity and classifications of different cattle breeds has recently earned scientific credit (Yakubu, Salako and Imumorin, Reference Yakubu, Salako and Imumorin2011). Linear statistical regression models to determine the trend of the 10 linear morphometric trait variations among age groups, AEZs and breeds were computed. The linear multiple regression models used took the format of
 $$Y_{ijk} = \mu + B_i + {\rm AEZ}_j + {\rm A}k + ({\rm BAEZ})ij + ({\rm BA})jk + ({\rm BAAEZ})ijk + E_{ijk}, $$
Y ijk is the morphometric trait on the animal of the ith breed, sampled from the jth AEZ, categorized to the kth age group; μ the overall mean; B i the effect of the ith breed (i = Ankole, Nganda, EASZ); AEZ k the effects of the kth AEZ (k = NED, NESG, NWSG, KP, LVC, WSG, WHR, PR, SWF, PS); Al the effect of the lth age group (l = 7–24, 25–36, 37–72, 73–192 months); (BAEZ)ik the interaction effect of the ith breed and kth AEZ; (BAEAZ)ijk the interaction effect of the breed, AEZ, age; and E ijk the random error peculiar to each animal.
Linear regressions coefficients were used to predict the relationships of the 10 linear morphometric traits with the age groups and breed types. The estimated general linear model equation took the format of
 $$Y_i = \beta _0 + \beta _1 X_1 + \beta _2 X_2 + \beta _3 X_3 + \beta _4 X_4 + \beta _5 X_5, $$
where Y i is the morphometric variable; β 0 is the constant coefficient; β 1 to β 5 are the regression coefficients; X 1 and X 2 are the Nganda and EASZ cattle, respectively; X 3, X 4 and X 5 are the 25–36, 37–72 and 73–192 age groups, respectively.
Mahalanobis squared distances, morphometric classifications were computed in STATA® (2013). The stepwise discriminant analysis was performed to determine the most discriminating morphometric trait of the cattle breeds using the SPSS version 21 (IBM® SPSS® 2012, New York, USA).
Results
Age, breed and AEZs significantly influenced variation of linear morphometric traits of the female cattle studied. Age significantly influenced all traits except HBC, FAL and FAC, while AEZs and breed significantly influenced all the traits. Interactions of breed with AEZs influenced all traits except FAC, while interaction of breed with age, and AEZs with age significantly influenced FL and FAL, respectively. Interactions of age, breed and AEZs significantly influenced FL only. The summary of ANOVA for the variation of linear morphometric traits and levels of significance are shown in Table 1.
Summary ANOVA for linear morphometric traits of indigenous female cattle.

AEZ, agro-ecological zone; DF, degrees of freedom; EASZ, East African shorthorn zebu; HL, horn length; LHT, length between the horn tips; LHB, length between the horn bases; HBC, horn base circumference; FAL, fore arm length; FAC, fore arm circumference; FL, face length; MC, muzzle circumference; TL, tail length; AL, animal length.
NS, Not significant (P > 0.05); ***, very highly significant (P < 0.001); **, highly significant (P < 0.01); *, significant (P ≤ 0.05).
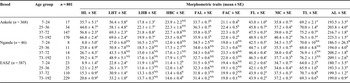
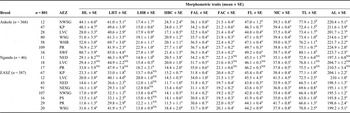
Generally, the study linear morphometric traits exhibited significant gradual increase from low, intermediate to high dimensions among the EASZ, Nganda and Ankole cattle breeds, respectively. All the study traits of Ankole cattle significantly differed among the age groups with exception of HBC. All the study traits of EASZ cattle exhibited significant differences among the age groups with exception of LHB, FAL and FAC. Among the Nganda cattle, the HL, FL, MC and AL exhibited significant differences within the different age groups. The traits generally increased along the age gradient, with older age groups exhibiting higher linear dimensions and providing a suitable source of breed differentiation as shown Table 2.
Variations of linear morphometric traits of indigenous female cattle breeds among the different age groups.

SE, standard error; HL, horn length; LHT, length between tips; LHB, length between the horn bases; HBC, horn base circumference; FAL, fore arm length; FAC, fore arm circumference; FL, face length; MC, muzzle circumference; TL, tail length; AL, animal length, age is measured in months, linear morphometric traits are measured in centimetres; EASZ, East African shorthorn zebu.
a,b,cRefer to very highly significant (P ≤ 0.000) differences, highly significant (P ≤ 0.00) differences and significant (P ≤ 0.05) differences, respectively. NS, Not significantly difference. The linear morphometric traits for each breed were compared among the different AEZs in the same column indicated with the same superscript.
Linear morphometric traits from SWF, PR and WHR showed comparatively higher dimensions than traits from PS, NED, NESG and NWSG. The variations of morphometric traits within same cattle breeds sampled from different AEZs were observed. Similar traits of Ankole cattle from different AEZs were significantly different. Among the EASZ cattle similar traits exhibited significant differences with exception of LHB, while the LHB, HBC, FAL and MC of Nganda cattle exhibited significant differences as shown in Table 3.
Variations of linear morphometric traits of indigenous female cattle breeds sampled from the different AEZs.

AEZ, Agro-ecological zone; SE, standard error; HL, horn length; LHT, length between tips; LHB, length between the horn bases; HBC, horn base circumference; FAL, fore arm length; FAC, fore arm circumference; FL, face length; MC, muzzle circumference; TL, tail length; AL, animal length; EASZ, East African shorthorn zebu; NED, northeastern drylands; NESG, northeastern savannah grasslands; NWSG, northwestern savannah grasslands; KP, Kyoga Plains; LVC, Lake Victoria Crescent; WSG, western savannah grasslands; WHR, western Highland ranges; PR, pastoral rangelands, southwestern Farmlands; PS, para savannahs.
a,b,cRefer to very highly significant (P ≤ 0.000) differences, highly significant (P ≤ 0.00) differences and significant (P ≤ 0.05) differences, respectively. The linear morphometric traits for each breed were compared among the different AEZs in the same column indicated with the same superscript.
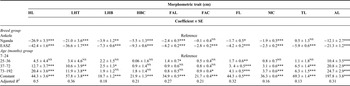
Regression coefficients were used to exhibit the relationship of the 10 linear morphometric traits with breed and age groups. Coefficients of age and breed groups exhibited high levels of significance providing suitable prediction parameters of the linear morphometric traits. For example the HL may be estimated from the following general equation.
 $${\rm HL} = 44.3 - 26.9X_1 - 42.4X_2 + 4.5X_3 + 12.7X_4 + 20.4X_5, $$
where X 1 and X 2 are the Nganda and EASZ cattle, respectively; X 3, X 4 and X 5 are the 25–6, 37–72 and 73–192 age groups, respectively. The linear regression coefficients and their levels of significance are shown in Table 4.
Linear regression parameter estimates for prediction of the linear morphometric traits of female cattle based on the breeds and age groups.

EASZ, East African shorthorn zebu; SE, standard error; HL, horn length; LHT, length between the horn tips; LHB, length between the horn bases; HBC, horn base circumference; FAL, fore arm length; FAC, fore arm circumference; FL, face length; MC, muzzle circumference; TL, tail length; AL, animal length.
NS, Not significant (P > 0.05); ***, very highly significant (P < 0.001); **, highly significant (p < 0.01); *, Significant (P ≤ 0.05).
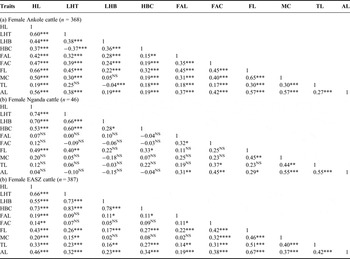
Pairwise correlations among the various linear morphometric traits of the three cattle breeds are given in Table 5. Among the Ankole, all the study traits were significantly correlated except for MC versus LHB; whereas among the Nganda, significant correlation were observed in HL versus (LBT, LHT, HBC, FL), LHT versus (LHB, HBC, FL), HBC versus LHB, FL versus HBC, FAL versus (FAC, AL), FAL versus (TL, AL), FL versus (MC, AL), TL versus (MC, AL) and AL versus MC. The EASZ morphometric traits exhibited significant correlations except FAL versus LBT, FAC versus (LBT, LHB, HBC) and MC versus (LHB, HBC, FAL).
Pairwise correlation coefficients and their significance levels among the linear morphometric traits.

EASZ, East African shorthorn zebu; HL, horn length; LHT, length between the horn tips; LHB, length between the horn bases; HBC, horn base circumference; FAL, fore arm length; FAC, fore arm circumference; FL, face length; MC, muzzle circumference; TL, tail length; AL, animal length.
NS, Not significant (P > 0.05); ***,very highly significant (P < 0.001); **,highly significant (P < 0.01); *, significant (P ≤ 0.05).
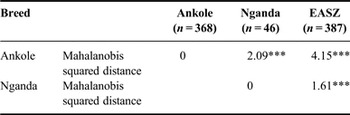
The Mahalanobis squared distances were calculated to estimate the levels of linear morphometric trait diversity for female cattle. The Mahalanobis squared distances were significantly different based on pairwise breed comparisons, exhibiting a gradient of low 1.61 (EASZ and Nganda), intermediate 2.09 (Nganda and Ankole) and high 4.15 (EASZ and Ankole) linear morphometric trait diversity as shown in Table 6.
Mahalanobis squared distances between the three female cattle groups.

EASZ, East African shorthorn zebu.
*** Very highly significant at P < 0.000.
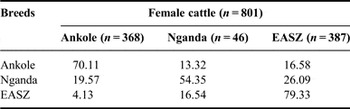
Classification of the study cattle into breed groups using the linear morphometric traits was computed. The correct percentages of breed classification were Nganda (54.4), Ankole (70.1) and EASZ (79.3) as shown in Table 7. The occurrence of misclassification could be indicative of interbreeding between the different breed populations.
Percentage classifications of indigenous cattle into their breed groups using the linear morphometric traits.

EASZ, East African shorthorn zebu.
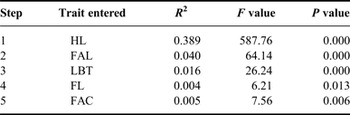
Stepwise selection of the five most discriminant linear morphometric traits were identified as HL, FAL, LBT, FL and FAC. These traits may be used to adequately discriminate the three indigenous female cattle breeds. Their levels of discriminating power are shown in Table 8.
Stepwise selection summary of the five most discriminant linear morphometric traits.

HL, horn length; FAL, fore arm length; LBT, length between the horn tips; FL, face length; FAC, fore arm circumference.
Discussion
The present study has revealed that linear morphometric structures of indigenous cattle populations comprising the Ankole, Nganda and EASZ females vary with age, breed types and AEZs. This study utilized female cattle due to the fewer males within sampled herds since the later are kept mainly for breeding purposes. These variations are useful for cattle populations to adapt to different environments, and maybe utilized for livestock breed improvement initiatives and conservation of unique genotypes (Kugonza et al., Reference Kugonza, Nabasirye, Mpairwe, Hanotte and Okeyo2011). The aforementioned structures have been shaped through active selection of unique morphometric traits aimed at promotion of agro-ecological fitness and enrichment of socio-cultural identities among Uganda's cattle keeping communities. Consequently various indigenous cattle populations have evolved in specific AEZs, adopting the names of cattle keeping communities who breed them (Balikowa, Reference Balikowa2011). This study reveals a significant upward trend of linear morphometric trait dimensions which may be described as low, intermediate and high for the EASZ, Nganda and Ankole cattle populations, respectively. These findings are in agreement with recent studies by Kugonza et al. (Reference Kugonza, Nabasirye, Mpairwe, Hanotte and Okeyo2011) who observed that the Ankole cattle have higher body linear measurements compared with the EASZ cattle. Studies in Tanzania (Mwambene et al., Reference Mwambene, Katule, Chenyambuga and Mwakilembe2012) and Kenya (Mwacharo et al., Reference Mwacharo, Okeyo, Kamande and Rege2006), on the Tanzanian Fipa, Kenyan Kamba and Masai zebu cattle linear morphometric traits revealed that HL, length between the horn tips, HBC measurements are similar to those of EASZ observed in this study although lower than those of Ankole cattle of Uganda. Since the HL and AL are directly correlated to body weights and cattle sizes (Kugonza et al., Reference Kugonza, Nabasirye, Mpairwe, Hanotte and Okeyo2011; Mwambene et al., Reference Mwambene, Katule, Chenyambuga and Mwakilembe2012), then Ankole cattle have evolved comparatively superior linear morphometric traits and body sizes compared with the EASZ.
The Mahalanobis squared distances computed among the three female cattle breeds were significantly different corresponding to high linear morphometric diversity among the study indigenous cattle breed types. This agrees with Ndumu et al. (Reference Ndumu, Baumung, Hanotte, Wurzinger, Okeyo, Jianlin, Kibogo and Sölkner2008b) who observed significant differences of morphometric distances between different clusters of Ankole cattle. The linear morphometric diversity was observed to be low between the EASZ and Nganda, intermediate between the Nganda and Ankole and high among the Ankole and the EASZ breeds. Recently, Bett et al. (Reference Bett, Okeyo, Malmfors, Johansson, Agaba, Kugonza, Bhuiyan, Filho, Mariante, Mujibi and Philipsson2013) have reported that the Nganda group is a hybrid of the Ankole and EASZ, although more closely associated with the later. This explains the occurrence of low morphometric distances between Nganda and EASZ, and intermediate between the Nganda and Ankole. Similarly, the high morphometric distance between the Ankole and EASZ is strongly suggestive of high trait diversity between the two populations. These distances correspond to traditional farmers’ dissimilarities of selective breeding criteria for desirable traits to enhance adaptation to contrasting AEZs.
The AEZ attributes support indigenous cattle through provision of natural pasture feeds, water resources and suitable ambient temperatures. Lately, Balikowa (Reference Balikowa2011) has noted that the Ankole cattle are established in the southern and Western Uganda. These regions are characterized by comparatively higher altitudes, lower ambient temperature ranges and abundant rainfall patterns (>2 100 mm). These conditions favour good pasture rangelands, resulting into more feed resource availability. The exhibition of higher linear morphometric traits among the Ankole of the SWF, PR and WHR AEZs could be partly due to the availability of comparatively higher natural pasture and water resources compared with the northeastern drylands and northwestern savannah grasslands. Indeed, Mwambene et al. (Reference Mwambene, Katule, Chenyambuga and Mwakilembe2012) have recently noted that variations in availability of feed resources and farmers’ breeding practices plus natural breeding barriers such as detachment between different locations largely account for morphometric trait differences. Similarly, Ankole cattle keepers have memorized selective breeding criteria based on customary knowledge to enhance higher productivity, socio-cultural identity and beauty. These criteria favour larger body sizes, tall frames and large white curved horns for the cows. Similar selection criteria for bulls have been described (Ndumu et al., Reference Ndumu, Baumung, Wurzinger, Drucker, Okeyo, Semambo and Sölkner2008a; Kugonza et al. Reference Kugonza, Nabasirye, Mpairwe, Hanotte and Okeyo2011, Reference Kugonza, Nabasirye, Mpairwe, Hanotte and Okeyo2012), which largely accounts for socio-cultural identity of Ankole cattle populations.
The EASZ cattle exhibited comparatively lower linear morphometric trait dimensions which occurred in the NED, PS, NESG and NWSG AEZs. The northeastern, northern and northwestern regions are characterized by lower altitudes, higher ambient temperatures and lower rainfall patterns (<500 mm) which consequently lower the availability of pasture and water resources (Balikowa, Reference Balikowa2011). Consequently, indigenous livestock farmers’ selection criteria tend to favour cattle's ability to survive under lower feed and water availability (FAO, Reference Rischkowsky and Pilling2007; Nalule, Reference Nalule2010) which in turn influences lower body sizes of EASZ cattle breed types. Selection of smaller body measurements have enabled the comparatively smaller EASZ cattle to thrive under the less privileged climatic, feed and water resource conditions (Loquang and Köhler-Rollefson, Reference Loquang and Köhler-Rollefson2005; FAO, 2009).
The majority of pairwise correlation coefficients between the linear morphometric measurements were positive and highly significant. This enables accurate estimation of unavailable but correlated traits. More so in case of inability to directly measure the trait at a point in time necessitating longitudinal studies to be accurately estimated such as production traits as previously observed by Kugonza et al. (Reference Kugonza, Nabasirye, Mpairwe, Hanotte and Okeyo2011), among the Ankole cattle. Most significant pairwise correlations were evident among the Ankole, followed by the EASZ and least among the Nganda cattle. The cause for the differences in the level of correlation among the linear morphometric traits between specific cattle breeds requires more investigations.
The study of linear morphometric traits were used to classify the female cattle into their breed groups of Ankole, EASZ and Nganda resulting into variable grades of accuracy. The occurrence of inaccurate classification is largely due to interbreeding between populations as preferred by traditional farmers, for example crossbreeding the Ankole and EASZ has resulted into composite cattle breeds such as the Nganda. While interbreeding between the different EASZ has given rise to Nkedi and Nsoga cattle populations (Bett et al., Reference Bett, Okeyo, Malmfors, Johansson, Agaba, Kugonza, Bhuiyan, Filho, Mariante, Mujibi and Philipsson2013), crossbreeding is common in AEZs harbouring more than one indigenous breed types and where exotic genotypes such as Friesians are being popularized for increased productivity, such as among smallholder dairy farmers in central Uganda. Linear morphometric traits within the same breed populations sampled from different AEZs exhibited significant differences which could be associated with morphological signatures of selection between the zones. The Ankole, EASZ and Nganda cattle exhibited high, moderate and low within breed significant differences of the study morphometric traits, respectively. This further supports previous observations in which traditional farmers’ diverse selective breeding criteria within indigenous cattle populations for agro-ecological fitness resulting into evolution of unique cattle morphometric populations (FAO, 2009). This is also comparable with Ndumu et al. (Reference Ndumu, Baumung, Hanotte, Wurzinger, Okeyo, Jianlin, Kibogo and Sölkner2008b)'s findings that identified three sub-populations using micro-satellite markers and morphological analysis within Southwestern Uganda.
Conclusions
This study has provided insight on the extent to which traditional farmers’ selective breeding practices enhance identity and agro-ecological fitness resulting into creation of unique indigenous cattle morphometric populations. Secondly, the study has revealed that indigenous cattle linear morphometric variation is structured geographically with higher linear morphometric trait dimensions being exhibited in the southern, southwestern and western regions of Uganda. Although lower trait dimensions occur towards the northern, northwestern and northeastern regions which further corresponds to lower availability of natural feed and water resources. The high morphometric diversity among indigenous cattle population can be a basis for improvement and conservation with farmers’ preferences and adaptation to the different AEZs. Appropriate management practices, including feeding, disease control and selective breeding will further enhance sustainable production more so in areas where no other type of agricultural investment is possible.
Acknowledgements
We thank the Next generation methods to preserve farm animal biodiversity (NEXTGEN) project for providing the logistics for this study. The Uganda National Council for Science and Technology (UNCST) granted permission to undertake this study to which we are grateful. We are grateful to Todd Benson of the Development Strategy and Governance Division, International Food Policy Research Institute (IFPRI); Washington, USA for availing us the shape files for the AEZs of Uganda. We acknowledge Albert Mugenyi of the Coordinating Office for the Control of Trypanosomiasis in Uganda (COCTU) for helping with the use of ArcMap GIS software and spatial data mapping. We are grateful to John Padde, Johnson Mayega and Moses Namutale of the Department of Environmental Management, Makerere University for providing technical assistance during data collection. We acknowledge the DVOs, veterinary staff and farmers for granting us permission to undertake this study in their districts. This manuscript constitutes part of Fredrick Kabi's Ph.D. study supervised by Drs Vincent Muwanika and Charles Masembe, who are highly appreciated.
Statement of interest
The authors declare no conflict of interest.
Ethical clearance statement
This study was guided by the guidelines stated in the Guide for the Care and Use of Agricultural Animals in Research and Teaching (FASS, 2010).