


1. Introduction
There are still large gaps in the data coverage for measured ice thickness and bedrock elevation over Antarctica. Although new observations are continually becoming available, and an international project (BEDMAP) is assembling a new compilation, it is likely that large gaps may remain for some time in less accessible regions. Earlier compilations of ice thickness and bedrock elevation for the whole continent were constructed using simple smooth interpolating and contouring methods over the data-sparse regions. These smooth compilations have traditionally formed the basis of regular gridded digital datasets used for ice-sheet modelling.
Bedrock elevation is one of the major boundary conditions influencing the shape and evolution of ice sheets, and ice-sheet modelling studies have shown some indications of apparent anomalies in the computed ice dynamics (see, e.g., Reference Budd and JenssenBudd and Jenssen, 1989) and in the modelled geometry of the ice sheet (see, e.g., Reference HuybrechtsHuybrechts, 1990) over some of these sparse-bedrock-data regions. In some cases, new field data have revealed large anomalies in the bedrock, relative to the interpolated compilations.
The large-scale shape of the ice-sheet surface tends to reflect the major features of the bedrock topography, modulated by the pattern and distribution of the ice flux. While the large-scale topographic variation of the surface is of relatively low relief, the ice fluxes, which are directed by the direction of the surface gradient, show extremely high contrast from one location to another. A large number of measurements of the surface velocity of the ice sheet are becoming available, from precision in situ observations and from remote sensing, via automation of image comparisons and radar interferometric observations. These observations provide constraints on computed ice dynamics. At the same time, more accurate surface elevation data derived from satellite radar altimetry are now available over large regions of the continent. These can be combined with more comprehensive data on surface accumulation rates from field programs and from atmospheric general circulation models to allow the computation of balance-flux distributions. The balance fluxes can be compared with fluxes derived from observed velocities and ice-thickness measurements to assess the state of net mass balance over large regions of the continent. The elevation datasets also provide a stringent test of ice-sheet geometry for models. Comparisons of balance fluxes with observations from traverses have shown how well accurate surface topography can illuminate the flow in the ice sheet. A clear improvement was seen in comparisons of balance fluxes (Reference Budd and WarnerBudd and Warner, 1996) between those calculated using the early digital elevation model (DEM) based on European Remote-sensing Satellite (ERS-1) radar altimetry (Reference BamberBamber, 1994) and those calculated using the gridded digital elevation dataset (Reference Budd and SmithBudd and Smith, 1985) produced from the Scott Polar Research Institute (SPRI, Cambridge, U.K.) folio (Reference DrewryDrewry, 1983). The fidelity with which balance fluxes derived from accurate topographic data reproduce the observed ice flow is even more clearly demonstrated in the application of a new 5 km scale DEM produced at the Antarctic CRC (Fricker and others, in press a) to a study of the mass balance of the Lambert Glacier basin, East Antarctica (Reference PhillipsPhillips, 1999; Fricker and others, in press b).
These balance flux calculations, which use only the slope direction of the ice surface, show how the cumulative effect of the accumulation distribution and the gentle topography produces a much more extreme set of spatial contrasts in ice flux. Even using the 20 km gridded version of the SPRI folio surface-elevation map, we showed (Reference Budd and WarnerBudd and Warner, 1996) that large spatial contrasts in ice-flux magnitude (streaming behaviour) could be expected far into the remote interior of the East Antarctic ice sheet. This picture is supported by the interpretation of features seen by RADARSATas the shear margins of inland ice streams.
Other workers have already shown that accurate altimetric topography allows one to move beyond balance calculations, which are based on the direction of slope, to more complicated considerations of ice dynamics, based on knowledge of ice mechanics and the geometry of the ice-sheet surface. For example, Reference Rémy, Ritz and BrissetRemy and others (1996) explored various aspects of ice-flow relations using ice-sheet surface elevation data from satellite altimetry together with the SPRI folio bedrock-data compilation. In contrast, if one takes some of the features of ice flow as established inputs, the combination of balance fluxes and computed dynamic fluxes provides a technique for estimating the bedrock elevation in regions where measurements of ice thickness are unavailable. This can be constrained by observed velocities in regions of known ice thickness.
The attractive prospect is that ice-sheet thickness and hence bedrock elevations can be inferred by combining balance fluxes (or observations of surface velocities) with accurate surface slopes, calculated from precision surface topography, smoothed over an appropriate length scale for the shallow-ice approximation, namely, 10–20 ice thicknesses (see, e.g., Reference Budd and CarterBudd and Garter, 1971; Reference Budd and YoungBudd and Young, 1979), and using our understanding of the nature of ice flow. This approach has a long history, particularly in the study of glaciers (Reference Budd and AllisonBudd and Allison, 1975), and we recently learned that it has also been applied to the West Greenland ice sheet (Reference ReehReeh, 1983,Reference Reeh1986). The calculation of ice thickness cannot be done with the accuracy associated with radio-echo sounding (RES) measurements but it can provide a continuous map of the ice thickness, and could be used to interpolate between the observations, since most of the uncertainties involved are systematic.
Development of an ice-thickness estimation model using a three-dimensional thermodynamic ice-sheet model is in progress, and will enable us to explore the importance of feedback between inferred bedrock depth and thermodynamics and the influence of anisotropic ice-flow relations describing the enhancement of flow in high shear bands. Here we present results from a simplified version of the technique, which already shows the potential of the approach. We outline the general method and our simplified scheme in section 2, and then present two examples. First, a derived bedrock for the entire continent is calculated using only the surface elevations, the ice-accumulation distribution, ice-flow properties and an assumption of mass balance. Using the recently assembled package of 20 km interval gridded datasets (Reference Huybrechts, Steinhage, Wilhelms and BamberHuybrechts and others, 2000), the derived bedrock is compared with their bedrock compilation. Then we present the results of a test of the technique by a calculation for the Lambert Glacier basin, where the Australian National Antarctic Research Expeditions (ANARE) traverses have already provided evidence of large differences in the bedrock elevations from those of the earlier compilations.
2. Methodology
Throughout most of the Antarctic ice sheet the ice flow is believed to be predominantly creep flow, with a non-linear and temperature-dependent flow law relating the strain rates to the stresses exerted as the ice deforms under its own weight. This non-linear relation between the stresses and the response of the ice sheet is the central factor that underlies the inference of bedrock elevation using balance fluxes and accurate surface-slope information. For isotropic ice flow, the constitutive relations between the stresses and strain rates represented by Reference GlenGlen’s (1955) flow law are

where
 and
 are the strain-rate and deviatoric-stress tensor components, respectively, τ0 is the octahedral shear stress (proportional to the effective shear stress), A(T) is a temperature-dependent coefficient and the flow-law exponent (n)is usually taken as 3. In most ice-sheet models the shallow-ice approximation is employed: longitudinal stresses are neglected, the strain rate
 is approximated by the vertical derivative of horizontal velocity
 and the driving shear stress at a level z in the ice sheet is taken as τ
s = ρgα(s – z), where p is the density of ice, g is the acceleration due to gravity, a is the surface slope and s is the surface elevation. The shallow-ice approximation requires that a represents the surface slope over a scale of 10–20 ice thicknesses. This leads to the standard expression for the magnitude of the depth-integrated dynamic ice flux due to ice flow by deformation:

where D is the total ice thickness and C is a dimensionless vertical coordinate.
This equation for the flux requires knowledge of the distribution of temperature T(x, y, z) throughout the ice sheet, which involves solving the heat equation, describing the influences of heat diffusion and advection, with internal heating from the deformation of the flowing ice, and boundary conditions of surface temperature and basal geothermal gradient, or basal pressure-melting temperature. We are presently also incorporating sliding flow into our thermodynamic model, but we neglect it for the calculations in the present study. This means that our model will overestimate the ice thickness in regions where sliding flow is important: in the ice streams in West Antarctica, and in the fast outlet glaciers near the coast.
Our proposal is to compare the dynamic flux with the corresponding balance flux, which can be calculated from the accumulation distribution a(x,y) from the equilibrium form of the continuity equation:

using the surface slope directions to define the direction of
 . As we are considering a hypothetical mass-balance equilibrium, it seems appropriate to couple this with a solution of the steady-state temperature distribution throughout the ice sheet, so the system of velocity (or flux) calculations and temperature calculations would be solved iteratively, with the thickness D(x, y) being adjusted to maintain the equality between balance and dynamic fluxes. While there is an additional influence on thickness via the temperature profile, the main point is that the dynamic flux due to deformational flow is proportional to the fifth power of the ice thickness. This is traditionally viewed as indicating the sensitivity of the dynamics of the ice sheet to knowing the bedrock boundary condition, but it can be turned to advantage since even uncertainties in balance fluxes as large as 50% would contribute only a 10% error in the ice-thickness determination. The influence of the exact choice of the ice-flow relation parameter A(T) is diminished injust the same way. It might be thought that a 10–20% uncertainty in inferred ice thickness makes the results of limited value, but it should be noted that errors in selection of the deformation rates, or of the state of balance, and the uncertainties in the accumulation distribution used in the calculation of balance fluxes, are essentially systematic errors and can be compensated for by even a limited number of comparisons with observations. On the other hand, as is shown below, errors in the bedrock elevation compilations from interpolating over data gaps can be much larger than ±10%.
Implementation of this coupled system is in progress, but as a simple demonstration of the potential of this approach we calculate the balance fluxes from a DEM and surface accumulation distribution, using the methods and computer codes outlined in Reference Budd and WarnerBudd and Warner (1996) and Fricker and others (in press b). Then, taking the surface slopes from the same DEM (smoothed on an appropriate distance scale), we calculate
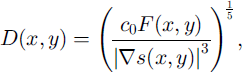
where c0, which can be regarded as an effective ice-flow parameter (representative of the higher shear flow in the lower part of the ice sheet), stands as a proxy for the depth integrations involving A(T) in Equation (2), along with the powers of pg and any weighting factors that it might be considered appropriate to include from considerations of balance. We were interested to see whether a single choice of this effective flow parameter would give an acceptable representation of the ice thickness and bedrock elevations over Antarctica. We now present some results from two studies directed at answering that question.
3. Simple Derivation of the Bedrock of the Antarctic Continent
In order to use an elevation dataset that incorporated satellite radar altimetry data, with a bedrock dataset directly available for comparison, we based this example on the set of 20 km scale gridded datasets of surface elevation, bedrock, ice thickness and ice accumulation produced by Reference Huybrechts, Steinhage, Wilhelms and BamberHuybrechts and others (2000) and proposed by them as a new standard set for the ice-sheet modelling community to replace those produced at the University of Melbourne from the SPRI folio (for ice-sheet properties) in 1984. (The corresponding accumulation dataset was prepared from data collated by Reference Budd and SmithBudd and Smith (1985).) The surface-elevation fields were smoothed using the adjacent gridpoints (a 40 km smoothing scale), and balance fluxes were calculated using the program developed at the Antarctic CRC (Reference Budd and WarnerBudd and Warner, 1996; Fricker and others, in press b). The surface slopes were then calculated using centred differences, the ice thickness (Equation (4)) was evaluated for a range of values of c0 and the corresponding bedrock maps were compared visually with the gridded bedrock dataset. The bedrock map for c0 = 105m3a is displayed in Figure 1a, with the bedrock dataset of Reference Huybrechts, Steinhage, Wilhelms and BamberHuybrechts and others (2000) in Figure lb.
The elevations, in kilometres above sea level, of (a) the derived bedrock elevation and (b) the gridded-bedrock data compilation from Reference Huybrechts, Steinhage, Wilhelms and BamberHuybrechts and others (2000). The elevations are truncated to the range (-1.5to 2.5 km) to increase the contrast. The sea-level bedrock elevation is contoured in black.

The general qualitative agreement between the two maps is striking. This is particularly the case in those regions where the bedrock compilation is based on extensive coverage of RES flight-lines, and from recent data gathered in Dronning Maud Land for the European Project for Ice Coring in Antarctica (EPICA) in the catchments of the Bailey Ice Stream and Slessor Glacier.The major observed bedrock features are seen in the derived bedrock, although generally the derived bedrock is overly deep in several of the subglacial trenches. This may reflect neglect of the effect of the warmer temperatures that may be expected in the lower layers of very thick ice. If we regard c0, as a representative column-averaged flow parameter for the whole continent, then the neglect of thermodynamic considerations in the ice flow can be expected to lead to a systematic overestimate of ice thickness in regions of deeper, warmer ice, with corresponding underestimation in regions of thinner, colder ice.
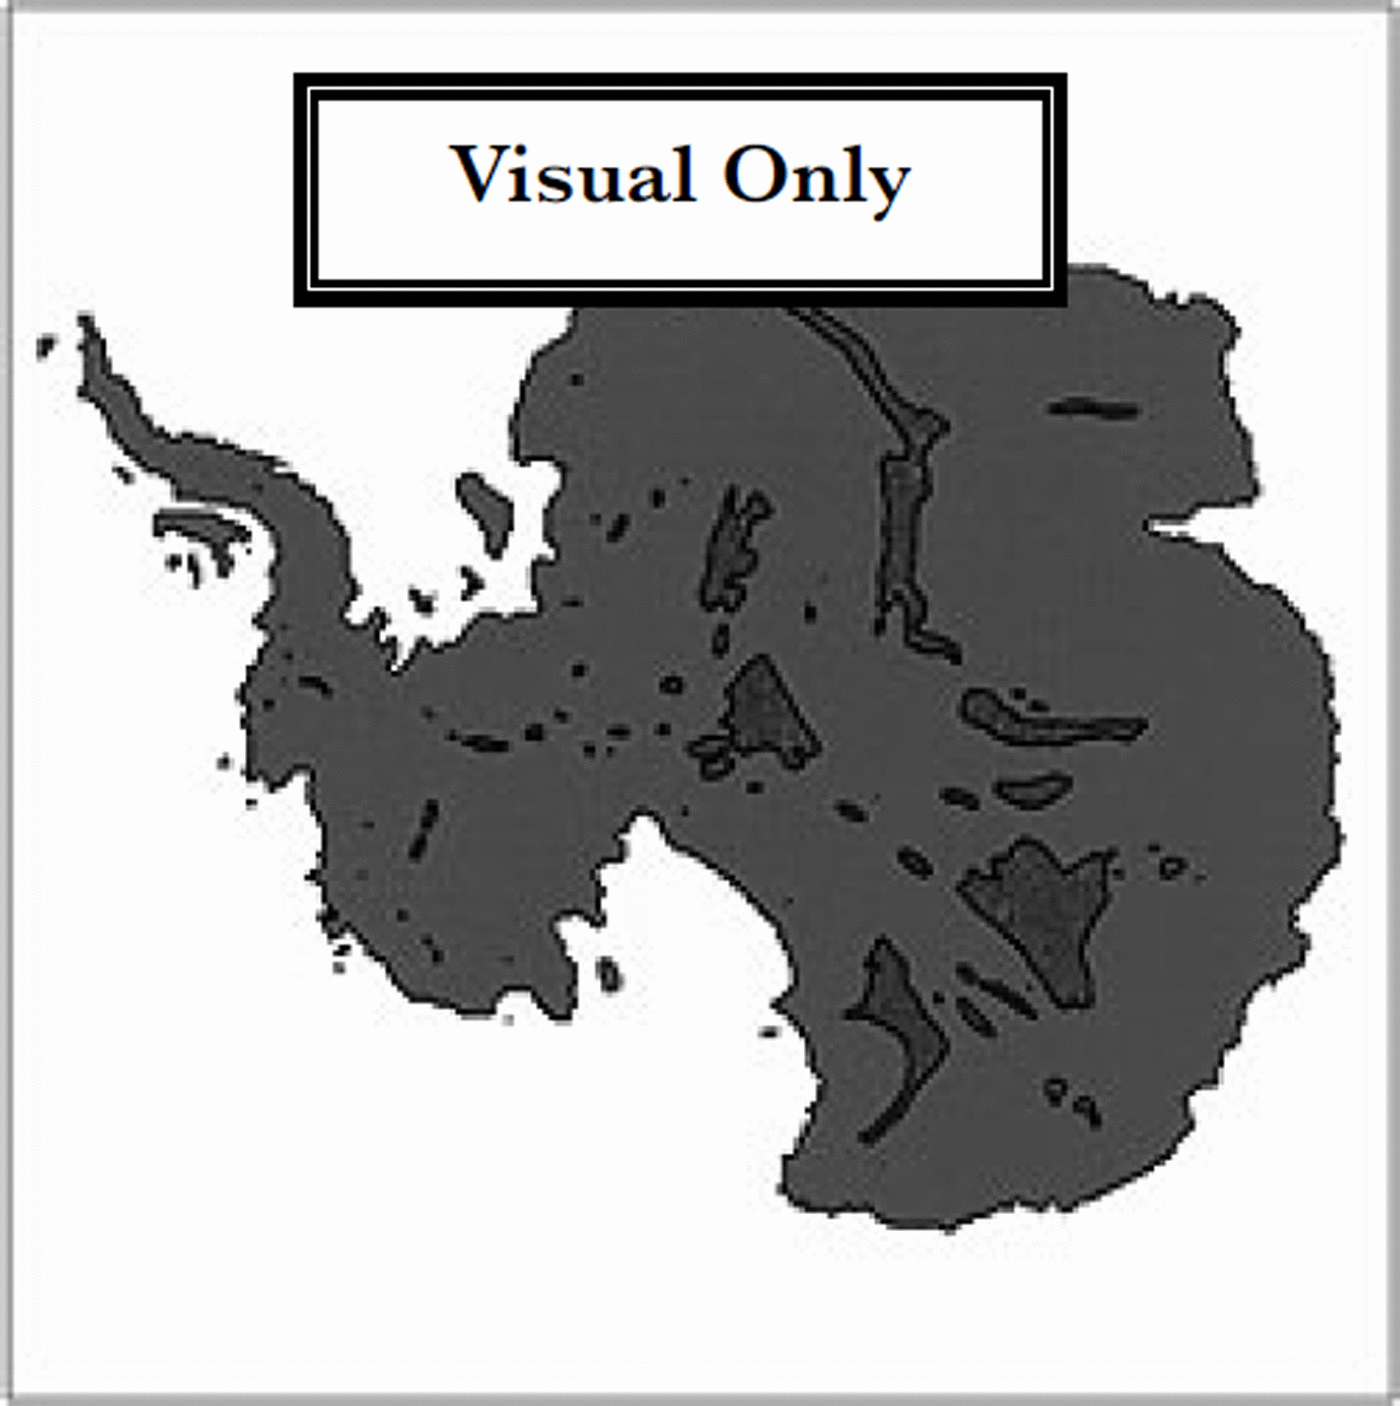
In the ice-stream regions, approaching the Siple Coast, and in the Pine Island Bay region in West Antarctica, the overestimate of ice thickness is almost certainly due to the neglect of sliding, and this may have local effects in other outlet glaciers such as Totten Glacier, East Antarctica. Relations describing ice sliding in such marine-based ice sheets often incorporate a sensitivity to the ice thickness quite different from that of Equation (4), through the use of buoyancy corrections to the basal normal stress (e.g. the sliding-velocity formulation of Reference Budd and JenssenBudd and Jenssen (1989)), and we are currently investigating the introduction of such sliding laws into the depth inversion calculation. The other overestimated deep regions are also correlated with very low surface slopes. This includes localized flat regions such as over Lake Vostok, and extensive regions with surface slopes of l0–3 or less, including the region around Dome C, which contains several subglacial trenches and highlands in Wilkes Land. RES does show the Wilkes Land region to be one of considerable variation in bedrock topography, and it may be unreasonable to expect that the simple shallow-ice approximation adequately describes flow across such terrain. From the surface elevation data, other apparently extensive low-slope regions lie between the Pole of Relative Inaccessibility (82°S, 55°40’E) and the Pensacola Mountains (84–85° S, 45–60° E), and near the South Pole adjacent to Titan Dome (88°30’ S, 150–180° E). Narrow zones of low slopes are also found along the major summit ridges of the ice-sheet surface. This may be partly an artifact of the smoothing and the centred differences employed. In these ridge locations the limit implied by Equation (4) as flux and slope both tend to zero is a delicate one. Regions with slopes of ≤ 10∼3 are indicated by the marked area in Figure 2.
The inland low-surface-slope regions of Antarctica where the surface slopes from the smoothed version of the elevation dataset from Reference Huybrechts, Steinhage, Wilhelms and BamberHuybrechts and others (2000) are Kl0–3 are indicated by shading.
The fact that the pattern of basal relief of Wilkes Land is reproduced as closely as it is encourages us to believe that our technique can prove useful in filling data-gap regions in bedrock maps. It also has implications for the thick ice and low-lying bedrock derived for less well-surveyed regions.
Where the bedrock-data compilation is a digitization of the SPRI folio map it is naturally much smoother in data-sparse regions, particularly in the interior of Dronning Maud Land, Princess Elizabeth Land and Queen Mary Land. The BEDMAP project will provide more bedrock data in some areas of East Antarctica, although the coverage may still be expected to have large data gaps with sparse or no data for about 25% of the continent. An initial comparison of the inferred bedrock with results of RES soundings from ANARE over snow traverses in Wilkes Land in the 1980s confirms the general agreement of the present map with observations except in the overestimated trenches, although further quantitative estimates of agreement are still to be made. It is expected that the inclusion of thermodynamic influences in the flow with the inclusion of the ice-sheet temperature distribution should improve this picture. The differences between the inferred bedrock and the bedrock compilation used here are sufficiently large in the data-sparse regions to suggest that ice-sheet models using this package of datasets may still not reproduce the surface topography faithfully in those regions, because of the poor representation of the bedrock. Finally, it should be remembered that some of the more prominent differences suggested in our picture of the bedrock lie in the region south of the coverage of the ERS-1 radar altimeter, and both the slope directions used in the calculation of the balance fluxes and the slopes used in the ice-thickness derivation may be less accurate in those regions.
4. Lambert Glacier Basin Bedrock
Encouraged by the general agreement observed using the 20 km DEM, we decided to apply our technique in the Lambert Glacier basin, the largest drainage basin in East Antarctica, with a catchment of approximately 1.5 xl06km2. Very few ice-thickness data regarding the interior of the basin were available for the SPRI folio. The ANARE traverses around the basin approximately followed the 2500 m elevation contour for over 2200 km. The traverses provide a bedrock profile from RES data (supplemented by gravity anomaly measurements) (Reference Higham, Reynolds, Brocklesby and AllisonHigham and others, 1995; unpublished information from M. Craven). The measured bedrock profile highlights the difficulties involved in interpolating sparse observations of such a variable quantity as bedrock.
The Lambert Glacier basin lies entirely within the range of the ERS radar altimeter, and a new DEM of the region on a 5 km grid has been produced at the Antarctic CRC (Fricker and others, in press a), and has already been used in a comparison of balance and observed ice fluxes for the traverse route (Reference PhillipsPhillips, 1999; Fricker and others, in press b). The traverse provides a long cross-section of the ice sheet in conditions where deformation is likely to dominate the flow. It is accordingly well suited to our simplified technique. A suitably smoothed version of the DEM was used, together with an ice-surface accumulation distribution (Reference Budd and SmithBudd and Smith, 1985), to calculate balance fluxes for the basin, and the c0 as in section 3. The resulting bedrock map is displayed in Figure 3, with the sea-level contour marked in black. The DEM was smoothed using a Gaussian weighting function, ε–(r/a)2, with the radial scale parameter (a) set at 20 km to achieve a smoothing comparable to that in the previous example.
The bedrock elevation, in kilometres above sea level, for the Lambert Glacier basin region. The elevations are truncated to the range (-1.5 to 2.0 km) to increase the contrast. The sea–level bedrock elevation is contoured in black. The route of the main ANARE Lambert Glacier basin traverse is shown in black. The high-surface-elevation regions (mainly ice divides) where the surface slopes are ≤ 10–3 are indicated by the white contours.

Figure 3 shows the deep channels, with bedrock below sea level, which are occupied by the streams leading into Lambert and Mellor Glaciers. These extend further inland than is usually portrayed in data compilations, as is seen for example from Figure lb. They flank the massif of the Gamburtsev Subglacial Mountains which appears much as it does in the SPRI folio bedrock map. Other features of the region such as the Mawson Escarpment and the Grove Mountains can also be seen. The route of the ANARE Lambert Glacier basin traverse is marked in Figure 3 in black together with the contour delineating inland regions where the surface slope is ω10–3. It is noticeable that much of the coastal region to the east of the Amery Ice Shelf is below sea level as was seen in Figure 1. We have not yet incorporated other sources of information on surface or bedrock topography (e.g. coastal mapping details, locations of rock outcrops), and the satellite-altimetry-based DEM has only limited success in describing the detailed and steep topography adjacent to the Amery Ice Shelf and to the coast.
In Figure 4 the profiles of surface elevation and of the observed bedrock topography from RES and gravity anomaly measurements are presented for the Lambert Glacier basin traverse route (after Reference Higham, Reynolds, Brocklesby and AllisonHigham and others, 1995; unpublished information from M. Craven), together with the inferred bedrock from our simplified model. Even though a free parameter, co, is in principle available to rescale the ice thickness, this hardly appears necessary. The only noteworthy discrepancy lies between the major ice streams seen in the deep bedrock trench observed at 1000–1350 km along the traverse. Here the model bedrock is higher, and this may reflect the high bedrock topography upstream and the character of the large-scale ice flow. The interpolation to the traverse route of the bedrock from the SPRI/Budd dataset and from the bedrock dataset of Reference Huybrechts, Steinhage, Wilhelms and BamberHuybrechts and others (2000) is also shown. The difficulty involved in interpolating between sparse observations and providing gridded data values for modelling is clear.
The profiles of the ice surface elevation and the bedrock elevation for the Lambert Glacier basin traverse route. The measurements from the traverse (after Reference Higham, Reynolds, Brocklesby and AllisonHigham and others, 1995; unpublished information from M. Craven) are plotted in black from a 2 km interval dataset. The bedrock derived from a smoothed version of the 5 km scale DEM is interpolated to the same locations and plotted in blue. The surface elevations associated with the balance-flux calculations are also plotted in blue. Interpolations of the bedrock dataset ofReference Huybrechts, Steinhage, Wilhelms and BamberHuybrechts and others (2000; red dashed line) and of the earlier digitization of the SPRI folio maps (green dashed line) onto the traverse route are also plotted for comparison.

5. Conclusions
The present work indicates that even a simple model can derive ice-thickness and bedrock distributions which should prove useful in filling data-gap regions in the interior of the Antarctic continent, using surface elevation data and ice-accumulation distributions via balance fluxes and basic assumptions about the dynamics of ice flow. This encourages us to believe that a more comprehensive scheme including the effects of temperature and basal sliding dynamics is worth pursuing.
Applying the simplified scheme to a recent surface elevation data compilation for the whole continent, we see a general agreement with the bedrock forms in the well-surveyed regions of Wilkes Land. Greater contrasts with the smooth extrapolations forced on data compilers by the sparsity of data are seen in several other regions. In particular, while one of the limitations of our model appears to be a tendency to over-predict depths of basins in regions of low surface slope, our example does call attention to the region between the Pole of Relative Inaccessibility and the Pensacola Mountains, East Antarctica. This region was labelled by Reference Vaughan and BamberVaughan and Bamber (1998) as a ˚low-profile" region in their simple continentality-based description of how the ice sheet is shaped by the location of its margins. In our model it appears this is a region of deep ice and low bedrock. Future improvements in surface elevation measurements south of the present limit of ERS altimeter data at 82° S should provide further insights into the bedrock in remote regions of the ice sheet by these methods. Observed surface velocities can obviously be combined with surface-slope information in a similar fashion to the present model to derive ice thickness. Conversely, in calculating balance velocities in regions where bedrock data points are sparse, a scheme like the one presented here may be a more reliable way of deriving the ice thickness than smooth interpolations from distant ice-thickness observations.
Acknowledgements
We would like to thank H. Fricker, N.Young and G. Hyland for access to their 5 km scale DEM of the Lambert Glacier basin. We also thank M. Graven, M. Higham and A. Brock-lesby for providing the elevation and ice-thickness profiles from the Lambert Glacier basin traverse. Finally we thank P. Huybrechts, D. Steinhage, F Wilhelms and J. Bamber for access to their gridded datasets.



