I. INTRODUCTION
In interconnection technologies, the development of environmentally benign solders is important. In this regard, various promising solder systems, such as Sn–Ag, Sn–Bi, Sn–Cu, Sn–In, and Sn–Zn, have been widely investigated. During the soldering process, the formation of intermetallic compounds (IMCs) at the solder/substrate interface causes a major effect on the reliability of soldered joints. IMCs are inherently hard and brittle, so excessive and thick IMCs can result in the reduction of joint strength. Many studies have explored the interfacial reaction and IMC formation between molten solders and various substrates. Generally, the kinetics of the interfacial reaction and growth behavior of IMCs depend principally on five factors Reference Howes and Saperstein1 : reaction temperature, liquid composition, composition of the solid substrate, agitation of the liquid, and volume of liquid in contact with the solid substrate.
Over the past two decades, the liquid structure/phase transition has gained considerable attention from academicians and industrial researchers. Reference Glosli and Ree2–Reference McMillan4 The liquid structure/phase transition has been applied to control solidified structures. Reference Bian and Wang5–Reference Zu, Chen, Li, Mao and Liu9 Interfacial reactions involve a liquid phase; naturally, the physicochemical properties of liquid metals greatly influence interfacial reactions. Qi et al. Reference Qi, Ding and Zhou10 recently investigated the dissolution kinetics of copper in liquid tin under the influence of the liquid structural transition. Their study showed that the application of the liquid structural transition markedly increases the dissolution rate and decreases the activation energy for the dissolution of solid copper in liquid tin.
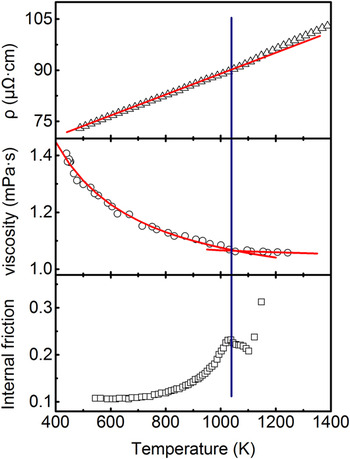
As a desirable solder material, the tin–bismuth eutectic solder exhibits excellent wetting and mechanical properties, as well as good compatibility with particular substrates. As shown in Fig. 1, Wang et al. Reference Wang, Bian and Liu11 observed an abrupt change in viscosity at 1053 K, and Wu et al. Reference Wu, Guo, Liu, Jia and Zhu12 studied the internal friction peak at about 1033 K. These investigations indicated that a structural change occurred in liquid Sn–Bi57, which closely coincided with the anomalous behavior of electrical resistance at about 1058 K explored by Li et al. Reference Li, Zu, Ding, Yu, Liu and Xi13 According to these findings, the structure of liquid eutectic tin–bismuth was in its original form at 773 K (before liquid structural transition) and changed at 1323 K (after liquid structural transition). The dissolution of solid copper in liquid eutectic tin–bismuth without the use of melt superheating treatment has been widely studied. This paper explores the dissolution kinetics of Cu in liquid Sn–Bi57 and the growth behavior of IMCs to highlight the role of liquid structural transition.
Temperature-dependence curves of electric resistance, Reference Li, Zu, Ding, Yu, Liu and Xi13 viscosity, Reference Wang, Bian and Liu11 and internal-friction Reference Wu, Guo, Liu, Jia and Zhu12 for liquid eutectic tin–bismuth. The red line is to guide the eye and the blue line indicates the structural transition temperature.

II. EXPERIMENTAL MATERIALS AND METHODS
The Sn–Bi57 solder was prepared from tin (99.99% pure) and bismuth granules (99.99% pure) in ceramic crucibles using an electric resistance-type furnace. The solder was covered with B2O3 slag to prevent oxidation and evaporation during the entire melting process. Samples A and B were separately heated to 773 and 1323 K, respectively, for 30 min. All the melts were then quenched in iced water to preserve the heredity genes of each structure in the solids obtained. The solidified Sn–Bi57 solder (2 ± 0.0001 g) was placed at one side of a Z-shaped quartz crucible, as shown in Fig. 2.
Schematic diagram of the reaction couple. The operation sequence is as follows: (1) the solid Sn–Bi57 was put into the left quartz and the copper rod was glued on the other side. (2) The Z-shaped quartz crucible was heated to the preset temperatures and the Sn–Bi alloy was melt. (3) The first rotation was used to make the Sn–Bi melt flow into the right quartz and immerse the upper surface of the copper rod in liquid eutectic tin–bismuth. (4) The second rotation was used to return the Z-shaped quartz to the original location and make the reaction couple in vertical direction.

The copper rod used (99.9% pure) possessed a diameter of 7 ± 0.01 mm and a length of 7 ± 0.01 mm. Before each experiment, the bottom surface of the copper rod was polished and dipped in 1% HCl solution to remove the oxide. The copper rod was then neutralized with 3% NaOH and covered with a thin coating of unclean flux to ensure complete wetting. As shown in Fig. 2, the copper rod was attached to the other side of the Z-shaped quartz crucible by a high-temperature adhesive that does not react with tin and bismuth. This process ensures that only the upper surface of the copper rod was immersed in liquid eutectic tin–bismuth.
The reaction was conducted in controlled-atmosphere box furnaces, which were filled with inert argon gas. As the sample reached the predetermined temperature, the Z-shaped quartz crucible was first rotated to make the copper upper surface attach to the liquid solder and then rotated quickly to the initial position. The dissolution reactions were performed at four different temperatures: 673, 723, 773, and 823 K. Five different reaction durations were selected for each temperature: 0.9, 1.8, 3.6, 7.2, and 18 ks. At the end of each experiment, all the reaction couples were cooled in air, sectioned normally to the long axis of the solid sample, and polished to a mirror finish. A total of 120 samples (3 repeat experiments × 2 melts × 4 temperatures × 5 reaction durations) were prepared and investigated.
Energy dispersive spectroscopy (EDS, Oxford instruments INCA x-act) analysis was used for the identification of the IMC layer. Optical microscopy and scanning electron microscopy (SEM) were used to observe the interfacial structures. The optical micrographs were used to measure the residual amount of the copper rod. The method for the measurement of the residual amount of the copper rod was similar to the method proposed by Zhao et al. Reference Zhao, Unuvar, Anselmi-Tamburini and Munir14 The residual thickness was calculated as the longitudinal area of the residual copper rod divided by its width. The average thickness of dissolved copper was the difference between the original length and the residual thickness of the copper rod. The equivalent thickness of the IMCs was measured from the SEM images of the metallographic cross-sections using the following procedure: (1) an SEM image of each sample was obtained at the appropriate magnification; (2) the grayscale SEM image was enhanced using Adobe Photoshop to clearly identify the interfaces between the different layers and their pixels; and (3) the mean thickness (h IMC) of individual layers was calculated using the following equation:
 $${h_{{\rm{IMC}}}} = \left( {{{{N_{{\rm{IMC}}}}} \mathord{\left/ {\vphantom {{{N_{{\rm{IMC}}}}} {{N_{{\rm{SEM}}}}}}} \right. \kern-\nulldelimiterspace} {{N_{{\rm{SEM}}}}}}} \right) \times {h_{{\rm{SEM}}}}\quad ,$$
where h SEM is the actual height of the SEM image, and N IMC and N SEM are the number of pixels in the IMC layers and the entire SEM image, respectively. To increase the statistical reliability of the value obtained for the IMC layer thickness, dozens of SEM images that covered numerous grains in the middle of the interface were analyzed for each sample. The error of each IMC equivalent thickness was expressed through the standard deviation of the measured data.
III. RESULTS AND DISCUSSION
Figure 3 shows the relationship between the average thickness of dissolved Cu and the square root of time before and after the liquid structural transition at four temperatures (673, 723, 773, and 823 K) and five reaction times for each temperature (0.9, 1.8, 3.6, 7.2, and 18 ks). The dissolution amount clearly increased with the reaction time, and the dissolution rates of the copper rod increased remarkably with the temperature of the molten solders. More importantly, the linear trends in all cases, as shown in the figures, indicated that the dissolution kinetics of Cu into liquid Sn–Bi57 exhibited a diffusion-controlled process before and after the liquid structural transition.
Time dependence of the dissolved thickness of copper, h, at various temperatures: (a) before the liquid structural transition and (b) after the liquid structural transition.

The rate constant of dissolution was calculated from the relationship:
 $$h = k{t^{0.5}}\quad ,$$
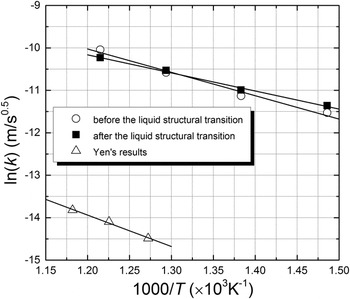
where h is the average thickness of dissolved copper, k is the rate constant, and t is the reaction time, as shown in Fig. 4. Evidently, the increase in k was dependent on temperature. The following formula was derived from the temperature dependence of the rate constant:
 $$k = {k_0}\,\exp \left[ { - {{{Q_{\rm{A}}}} \mathord{\left/ {\vphantom {{{Q_{\rm{A}}}} {\left( {RT} \right)}}} \right. \kern-\nulldelimiterspace} {\left( {RT} \right)}}} \right]\quad ,$$
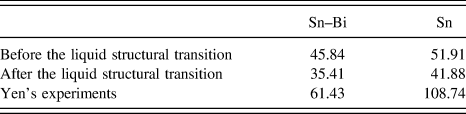
where k 0 is the pre-exponential factor, T is the absolute temperature, R is the gas constant, and Q A is the effective activation energy for this dissolution process. Figure 4 shows the Arrhenius plots of the dissolution rate constants before and after the liquid structural transition. A significant reduction in the slope of the lines was noted corresponding to the occurrence of the structural transition in the liquid tin–bismuth. The calculated Q A values of the effective activation energy decreased from 45.84 kJ/mol when dissolution was carried out before the liquid structural transition to 35.41 kJ/mol when dissolution occurred after the liquid structural transition.
Temperature dependence of dissolution rate constant for copper in liquid eutectic tin–bismuth before and after the liquid structural transition.

The dissolution rates of copper rod are significantly lower in Sn–Bi57 of the present study than those in pure Sn. Reference Qi, Ding and Zhou10 These results agreed with those presented by Yen et al., Reference Yen, Chou, Tseng, Lee and Hsu15 who also reported the dissolution kinetics of the copper wire in liquid Sn–Bi58 and pure Sn with time at three different temperatures. Figure 4 shows that the variation trend in the rate constant with temperature agreed with that of the Yen's results, Reference Yen, Chou, Tseng, Lee and Hsu15 except for a faster dissolution rate constant in the present study caused by larger diffusion areas.
Notably, the effective activation energies of the reactions of copper in liquid eutectic tin–bismuth were lower than those in pure liquid tin under the same conditions, as shown in Table I. This result indicated that the Cu substrate could more easily dissolve into the liquid Sn–Bi57 alloy than into liquid Sn. Many investigations Reference Feng, Wang and Morinaga16–Reference Kang, Xiu, Liu, Hui, Wang and Tong19 demonstrated that the growth of the IMC layer is accelerated in the Sn(s)/Cu(s) joint when a certain quantity of Bi is added to pure Sn. Thus, Bi did not participate directly in the reaction but somewhat served as a catalyst in the chemical reaction between liquid Sn and solid Cu.
Values of the effective activation energy (kJ/mol) of our experiments and the Yen's experiments Reference Yen, Chou, Tseng, Lee and Hsu15 for liquid eutectic tin–bismuth and liquid tin.

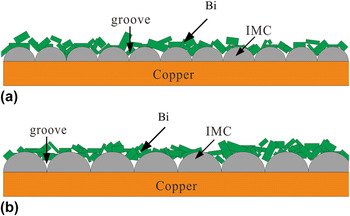
However, the decrease in dissolution rates induced by the addition of bismuth appeared to contradict the decreasing activation energy. Figure 5 schematically depicts the dissolution mechanism in Sn–Bi57/Cu. According to the Baker's study, Reference Baker20 Bi cannot react with Cu from their phase diagrams; hence, two processes occur during the dissolution of copper into the Sn–Bi57 solder. One is the inter-diffusion process, in which Cu atom diffusion is dominant in Sn–Cu inter-diffusion. The other is the interfacial reaction, in which IMC formation occurs by a chemical reaction between Sn and Cu at the interface of the Sn–Bi57/Cu interconnection. At the initial stage, Sn reacts with Cu to form IMCs in the Sn–Bi/Cu couple. Given that the Bi content of the Sn–Bi57 alloy is high and no interaction exists between Bi and Cu, an increasing amount of Bi remains on the surface of the IMC, thereby reducing the number of grooves that provide channels through which Cu atoms diffuse to the molten Sn–Bi57 solder (Fig. 5). Hence, the Sn–Bi57/Cu system exhibited a slow dissolution rate, but the effective activation energies of the reactions were low. In this paper, we focused on the effect of the liquid structural transition on the dissolution of solid Cu into liquid Sn–Bi57.
Model of dissolution mechanism in the tin–bismuth/copper system: (a) small IMCs, (b) large IMCs.

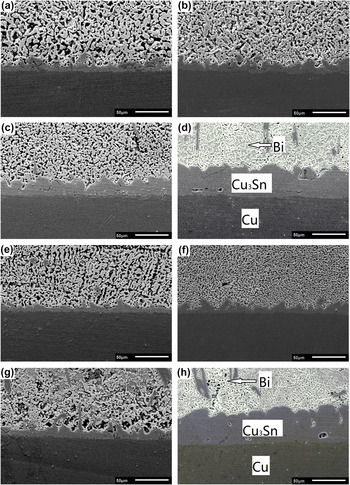
The enhancement of the dissolution of copper into liquid tin–bismuth as a result of the application of the liquid structural transition indicated the intrinsic effect of the liquid structure on convection. Figure 6 shows the SEM micrographs of the tin/copper interface of the copper substrate that reacted with the molten solders before and after the liquid structural transition at 673, 723, 773, and 823 K for 3.6 ks. At the solder/copper interface, copper reacted with tin atoms and formed the copper–tin IMCs. EDS analysis indicated that the IMCs comprised the Cu3Sn phases only at 673, 723, 773, and 823 K for all time periods. Similar to the investigations by Takaku et al. Reference Takaku, Liu, Ohnuma, Kainuma and Ishida21 and Yen et al., Reference Yen, Chou, Tseng, Lee and Hsu15 the dissolution mechanism in the present investigation was considered to be dominated by grain boundary diffusion. Figure 6 shows the many grooves or channels that exist within Cu3Sn, thereby allowing copper atoms to diffuse and dissolve into the molten solder. These grooves were the main channels through which copper atoms dissolved into molten tin. However, the reasons why the dissolution rates succeeding the liquid structural transition are faster than those prior remain to be explored.
SEM micrographs of the tin–bismuth/copper interface: (a), (b), (c) and (d) are before the liquid structural transition at at 673, 723, 773, and 823 K for 3.6 ks, respectively, and (e), (f), (g), and (h) are after the liquid structural transition at 673, 723, 773 and 823 K for 3.6 ks, respectively.

The investigations revealed that the solder/substrate interface morphologies or the microstructure of the IMCs may be responsible for the various dissolution rates in each reaction couple. Previous studies Reference Chen, Zu, Li, Ding, Chen and Zou22,Reference Li, Zhang, Zu, Lv, Zhao and Yang23 showed that the homogeneity of the structurally changed Cu–Sn melt inhibits the nucleation and growth of the primary phase and eventually refines the Cu6Sn5 or Cu3Sn phases. Similar to the formation of the primary phase during solidification caused by the liquid structural transition, the sizes of the Cu3Sn phase obtained after the liquid structural transition could be considered smaller than those sizes prior to liquid structural transition. This finding was confirmed by the size reduction of bismuth, as shown in Fig. 6. Figure 5 schematically depicts the dissolution mechanism in the tin–bismuth/copper interconnection. The small size of IMCs corresponded to a high density of grooves at the tin–bismuth/copper interface. In this case, the number of grooves per unit area was higher, and sufficient channels allowed Cu atoms to diffuse and dissolve into the molten tin–bismuth.
According to the binary alloy phase diagrams, the interfacial reaction between liquid tin and copper substrate can be described as
 $$3{\rm{C}}{{\rm{u}}_{\left( {\rm{s}} \right)}} + {\rm{S}}{{\rm{n}}_{\left( {\rm{l}} \right)}} \to {\rm{C}}{{\rm{u}}_3}{\rm{Sn}}\quad {\rm{.}}$$
According to the isothermal equation of a chemical reaction proposed by Lupis Reference Lupis24 :
 $$\Delta G = \Delta {G^0} + RT\,\ln {{{\alpha _{{\rm{C}}{{\rm{u}}_3}{\rm{Sn}}}}} \mathord{\left/ {\vphantom {{{\alpha _{{\rm{C}}{{\rm{u}}_3}{\rm{Sn}}}}} {\left( {{\alpha _{{\rm{Sn}}}}\mathop {{\alpha _{{\rm{Cu}}}}}\nolimits^3 } \right)}}} \right. \kern-\nulldelimiterspace} {\left( {{\alpha _{{\rm{Sn}}}}\mathop {{\alpha _{{\rm{Cu}}}}}\nolimits^3 } \right)}}\quad .$$
Furthermore, Cu3Sn is in the solid phase and can be obtained as follows:
 $${\alpha _{{\rm{C}}{{\rm{u}}_3}{\rm{Sn}}}} = 1,\quad {\alpha _{{\rm{Sn}}}} = {\gamma _{{\rm{Sn}}}}\left[ {{\rm{Sn}}} \right],\quad {\alpha _{{\rm{Cu}}}} = {\gamma _{{\rm{Cu}}}}\left[ {{\rm{Cu}}} \right]\quad .$$
From the above equations, the following formula can be derived:
 $$\Delta G = \Delta {G^0} + RT\,\ln {1 \mathord{\left/ {\vphantom {1 {\left( {{\gamma _{{\rm{Sn}}}}\left[ {{\rm{Sn}}} \right]\mathop {{\gamma _{{\rm{Cu}}}}}\nolimits^3 \left[ {{\rm{Cu}}} \right]} \right)}}} \right. \kern-\nulldelimiterspace} {\left( {{\gamma _{{\rm{Sn}}}}\left[ {{\rm{Sn}}} \right]\mathop {{\gamma _{{\rm{Cu}}}}}\nolimits^3 \left[ {{\rm{Cu}}} \right]} \right)}}\quad ,$$
where ΔG and ΔG
0 are the Gibbs function and standard Gibbs function of the molar reaction, respectively; R is the gas constant; T is the absolute temperature;
 ${\alpha _{{\rm{C}}{{\rm{u}}_3}{\rm{Sn}}}}$
, αSn, and αCu are the activities of Cu3Sn, liquid tin atom, and solid copper atom, respectively; γSn, γCu are the activity coefficients of tin atom and copper atom, respectively; and [Sn] and [Cu] are the concentrations of tin and copper atoms, respectively. In the present investigation, the values of γCu, [Sn], and [Cu] remained approximately constant. Therefore, in Eq. (7), the activity coefficient of the tin atom played an important role in the formation of Cu3Sn. According to the experimental results of Itami et al.
Reference Itami, Munejiri, Masaki, Aoki, Ishii, Kamiyama, Senda, Shimojo and Hoshino25
and Liu et al.,
Reference Liu, Li, Liang and Wu26
the size of tin clusters decreased after liquid structural transition. Sequentially, the amounts of free tin atoms increased, and the activity coefficients of the tin atom increased accordingly, resulting in a decrease of ΔG and a much easier reaction between the Cu and Sn atoms.
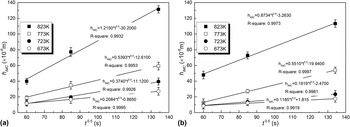
The formation of the compounds was believed to be commonly controlled by a chemical reaction, whereas their growth was thought to be controlled by diffusion as proposed by Abdelhadi and Ladani. Reference Abdelhadi and Ladani27 For the Sn–Bi57/Cu interconnection, Fig. 7 shows the curves of the average thickness of the IMCs versus the square root of aging time at 673, 723, 773, and 823 K. The average thickness of the IMC increased linearly with the square root of aging time at each temperature. This trend suggested that the growth of these IMC layers was a volume diffusion-controlled process. The slope of the curve could be regarded as the IMC growth rate. For the solder joints prior to the liquid structural transition, the slopes of the curves at 673, 723, 773, and 823 K were 0.21, 0.37, 0.54, and 1.22 μm/s0.5, respectively. The growth rate increased with increasing temperature. After the liquid structural transition, the IMC thickness of the solder joint also increased linearly with the square root of time at 673, 723, 773, and 823 K, respectively, as shown in Fig. 7. The slopes were 0.12, 0.19, 0.55, and 0.87 μm/s0.5, respectively. The growth rate of the IMCs was apparently inhibited by the liquid structural transition under the same reflow condition.
Time dependence of average thickness of IMCs layer, h IMC, at various temperatures: (a) before the liquid structural transition and (b) after the liquid structural transition.

For the solder joints, the IMCs developed linearly with the square root of time. From the temperature dependence of the rate constant of IMC growth, we obtained the following formula:
 $${k_{{\rm{IMC}}}}\,{\rm{ =\,\, }}{k_{{\rm{IMC0}}}}\,\exp \left[ {{{ - {Q_{{\rm{IMC}}}}} \mathord{\left/ {\vphantom {{ - {Q_{{\rm{IMC}}}}} {\left( {RT} \right)}}} \right. \kern-\nulldelimiterspace} {\left( {RT} \right)}}} \right]\quad ,$$
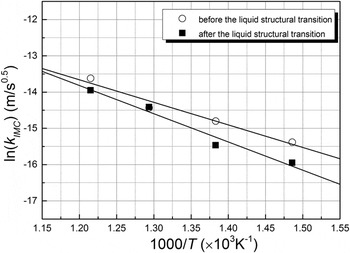
where k IMC is the growth rate of the IMCs, k IMC0 is the pre-exponential factor, T is the absolute temperature, and R is the gas constant. We calculated the apparent activation energy (Q IMC) for IMC growth from the slopes of curves of the thickness versus square root of aging time, as shown in Fig. 8. In the figure, the Arrhenius plots of the growth rate constant before and after the liquid structural transition were displayed. The apparent activation energy indicated the ease by which atoms diffused to form IMCs. The apparent activation energies for IMC growth were 51.26 and 64.51 kJ/mol before and after the liquid structural transition, respectively. The apparent activation energy of IMC growth after the liquid structural transition was clearly greater than that before the liquid structural transition.
Temperature dependence of growth rate for IMCs, k IMC, in liquid eutectic tin–bismuth before and after the liquid structural transition.

In liquid-state soldering, the thickness of the IMC layer has been proven to be determined by a combined process that includes the simultaneous dissolution and growth of IMCs. Reference Chada, Laub, Fournelle and Shangguan28–Reference Prakash and Sritharan30 Furthermore, the dissolution rate of the IMCs was proportional to the difference between the concentration of the liquid solder and the solubility of Cu at a given temperature, as indicated by the relationship proposed by Dybkov Reference Dybkov31 :
 $${{dc} \mathord{\left/ {\vphantom {{dc} {dt}}} \right. \kern-\nulldelimiterspace} {dt}} \,\propto\, {c_{\rm{S}}} - c\quad ,$$
where c S is the solubility of Cu in the liquid solder at the given temperature, c is the concentration of Cu in the liquid solder, t is the time, and dc/dt is the dissolution rate of the IMCs. As previously discussed, a greater driving force permitted the Cu atoms to diffuse from the Cu substrate through the IMC layer and its grain boundaries to the IMCs/solder interface because of a greater number of grain boundaries formed after the liquid structural transition. This phenomenon resulted in the rapid increase in Cu concentration of liquid solder after the liquid structural transition. Therefore, the dissolution rate of IMCs (dc/dt) also increased rapidly. The growth of the IMC layer was actually inhibited by the liquid structural transition, as shown in Fig. 8, which indicated that the dissolution of the IMC played a key role in intermetallic growth, and the apparent activation energy of IMC growth in liquid-state solders was enhanced by the structural transition of liquid solders.
IV. CONCLUSION
The dissolution kinetics of copper in liquid Sn–Bi57 solder was investigated under the influence of the liquid structural transition. The dissolution rate constant increased markedly with the application of the liquid structural transition, and the activation energy of dissolution decreased correspondingly from 45.84 kJ/mol to 35.41 kJ/mol. Simultaneously, the growth rate of the IMCs was inhibited by the liquid structural transition under the same reflow condition, and the apparent activation energy for IMC growth increased from 51.26 kJ/mol to 64.51 kJ/mol. Moreover, Bi was believed to serve two major roles at the tin–bismuth/copper interface. First, it promoted the chemical reaction as a catalyst. Second, it inhibited the growth rate of the IMCs because of its remaining high content on the IMC surface.
ACKNOWLEDGMENTS
This work is financially supported by the National Natural Science Foundation of China (Grant Nos 51101067 and 51301073) and the Natural Science Foundation of the Higher Education Institutions of Anhui Province (Grant No. KJ2015A098).