I. INTRODUCTION
The NiAl intermetallic compound is regarded to be the most promising candidates for high-temperature structural applications due to its extraordinary properties, such as high melting point, low density, high Young’s modulus, and excellent oxidation resistance at high temperatures. Reference Darolia1–Reference Javadi, Edris and Salehi6 Moreover, those excellent performances enable the NiAl intermetallic compound to become a potential material in relative sliding components, such as turbo chargers, cutting tools, and turbines. However, the poor ductility and toughness at ambient temperatures Reference Miracle7–Reference Whittenberger, Noebe, Joslin and Oliver9 and poor tribological properties at elevated temperatures Reference Liu, Wang, Gao and Jia5,Reference Shi, Wang, Zhai, Xu, Zhang and Chen10,Reference Zhu, Bi, Niu, Yang and Liu11 of NiAl intermetallic limited the engineering application. Many methods have been taken to improve the ambient temperature properties of the NiAl intermetallic compound, such as grain refinement, second-phase strengthening, alloying, and single crystal preparation. Recent research has found that the addition of alloy Cr, Mo, and Nb Reference Medvedeva, Gornostyrev, Kontsevoi and Freeman12–Reference Ferrandini, Araujo, Batista and Caram14 elements can form false eutectic organization to improve room temperature toughness and high temperature strength of the alloy. Guo et al. Reference Guo, Huai, Gao, Ren and Li15 have reported that the addition of Dy in NiAl–Cr (Mo)–Hf also gradually refines the eutectic alloy organization, and the effect of Ce, Mo, Nd on the alloy is similar to the influence of Dy. When the content of these elements is less than 0.1 wt%, the room temperature compression toughness and strength of the matrix alloy are improved with the increase of the addition amount. Adding the Ho element not only can refine the organization but also can generate a Ni2Al3Ho hexagonal close packed structure, Reference Guo, Sheng, Tian, Zhou and Ye16 so that the room temperature compressive strength increases with the increase of the Ho content, reaching a maximum value at 0.1 at.%, and room temperature compression toughness has the same trend. Moreover, Chen Reference Chen and Wang17 has prepared the NiAl matrix composites with TiC enhanced by a water-cooled copper laser melting process and found that the compression strength at above 1000 °C and the tensile strength at 980 °C are about 2 times of the NiAl intermetallic compound and the corresponding strength and fracture toughness at room temperature are also doubled. Reference Dercz, Pająk and Formanek18,Reference Yu, Dai, Xing, Li, Guo and Ye19 The yield strength of 2 vol.% TiB2 particle enhanced NiAl is nearly 1.5 times higher than that of the NiAl casting alloy under 760 °C, Reference Guo and Xing20 the improving degrees of its strength is proportional to the number of particles. The stress index of NiAl alloys with different contents of TiB2 is high, which means that the dislocation substructure is refined and stabilized by the second phase compared with the matrix. Therefore, adding the fine, hard, and evenly dispersed ceramic particulates into the nanocrystalline NiAl alloys seems to be an effective way to overcome the shortcomings. Reference Liu, Gao, Jia, Bai and Wang3
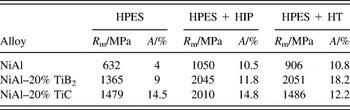
Guo et al. have investigated the room temperature compression properties of the pure NiAl and NiAl-matrix composite with 20 vol% TiC (or TiB2) fabricated by the different techniques, which included HPES (hot-pressing aided exothermic), HPES + HIP (hot isostatically pressed), and HPES + HT (heat treatment, at 1400 °C for 48 h). The compressive properties of NiAl-based composites prepared by different technologies were shown in Table I. Reference Guo and Xing20,Reference Xing, Han, Guo and Yu21 Unfortunately, for the NiAl-matrix composite reinforced by ceramic particulates, although the strength and the fracture strain of the NiAl have been improved to some extent, this still is limited in applicability. Reference Bochenek and Basista22 So it is necessary to investigate a simple and useful method for fabricating NiAl with high room temperature strength, good ductility, and excellent tribological properties at elevated temperatures.
RT compressive properties of NiAl-based composites prepared by different technologies. Reference Guo and Xing20,Reference Xing, Han, Guo and Yu21

Note: R m refers to the ultimate compression strength and A refers to the fracture strain.
Mechanical alloying (MA) has been as one of the most versatile methods for the synthesis of nanocrystalline intermetallic and composites. Reference Albiter, Salazar, Bedolla, Drew and Perez23–Reference Moshksar and Mirzaee25 The synthesis of nanocrystalline NiAl composites by MA has been reported in our lab previously. Reference Liu, Gao, Jia, Bai and Wang3,Reference Liu, Jia, Bai, Wang and Gao4 The niobium element has both solid solution strengthening, refining the organization, and can react easily with C, N, and H to in situ form compounds as strengthening second phase. Reference Ferrandini, Araujo, Batista and Caram14 In addition, niobium and silver in the atmospheric environment can react to form silver niobate as a high lubricant at high temperature. Reference Stone, Migas, Martini, Smith, Muratore and Voevodin26 In the present work, the NiAl–NbC–Ag composites were designed based on the hypothesis that Nb could improve mechanical properties of nanocrystalline NiAl composites prepared by mechanical alloying and hot-pressing sintering and Ag could promote tribological properties. In preparation process, Nb element has high chemical affinity with carbon to in situ form carbide ceramic particulates, while silver is a low temperature lubricant that can reduce the friction coefficient and wear rate below 500 °C and can react with a metallic oxide to form a double metallic alkoxide as a high temperature solid lubricant. The nanocrystalline NiAl–NbC–Ag powders were synthesized by mechanical alloying, and then the bulk nanocrystalline composites were fabricated by hot-pressing sintering at an appropriate temperature. The influence of Nb and Ag on the mechanical and tribological properties of the nanocrystalline NiAl alloy has been fully addressed.
II. MATERIALS AND METHODS
A. Materials and selection
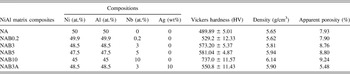
The NiAl–NbC–Ag nanocomposites were fabricated by mechanical alloying and vacuum-hot-pressing sintering (ZT-45-20Y, Chenhua Electric Furnace Corp., Shanghai, China). The starting materials of the composites matrix were commercially available nickel (58 μm, 99.6% purity), aluminum (48 μm, 99.95% purity), niobium (48 μm, 99.95% purity), and silver (25 μm, 99.95% purity) powders. The details about the composition of powders are given in Table II. Commercially available nickel, aluminum, and niobium were mixed to synthesize the composition of NiAl–Nb (at.%, NAB) using a high-energy-ball mill (Pulverisette P5, Fritsch Corp., Idar-Oberstein, Germany), the milling parameters are: 250 rpm, 70 h, zirconium dioxide balls, and ball-to-powder weight ratio 10:1. During the milling process, milling and pause were carried out alternately every one and a half hours. Then Ag (10 wt%) powders were added to NiAl–3Nb (90 wt%) to compose NiAl–3Nb–10Ag (NAB3A) and milled for 10 h. To reduce the cold welding effect during milling, the methanol about 5 mL was added to the mixed powder. The milled powders were enclosed in a graphite die (∅24 × 80 mm) to be cold compacted at a pressure of 10 MPa, and then the pressed specimen was sintered at 1300 °C for 30 min under the pressure of 25 MPa in a hot-press sintering furnace, accompanying with a heating rate of 10 °C/min at a dynamic vacuum of about 10−2 Pa, followed by furnace cooling.
Composition, density, microhardness, and apparent porosity of the sintered NiAl composites.

B. Mechanical and tribological test
The relative density of the bulk composites was measured by using a helium pycnometer (AccuPyc 1330, Micromeritics Int. Corp., Atlanta, Georgia) after calculating the volume. The apparent porosities of the sintered composites were calculated by the Archimedes method. The hardness measurements were assessed using an MH-5 Vickers microhardness instrument (Hengyi Corp., Shanghai, China) with a load of 500 g and a dwell time of 5 s. The measurements were carried out at least ten times, and the average values are shown in Table II. In addition, the powders average crystalline sizes calculated according to the Scherrer formula were shown in Table III. The compressive specimens are in a cylindrical size with a diameter of 5 mm and gauge length of 10 mm. Before the compressive properties test, all surfaces were mechanically ground with 800 grit emery paper. The compression tests were conducted on a WDW-200 microcomputer (Ruixiang Measurement Test Instrument Corp., Ruian, China) controlling an electronic universal testing machine in the air at the displacement rate of a testing machine of 1.67 × 10⁻⁶ m/s.
The crystalline sizes distribution of NiAl–Nb powders and sintered composite.

Note: Units “nm”; “…” presents the formation of the substance.
The friction and wear test of the NiAl composites were conducted on a UMT-3 ball-on-disk high-temperature tribotester (Bruker Corp., Madison, Wisconsin). The lower disk specimen was the sintered NiAl-base material with a size of ∅24 × 8 mm, and the specimens were polished by 800 grit emery paper, ultrasonically cleaned with acetone, and then dried in hot air prior to testing. The upper counterpart ball is a commercial Al2O3 ceramic ball with a diameter of 10 mm (HV 16.5 GPa, Ra 0.032 μm, ρ 3.92 g/cm3). The test temperatures of the friction and wear test were at RT, 300, 700, and 900 °C, the load was 20 N, the sliding speed was 0.105 m/s, and the testing time was 60 min. At the end of the test, the specimens were cooled to room temperature and the worn surface was cleaned using compressed N2 gas. To obtain the wear rate of the materials, the cross section profile of the worn surface was detected by a Nano Map 500LS contact surface mapping profiler (AEP Technology, Saratoga, California). The wear volume loss V is calculated as: V = AP, where A is the cross-sectional area of the worn scar and P is the perimeter of the worn scar. The wear rate is determined by the following formula: W = V/SL, where S is the sliding distance and L is the load and expressed as mm3/(N m). All the friction and wear tests were carried out at least three times to assure the reproducibility of the experimental results in the same conditions, and the average results were reported.
C. Characterization of the composites
The phase compositions of milled powders and sintered composites were identified by X-ray diffraction (XRD) on a Rigaku D/max-RB X-ray diffractometer (Rigaku Corp., Tokyo, Japan) utilizing Cu Kα radiation with 40 kV operating voltage and a scan speed of 10°/min in the 2θ range of 10–90°. The microstructure and morphologies of milled powders and bulk materials were examined by a scanning electron microscope (SEM; TESCAN-MIRAS, Tescan, Brno, Czech Republic) with energy dispersive spectroscopy (EDS). The composition variations of the worn surfaces were characterized by a Renishaw inVia micro-Raman spectroscope (Renishaw plc, London, United Kingdom) using a laser light with 532 nm wavelength.
III. RESULTS AND DISCUSSION
A. Microstructure, mechanical, and tribological properties of NiAl composites
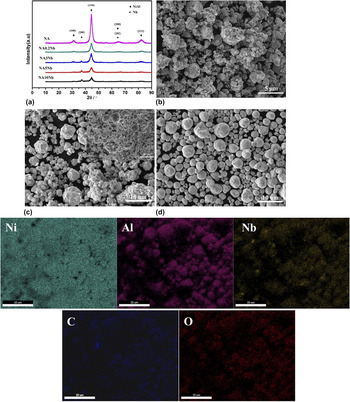
Figure 1 shows XRD patterns [Fig. 1(a)] and SEM images [Figs. 1(b)–1(d)] of the high-energy ball-milled NiAl–Nb powders as well as the EDS elements distribution maps of NiAl–3Nb powders. It can be found that the milled NiAl–Nb powders are composed of NiAl phase (JCPDS card 44-1188) and Nb phase (JCPDS card 34-0370). However, NiAl–0.2Nb powders consisted of only NiAl phase (JCPDS card 44-1188), which could be attributed to the very small partial solid solution of metallic Nb in the NiAl intermetallic compound. Reference Cotton, Noebe, Kaufman, Doralia, Lewandowski, Liu and Martin27 The appearance of superlattice diffraction peak (100) indicates that B2 ordered NiAl phase forms during the ball milling. Moreover, the diffraction peak intensity of metallic Nb increases with the increase of Nb contents. The mixture powders exhibit spherical or near-spherical and present aggregation to some extent [Figs. 1(b)–1(d)]. In combination with EDS analysis, it is demonstrated that C is present in the milled NiAl–Nb powders.
XRD patterns of (a) NiAl–Nb powders and SEM images of (b) NiAl powders (c) NiAl–3Nb powders (d) NiAl–10Nb powders as well as the EDS elements distribution maps of NiAl–3Nb powders.

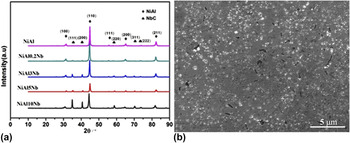
Figure 2 displays the XRD patterns and the SEM morphologies of the sintered NiAl–Nb composites. After sintering, the diffraction peak of Nb disappeared and the diffraction peaks of a new compound NbC (JCPDS card 35-0787) are observed [Fig. 2(a)]. The appearance of NbC diffraction peaks and disappearance of Nb diffraction peaks occurred simultaneously, which is speculated that the formation of the second phase NbC compound is derived from the high temperature solid-state reaction of Nb and C, where C comes from the methanol addition during the ball-milling process and the graphite mold during the sintering process. The microstructure of the NiAl–3NbC composites is relatively dense and NbC is uniformly distributed in the NiAl matrix [Fig. 2(b)]. Furthermore, according to Table III, the crystalline size of the sintered composites grows sharply from around 5 nm to about 20 nm after sintering and smaller, which is attributed to sintering temperature and time. Reference Mao, McMinn and Wu28 This is consistent with the reported results of that the crystalline size of NiAl–Mo2C changes from 30 to 100 nm after sintering at 1300 °C for 60 min Reference Liu, Gao, Jia, Bai and Wang3 and the crystalline size of NiAl can grow from 8 to 100 nm after sintering at 1000 °C for 2 h. Reference Guo, Zhou and Li29
XRD patterns of (a) NiAl composites and SEM images of (b) NiAl–3NbC composite.

It is clear from Table II that the density of the composites gradually increases with the increasing of Nb contents, due to the fact that the density of the Nb element is higher than that of the NiAl alloy. However, the NiAl–0.2Nb composite exhibits a slight lower density, which may be attributed to a very small solid solution of the Nb element. Reference Cotton, Noebe, Kaufman, Doralia, Lewandowski, Liu and Martin27 Though the density of the Ag element is higher than that of the Nb element, no gradually increase in density is observed for the Ag added specimen, which can be ascribed to a large partial solid solution of the Ag element in the NiAl alloy. Reference Cotton, Noebe, Kaufman, Doralia, Lewandowski, Liu and Martin27 The microhardness of NiAl–Nb composites increases with the increasing of Nb contents, which is mainly attributed to the hardness of the NbC phase formed in the sintered composites. In addition, along with the increase of Nb contents, the apparent porosity of sintered composites also increases.
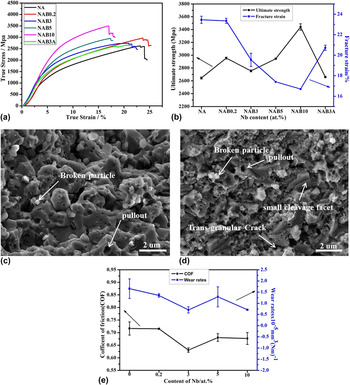
Figures 3(a) and 3(b) present the compressive properties of the NiAl–NbC composites with different Nb contents at room temperature and the NiAl–3NbC–10Ag composites. The ultimate strengths of the NiAl–NbC nanocomposites increased with the addition of Nb, which is due to second phase hardening effect of NbC precipitates in the NiAl matrix and the fine grain strengthening of NiAl phase. The crystalline sizes of NiAl–NbC nanocomposites are smaller than those reported by Dollar. Reference Miracle7 In addition, the second phase hardening effect of NbC precipitates and fine grain strengthening make the movement of the dislocations more difficult, which is accounted for the improvements in the mechanical properties. Reference Liu, Gao, Jia, Bai and Wang3 However, the compressive strains of the NiAl–NbC composite are lower in comparison with NiAl alloys, which may be owing to the existence of brittle NbC phases in the NiAl matrix as the existence of brittle phase may lead to the crack tip deflection and grain boundary weakening. Reference Liu, Gao, Jia, Bai and Wang3 It can be seen that the ultimate strength of NiAl–NbC–Ag has a slight decrease and the compressive strain of NiAl–NbC–Ag is improved, which are all ascribed to the existence of plastic deformation of the silver. The typical fracture morphology of NiAl and NiAl–3NbC composites was presented in Figs. 3(c) and 3(d). The fracture surfaces of the NiAl alloy display a typical inter-granular fracture mode. While the fracture surface of NiAl–3NbC composites is composed of a mixing fracture mode, i.e., inter-granular fracture and trans-granular fracture. The existence of small cleavage facets, pullout of hard phase particles, and broken particles was observed on the fracture surface of NiAl–3NbC composites.
Compression test results of NiAl–NbC composite and NiAl–NbC–Ag composite: strain–stress curves (a) ultimate strength and strain (b) and SEM micrographs of fracture surfaces of NiAl (c) and NiAl–3NbC composites (d) and the tribological properties of NiAl–NbC with different Nb contents (e).

Figure 3(e) shows the variation of the friction coefficient and wear rate of the NiAl–NbC composites with different Nb contents. The NiAl alloy holds the highest friction coefficient and wear rate of 0.71 and 2.09 × 10⁻⁵ mm3/(N m), respectively, and the NiAl–3NbC composites registered the minimum friction coefficient of 0.62 and the relatively lower wear rate of 0.70 × 10⁻⁵ mm3/(N m). So considering the deviation range and fluctuating data, the above variation can be neglected. The addition of Nb can improve the mechanical properties of the NiAl alloy, but there is little improvement on the tribological properties of the NiAl alloy.
B. Microstructure, mechanical, and tribological properties of NiAl–NbC–Ag composite
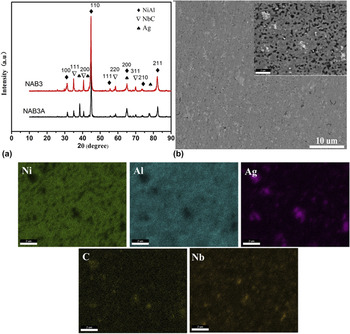
To further improve the tribological properties of the NiAl–3NbC composite at elevated temperatures, silver was added in the NiAl–3NbC composite. Figure 4 presents the XRD patterns and SEM image as well as the EDS elements distribution maps of NiAl–3NbC–10Ag composites. It can be seen that the diffraction peaks of metallic Ag clearly appeared in the XRD pattern [Fig. 4(a)], implying that the addition of Ag does not has react with any compositions of the matrix and remains single Ag phase in composites after hot-pressing sintering. The NiAl–3NbC–10Ag composites are relatively dense [Fig. 4(b)] which might be due to that metallic Ag was melted to form the liquid phase in the process of hot pressing sintering. It is easy to flow for the powder grain of viscous flow in the sintering process, which makes it easier for the grain contact and sintering. On the other hand, the liquid phase formed can fill in the holes in the sintering composites. Reference Liu and Jia30 The NiAl–3NbC–10Ag composites are composed of continuous gray phase, dispersed black phase, and light gray phase. Combined with an EDS analysis, it is demonstrated that the continuous gray phase is the NiAl phase, the dispersed black phase is the NbC phase, and the light gray phase is metallic Ag.
XRD patterns (a) and SEM images (b) as well as the EDS elements distribution maps of the sintered NiAl–3NbC–10Ag composites.

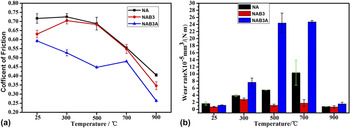
The tribological properties of NiAl-based composites sliding against the alumina balls over a temperature range from room temperature to 900 °C were shown in Figs. 5(a) and 5(b). The friction coefficient of NiAl and NiAl–3NbC composites increases first and then decreases when the temperature is above 300 °C but that of NiAl–3NbC–Ag composites decreases consecutively with temperature increasing except at 700 °C. NiAl and NiAl–3NbC composites exhibit high friction coefficient above 0.5 from room temperature to 700 °C and their friction coefficient decreases to 0.41 and 0.34 at 900 °C, respectively. The friction coefficient of the NiAl–3NbC–Ag composite is significantly lower than that of the NiAl and NiAl–3NbC composites at all test temperatures and registered the minimum value of 0.26 at 900 °C. The wear rates of NiAl-based composites at different temperatures are shown in Fig. 5(b). The wear rates of NiAl intermetallic increase first and then decrease when the temperature is above 700 °C. The NiAl-based composites exhibit more satisfactory wear resistance from room temperature to 900 °C and the wear rate maintained in an order of 0.684 × 10⁻⁵ ∼3 × 10⁻⁵ mm3/(N·m). While the wear rates of NiAl–3Nb–10Ag composites are higher than that of NiAl–3NbC composites at each test temperature, especially at 500 and 700 °C, which might be attributed to the composition variation of the tribolayers formed on worn surfaces of the composites at high temperatures.
The tribological properties of NiAl-based composites at elevated temperatures: (a) friction of coefficient and (b) wear rate.

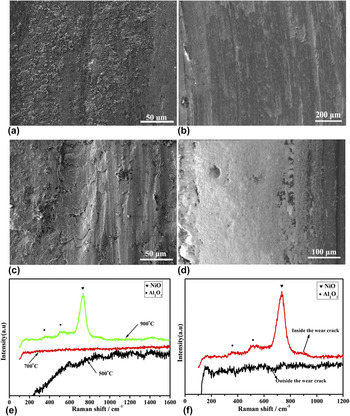
The worn surface morphologies of the NiAl intermetallic after wear testing at different temperatures are shown in Fig. 6. At room temperature, a larger amount of flakes and delamination pits are found on the worn surface, suggesting that the worn mechanism is dominated by adhesive wear [Fig. 6(a)]. Adhesive wear is the result of the direct contact of pin and disk, thus, the shearing of adhesive junctions produces wear particles and flakes when relative motion takes place. Reference Williams31 At 500 °C, there are some plow ditches and grazes parallel to the frictional direction, which imply that the wear mechanism is microcutting. At 700 °C, it can be seen that some plastic yielding parallel to the frictional direction, suggesting that the wear mechanism is plastic deformation and microcutting. At 900 °C, there is a lubricant film containing serious delamination pits and sight debris on the worn surface, indicating that the main wear mechanism is plastic deformation [Fig. 6(b)]. However, due to the high friction coefficient at 900 °C, the addition of suitable high-temperature lubricants is an effective way to minimize the friction coefficient at high temperature. Reference Stone, Migas, Martini, Smith, Muratore and Voevodin26,Reference Liu, Bai, Gao, Yi and Jia32 The phase composition of the worn surface of the NiAl intermetallic after wear tests is characterized by micro-Raman, as shown in Figs. 6(c) and 6(d). At 500 and 700 °C, there is no composition variation on worn surfaces of the NiAl nanocomposite, while a lubricant layer consisted of NiO Reference Loukil, Boukhachem, Ben Amor, Ghamnia and Raouadi33,Reference Mrabet, Ben Amor, Boukhachem, Amlouk and Manoubi34 and Al2O3 was formed on the worn surface at 900 °C, which results in the decrease of friction coefficient and wear rates.
The worn surface morphologies and composition of NiAl intermetallic after wear testing at different temperatures (a) room temperature, (b) 500 °C, (c) 700 °C, (d) 900 °C, (e) composition of inside of the wear track at 500, 700, and 900 °C, and (f) composition at 900 °C.

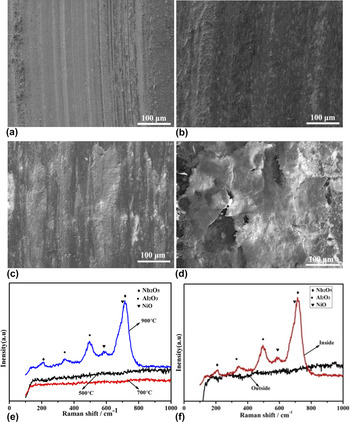
The morphologies and phase composition of the worn surface of the NiAl–3NbC nanocomposite after wear testing at different temperatures are shown in Fig. 7. At room temperature, the worn surface of the NiAl–3NbC composite appeared slight furrow parallel to the sliding direction and a little debris, indicating that the worn mechanism is dominated by plowing wear [Fig. 7(a)]. At 500 °C, large amounts of crack propagations and fractures are found on the worn surface, indicating that the worn mechanism is dominated by adhesive wear [Fig. 7(b)]. At 700 °C, mild abrasion and microfurrows existed on the wear surface, which indicates that the main wear mechanism is microfurrows [Fig. 7(c)]. When the temperature increases to 900 °C, it should be noted that a smooth lubricating film containing serious delamination pits is formed on the worn surface of the NiAl–3NbC composite during wear testing, demonstrating that the wear mechanism is dominated by plastic deformation and delamination [Fig. 7(d)]. The micro-Raman spectra give better insight into the variations of local phase composition on the worn surface. Reference Muratore, Bultman, Aouadi and Voevodin35 At 500 and 700 °C, there is no new substance on the worn surface, thus, the friction coefficient of the NiAl–3NbC composite is high [Fig. 7(e)]. At 900 °C, the lubricating film mainly consists of Nb2O5 and Al2O3 [Fig. 7(f)], which makes the friction coefficient and wear rate of the NiAl–3NbC composite to be sharply reduced. Thus, it can be deduced that the metallic oxide composition of the worn surface is beneficial from the improvement of the tribological properties of the NiAl–3NbC composite at high temperatures.
The worn surface morphologies and composition of NiAl–3NbC composites after wear testing at different temperatures (a) room temperature, (b) 500 °C, (c) 700 °C, (d) 900 °C, (e) composition of inside of the wear track at 500, 700, and 900 °C, and (f) composition at 900 °C.

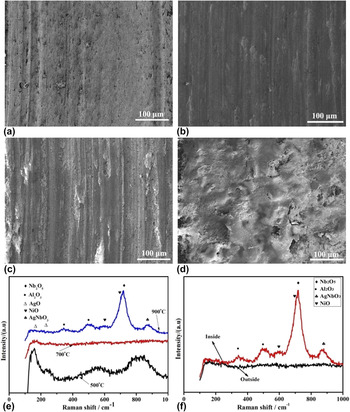
The SEM morphologies and phase composition of the worn surfaces of the NiAl–3NbC–Ag composites at different temperatures were shown in Fig. 8. At room temperature, shallow grooves and large amounts of wear debris particles can be seen on the worn surface, suggesting that the wear mechanism is dominated by abrasive wear [Fig. 8(a)]. At 500 °C, it is covered by a slight discontinuous lubrication layer and has slight scratches parallel to sliding direction, implying that the wear mechanism is mainly microplowing [Fig. 8(b)]. In addition, the wear rate of the NiAl–3NbC–Ag composite at 500 °C is higher, which can be attributed to two reasons. First, Young’s modulus of the NiAl alloy decreases as the temperature increases, Reference Yuan, Zhou, Li and Guo36 which can be inferred that the hardness of the NiAl–3NbC–10Ag composite will decrease with the increase in temperature. In addition, Archard derived a theoretical expression for the rate of adhesive wear, where he pointed out that the adhesive wear was inversely proportional to the hardness of the softer material. Reference Menezes, Nosonovsky, Ingole, Kailas and Lovell37 The increased ductility and a larger real area of contact caused by the soften material will result in stronger adhesion between the surfaces at a high temperature. However, as the temperature increases to 900 °C, some effective high-temperature lubricants on the worn surface will take effect, which eventually reduces the wear of the NiAl–3NbC–10Ag composite at this temperature. Second, Ag is an effective solid lubricant at the temperature below 300 °C. When the temperature exceeds 300 °C, Ag starts to be softened and diffused to the surface, then to be oxidized, and consumed, accompanying with serious plastic deformation at the temperature above 300 °C, which makes Ag lose lubricant efficacy and the structure of the composites incomplete, leading to a high wear rate at 500 °C. Reference Liu, Gao, Bai, Yi, Wang and Zeng38 At 700 °C, the worn surface is rough, and peeling of lubricant layer is obvious, which is attributed to the decomposition of the silver oxide and the breakdown of the lubricating films. Reference Liu and Jia30 The wear mechanism is mainly plastic deformation. When the test temperature is 900 °C, the lubrication films containing some large fragments and pits were formed on the worn surface, implying that the wear mechanisms are dominated by plastic deformation. At 500 °C, the micro-Raman spectrum of the NiAl–3NbC–Ag composite shows that the worn surface primarily consists of Ag2O lubricant phase [Fig. 8(e)]. At 700 °C, Raman peaks Ag2O disappeared, which can lead to the increase of friction coefficient and wear rates of the NiAl–3NbC–Ag composite. At 900 °C, the worn surface consists of AgNbO3, Reference Ju and Xu39 Al2O3, NiO, and Nb2O5 phases [Fig. 8(f)]. Silver niobate is well known as an excellent high temperature lubricant, Reference Stone, Migas, Martini, Smith, Muratore and Voevodin26 thus, the formation of the oxide film containing silver niobate on the worn surface is responsible for the decrease of friction coefficient and wear rate at high temperature.
The worn surface morphologies and composition of NiAl–3Nb–10Ag composites after wear testing at different temperatures (a) room temperature, (b) 500 °C, (c) 700 °C, (d) 900 °C, (e) composition of inside of the wear track at 500, 700, and 900 °C, and (f) composition at 900°.

IV. CONCLUSIONS
The NiAl–NbC–10Ag nanocomposites were fabricated by the powder metallurgy technique and the mechanical and tribological properties of the composites sliding against Al2O3 ceramic balls from room temperature to 900 °C were studied. The main conclusions can be drawn as follows:
-
(1) The NbC hard particles were generated in the sintering process, and the compression performance of the NiAl alloy at room temperature is significantly improved. At room temperature, the microhardness and compressive strengths of NiAl–Nb composites increase with the increasing of Nb content, which was attributed to second phase hardening effect of NbC precipitates in the NiAl matrix and the fine grain strengthening of NiAl phase.
-
(2) Ag does not react with any compositions of the matrix and remains single Ag phase in composites after hot-pressing sintering. The addition of Ag decreased the friction coefficient in low-mid temperature stage.
-
(3) At 900 °C, silver reacts with the matrix to form the high temperature solid lubricant AgNbO3 tribofilm, and the matrix itself reacts to form an oxide lubrication film, which leads to the decrease in the friction coefficient of the NiAl–3Nb–10Ag composites.
ACKNOWLEDGMENTS
The authors acknowledge the financial support by the National Natural Science Foundation of China (Grant Nos. 51471181, 51575505, and 51675508).