I. INTRODUCTION
Tungsten (W) thin films possess significant technological potential in several applications such as x-ray masks and mirrors, photonic crystals, field emitters, and MEMS devices due to their inherent properties and functional capabilities highly sought in a multitude of fields ranging from solid state physics to nuclear engineering. Reference Singh, Karabacak, Ye, Liu, Picu, Lu and Wang1 Sputter deposition is a favorable method for thin films due to its low cost, easy implementation, and scalability in industry. However, problems such as, fragmentation or delamination encountered in submicron thickness regimes limit effective implementation in applications necessitating high quality thin films and coatings. During the growth of sputter deposited thin films, intrinsic stress emerges as one of the main causes for the delamination or buckling depending on several deposition parameters such as substrate temperature and working gas pressure.
Structure zone model (SZM) for sputtered thin films has been currently considered as the most successful model to analyze those parameters. Reference Thornton2,Reference Thornton3 The dependence of film microstructure and intrinsic stress on deposition parameters have been explored systematically by several research groups in the following decades after SZM was first proposed. Reference Meyer, Klingner, Holz and Paufler4–Reference Windischmann7 According to SZM, higher working gas pressure causes tensile stress, however if pressure decreases, a transition from tensile to compressive stress takes place, resulting in a dramatically emerging dense thin film described as ‘Zone T’ in the SZM. Hence, to avoid mechanical drawbacks such as cracking, buckling, or delamination, it is necessary to control the amount of this growth stress. It has been shown that a strong correlation exists between reduced levels of residual stress and low density of thin films: Thornton et al. deposited thin films at high argon pressure which demonstrated almost zero residual stress. Reference Windischmann7,Reference Haghiri-Gosnet, Ladan, Mayeux and Launois8 Despite enhanced mechanical stability through residual stress mitigation, low density films revealed relatively poorer electrical properties as compared to their conventionally dense counterparts due to their porous and columnar structure. Reference Windischmann7,Reference Haghiri-Gosnet, Ladan, Mayeux and Launois8 The characteristic length scale associated with porosity present in various thin film samples grown under high working gas pressure was shown to be in the range from several Angstroms to several nanometers. Reference Yonezawa, Yamazaki and Kikuta9–Reference Messier, Giri and Roy11
From the film growth perspective, the main technical challenge with a deposition regime subject to tensile to compressive stress transition arises in the control of a stable working gas pressure (e.g., Ar) so that an optimal stress value and distribution can be achieved throughout the evolving film. This is a highly complicated task since the feasible working pressure window is too narrow, wherein the associated deposition dynamics cannot be kept stable easily. Karabacak et al. showed that compressive stress emerging in a thin film can be reduced through modulating the overall density within a thin film stack by sequentially combining low-density compliant layers with conventional dense layers. Reference Karabacak, Picu, Senkevich, Wang and Lu12,Reference Karabacak, Senkevich, Wang and Lu13 Thus, cumulative stress evolution of the entire film can be controlled in sputter deposited thin films by adjusting sputtering parameters such as the working pressure or flux specifically for each layer and thus forming a density modulated multilayer thin film structure comprising alternating layers of low and high density material depending on the porosity content. Mechanically, low-density layers with higher nano-scale porosity content are believed to be acting as compliant cushions between the denser layers deposited at much lower pressures. In multilayer thin films with submicron thickness for individual layers, theoretical predictions suggest that the presence of intermediate layers with more compliant elastic behavior can distort the continuity of the stress field within the stack through elastic mismatch at interfaces between neighboring layers of varying levels of porosity and thus lead to a sequentially capped stress profile instead of an uninterrupted monotonic increase experienced during uniform film growth. Reference Hutchinson14,Reference Ohring15
In addition, from a pure fracture mechanical perspective, density modulated thin film layers are expected to offer enhanced durability and fracture resistance due to their unique micro- and nanostructure. In contrast to uninterrupted coalescence of multiple cracks common to mechanically uniform thin films, fracture processes in density modulated submicron scale films are expected to become localized to sandwiched regions with higher density. Grain boundaries and subcritical voids in the elastic mismatch zone between adjacent layers of different porosity content could prevent the so-called tunnel cracking and thus provide an effective buffer for crack arrest. Reference Evans and Hutchinson16 Consequently, considering the overall compliance increase in thin film stacks owing to alternating sequence of low and high density individual layers, significant gains in delamination and buckling resistances are attainable. Taken together, these promising mechanical advantages of porous layers can provide significant benefits in many existing applications and implementations of the functional metallic thin film technology. However, as a first requirement in harnessing the potentials of thin film density modulation approach, correlations between the nanoscale porosity content and resulting elastic mechanical properties and yield behavior of these films should be understood thoroughly, so that all additional aspects of their mechanical behavior can be further elucidated.
In this work, we present results for mechanical properties and yield behavior of single-layer density modulated tungsten thin films that were fabricated using a magnetron sputter deposition system. Sputter deposition starts with small agglomeration of atoms and formation of islands, which is called nucleation. Due to the angular distribution of the incident flux of source atoms, islands of higher height capture the atoms approaching with more oblique angles, allowing them to grow faster compared to other neighboring surface sites that are being shadowed because of their shorter height. This so called “shadowing effect” results in the growth of columnar films, which is strongly related to the working gas pressure. Reference Petrov, Barna, Hultman and Greene17 This morphological phenomenon originates from the “mean free path” of sputtered source atoms, which defines the average distance they can travel without collision during superficial nucleation and growth events. Reference Smith18 Another important process during film deposition is the surface diffusion of atoms in which the atoms may move along the surface before they find a suitable place and join others to form clusters. In deposition systems, shadowing effect tends to increase the roughness while surface diffusion usually helps achieving smoother surfaces. However, it has been shown that shadowing effect generally dominates over surface diffusion effects. Reference Karabacak, Zhao, Wang and Lu19 During deposition, a highly localized residual stress field develops at tungsten films deposited at a low argon pressure. These high material density tungsten films cannot be grown typically thicker than couple of hundred nanometers, after which they peel off from the substrate. Reference Karabacak, Picu, Senkevich, Wang and Lu12,Reference Karabacak, Senkevich, Wang and Lu13 In contrast, few microns thick lower density single layer tungsten thin films can be grown at high argon pressure with close to zero residual stress. It was shown before that these films exhibit a columnar microstructure as predicted by the SZM. Reference Karabacak, Picu, Senkevich, Wang and Lu12,Reference Karabacak, Senkevich, Wang and Lu13
II. EXPERIMENTAL
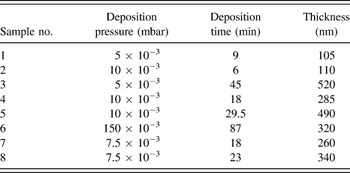
Tungsten thin film samples with submicron thickness values were prepared at different deposition pressures on Si wafer substrates. Pressure values ranging from 5 × 10⁻³ mbar to 150 × 10−3 mbar were applied together with varying deposition times to achieve different porosity values. Deposition conditions and resulting thicknesses of the samples investigated in this work are listed in Table I. Only single-layer thin films containing different levels of porosity were included in our experimental work and accompanying analytical discussion pertaining to mechanical properties since multilayer films with alternating layers of high and low density tungsten exhibit mechanical response inseparable from stress transfer phenomena occurring between individual layers, which will be the focus of a future study. It should be mentioned that in contrast to nanoporous metallic thin films synthesized through dealloying processes, Reference Liu and Antoniou20 for samples investigated in this study, introduction of nanoscale porosity to the resulting film structure was not achieved by a post-fabrication electrochemical removal of alloying species via an ionic electrolyte medium subjected to a potential. Instead, by imposing a high working gas pressure condition during sputter deposition, the extent of shadowing effects encountered by the sputtered flux was amplified to a nonequilibrium state in terms of deposition kinetics which would facilitate formation of nanoscale voids in the film as a direct consequence of the interplay between adsorption, clustering, and atomic surface migration events. Reference Singh, Karabacak, Ye, Liu, Picu, Lu and Wang1,Reference Thornton3,Reference Ren, Zou, Zhan and Huang10,Reference Messier, Giri and Roy11
Summary of experimental parameters used for the deposition of W thin films. The standard deviation associated with thickness measurements is 5%.

Amount of deposited materials in thin films are extremely low so that the mass measurement should be sensitive enough to be able to differentiate in nanogram scales. Quartz crystal microbalance (QCM) method was used in our system to measure the weight of the deposited layer and calculate the density of films. Both mass and density of a thin film sample with submicron thickness can be determined with sufficient experimental fidelity owing to high accuracy of the QCM technique. Reference Lu, Shun and Lewis21 Sauerbrey Equation is used to calculate the weight value of the deposited layer using the frequency change before and after the deposition as described by Lu et al. Reference Lu, Shun and Lewis21 An experimental error analysis was performed to determine the extent of errors associated with mass, film thickness, and deposition area measurements, which would in turn translate into experimental error with the calculated density and porosity content of investigated samples as these quantities were factored in within the equation used for density calculations. Because of the high fidelity and accuracy of the QCM technique and deposition area measurement, the error associated with the film thickness measurement emerged as the sole governing factor in error propagation affecting results reported in this study. Details of the QCM technique based mass calculation implemented for investigated samples can be found in a previous study by the authors. Reference Demirkan, Trahey and Karabacak22 The overall magnitude of error in calculated density and porosity content of investigated samples turned out to be around 5%, in direct agreement with the standard deviation encountered in the thickness measurement on scanning electron microscopy (SEM) images of nanoporous thin film samples fabricated by repetitively applying identical deposition parameters. Reference Demirkan, Trahey and Karabacak22
Instrumented nanoindentation tests were performed with samples containing porosity contents up to 70% to measure their reduced modulus (E r) and hardness (H) using the experimental procedure proposed by Oliver and Pharr. Reference Oliver and Pharr23 With the exception of the cold-pressed tungsten disc sample with regular density (i.e., zero porosity) obtained from Cleveland Tungsten Inc., all other samples tested through nanoindentation were grown on Si wafer substrates by the process described above. To avoid substrate effects as much as possible, experimental data were collected within a contact depth regime limited to the top 5–20% of the film height which corresponded to 25–100 nm for the thickest samples with around 500 nm thickness. To ensure that sufficient plasticity was introduced to the nanoindentation region in accordance with the axioms and derivations of the contact mechanics theory, Reference Fischer-Cripps24 the so-called Northstar diamond tip with a cube-corner geometry and around 40 nm tip radius of curvature was used in all nanoindentation tests except the cold pressed W disc sample. Nanoindentation tests of this sample were performed up to a contact depth of 200 nm with a standard Berkovich tip. The tip area functions used for calculation of H and E r for density modulated samples were derived by fitting nanoindentation data on standard fused quartz sample through residual minimization method applied to the function:
 $$A = {A_{{\rm{Cube\ corner}}}} + {C_1}{h_{\rm{c}}} + {C_2}h_{\rm{c}}^{{1 \mathord{\left/ {\vphantom {1 2}} \right. \kern-\nulldelimiterspace} 2}} + {C_3}h_{\rm{c}}^{{1 \mathord{\left/ {\vphantom {1 4}} \right. \kern-\nulldelimiterspace} 4}} + {C_4}h_{\rm{c}}^{{1 \mathord{\left/ {\vphantom {1 8}} \right. \kern-\nulldelimiterspace} 8}} + {C_5}h_{\rm{c}}^{{{\rm{1}} \mathord{\left/ {\vphantom {{\rm{1}} {{\rm{16}}}}} \right. \kern-\nulldelimiterspace} {{\rm{16}}}}}\quad ,$$
where h c is the contact depth and A Cube corner represents the area function with only a quadratic dependence on the contact depth through the relation:
 $${A_{{\rm{Cube\ corner}}}} = 2.598h_{\rm{c}}^2\quad .$$
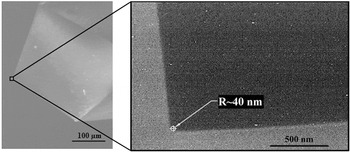
Equation (2) holds for an ideal cube-corner tip with perfect geometry only. The radius of curvature of the Northstar tip used for the nanoindentation experiments was also estimated through curve fitting based on shallow indents performed with a quartz standard. The tip radius of curvature obtained through this approach, approximately 44 nm, matched closely with the value provided by the manufacturer through transmission electron microscopy (TEM), shown in Fig. 1.
SEM image (left) and TEM micrograph (right) of the Northstar diamond tip with a cube-corner geometry and 40 nm tip radius of curvature.

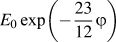
To determine the experimental correlation between the measured reduced modulus E r and the level of porosity φ, the following approach was used: The elastic modulus E f and Poisson's ratio νf for the investigated density modulated (i.e., nanoporous) tungsten thin film samples were predicted analytically based on the implementation of the differential effective medium approach (DEMA) proposed for the two-phase pore–solid composites. Reference Pal25 Values of E f and νf were calculated as a function of porosity φ according to 4 different models developed by Pal for a concentrated pore–solid composite, Table II, by treating the films as homogenous media whose mechanical properties change in an analytically smooth fashion through the successive addition of infinitesimally small quantities of pores until the final porosity level of interest is reached. Reference Pal25 The reduced modulus values were then calculated as a function of porosity for all 4 models based on the standard expression of the nanoindentation theory, which takes both the elastic response of the indenter and indented film into account:
 $${1 \over {{E_{\rm{r}}}\left( \varphi \right)}} = {{1 - \nu _{\rm{d}}^2} \over {{E_{\rm{d}}}}} + {{1 - \nu _{\rm{f}}^2\left( \varphi \right)} \over {{E_{\rm{f}}}\left( \varphi \right)}}\quad .$$
Models for the elastic modulus E f and Poisson's ratio νf as a function of porosity φ. Adapted from Ref. Reference Oliver and Pharr23. E 0 and ν0 are the elastic modulus and Poisson's ratio of the parent material without porosity. φmax is the maximum packing volume fraction of pores with spherical or near spherical morphology.

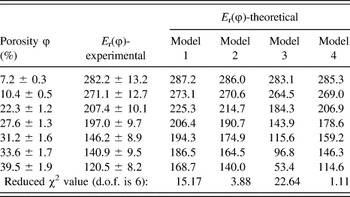
The elastic modulus E d and Poisson's ratio νd of diamond were used for the indenter properties, i.e., E d = 1141 GPa and νd = 0.07, Reference Chatterjee, Kumar, Abelson, Bellon and Polycarpou26 to predict the reduced modulus as a function of porosity φ present in the tungsten thin film. Theoretical values obtained by DEMA were compared with experimental measurements and a reduced χ2 analysis was carried out to evaluate the predictive quality of the models used in this study. Reference Meier and Zund27 Equations derived for the elastic modulus E f and Poisson's ratio νf as a function of porosity φ according to 4 different models formulated by Pal are given in Table II. A detailed discussion concerning the value of the maximum packing volume fraction of pores with spherical or near spherical morphology, φmax is provided in the Results and Discussion Section of this paper. It should be noted that prior to our study, the first order Riemannian integration based mathematical derivation scheme was already successfully implemented by Pal for obtaining analytical expressions predicting the elastic mechanical properties of pore–solid composite materials utilizing the initial condition for fully dense materials (i.e., the limit as φ → 0). Reference Pal25
Pal's method represents an extension of Bruggeman's DEMA-based original derivation for the dielectric constant of a solid-in-liquid suspension into the solid mechanics domain since in both cases the state variables were treated a priori as analytically tractable elements, whose accumulative change with respect to a known initial state of the parent material altered the constitutive response of the investigated material system. Reference Pal25 For the sake of conciseness, the underlying assumptions and physical implications of used analytical modifications used in the derivation process of every single one of the 4 models by Pal were omitted in this paper. In contrast to Pal's assumption imposing the incompressibility of the parent medium (i.e., ν0 = νf(φ = 0) = ½), which is not applicable to any practical thin film material, in our analysis the Poisson's ratio was derived as a function of the porosity φ per se. In this derivation, no additional assumption other than the well-known physical range dictated by continuum mechanics, i.e., −1 ≤ ν0 ≤ ½, was made concerning the value taken by the parent medium's Poisson's ratio ν0 in an absolutely porosity free state. To gain insight into the theoretical background of DEMA and its unique utility in modeling the porosity dependence of elastic behavior of a large spectrum of engineering materials in general, the reader is advised to consider the excellent paper by Pal Reference Pal25 and the references mentioned therein.
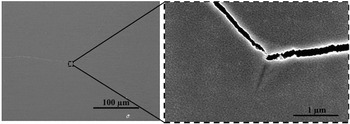
It should be noted that, as an experimental peculiarity, nanoindentation induced cracking was observed only during the initial tests with the 520 nm thick monolithic W film sample, which had around 10% porosity. This localized cracking behavior stemming from the indent site, Fig. 2, was attributed to high residual stress in the deposited W film layer and died down completely after a couple of indents due to dissipation of available strain energy through extensive cracking reaching the boundaries of the sample. To ensure that the reported reduced modulus and hardness data are not affected by this phenomenon, only the results of those tests conducted at least 50 µm away from a crack front were used in this study. Post-residual-stress-release indentation sites on this particular sample were also checked after each test in the scanning probe microscopy mode of the nanoindenter for the presence of any cracking. No sign of nanoindentation induced successive cracking could be detected after the initial very few (i.e., 2–3) indents.
Nanoindentation induced cracking was observed during the initial tests with the W film (Sample 1) with 7% porosity. Spontaneous crack propagation (left) reaching the boundaries of the sample followed the crack initiation originating from the edges of the chevron shaped imprint of the Northstar tip (right). Residual growth stress in the sample got completely released through this kind of cracking.

III. RESULTS AND DISCUSSION
A. Morphological characteristics of density modulated tungsten thin films
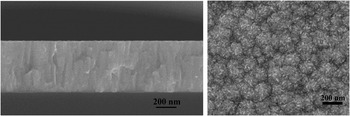
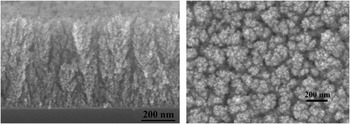
Single layer thin film samples, whose deposition parameters were given in Table I, were grown on Si substrates using a DC magnetron sputter deposition technique and their SEM images were taken along the edges to measure their thickness. As seen in the cross-sectional images in Figs. 3 and 4 (left), low-density films exhibited a more pronounced columnar structure than high-density films, as expected. Top-view SEM images shown in Figs. 3 and 4 (right) confirmed that the low density films are more porous and rougher than their high density counterparts. The density values for the investigated samples were measured using the QCM method. Samples deposited at low pressure (i.e., 5 × 10⁻³ mbar) were expected to have density values closest to that of conventional fully-dense tungsten, i.e., 19.25–19.35 g/cm3, reported for the only stable crystal structure of tungsten, the α-W, which is a BCC lattice of space group
 $O_{\rm{h}}^9 - Im3m$
,
Reference Lassner and Schubert28
since growth dynamics favored minimal porosity in these films.
Reference Shih, Smith and Crow29
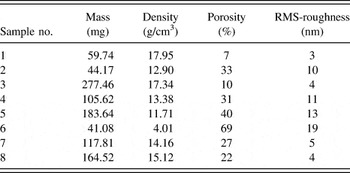
The density values calculated based on the mass measurements via QCM method were tabulated in Table III with the same order as in Table I for the investigated samples.
Cross-sectional (left) and top view (right) SEM images of a tested single-layer high density tungsten film Sample 3 on Si substrate. Scale bars are 200 nm.

Cross-sectional (left) and top view (right) SEM images of a single-layer low density tungsten film Sample 5 on Si substrate. Scale bars are 200 nm.

Mass and density values of W film samples measured by QCM method. Roughness values obtained by AFM. Error analysis indicates the potential extent of accumulative experimental error to be around 5% for density and porosity values reported here.

It should be noted that the porosity value for Sample #6 was determined by considering the densities of both tungsten (W) and tungsten trioxide (WO3). Nanoscale crystallinity and the presence of a dense grain boundary (GB) network have already been shown to result in accelerated atmospheric oxidation through intragranular diffusion in other metallic thin films and nanostructures. Reference Ohring15,Reference Bernardini, Beke, Knauth and Schoonman30,Reference Ozkan, Shaddock, Lipkin and Chasiotis31 In the specific case of nanoporous W, porosity facilitated formation of a dense GB network by preventing grain growth and coalescence during film growth which in turn rendered the conformal native oxide superstructure of W ineffective for passivation of atmospheric oxygen and resulted in rapid oxidation into tungsten's only stable oxide at room temperature, i.e., WO3. Reference Chatterjee, Kumar, Abelson, Bellon and Polycarpou26,Reference Warren, Nylund and Olefjord32
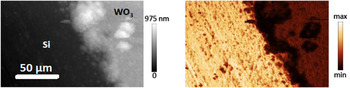
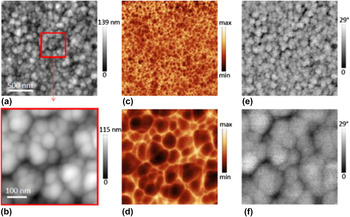
Complete oxidation of W into WO3 without any apparent rate limiting step as a direct consequence of high level nano-scale porosity of Sample 6 was verified through mid-infrared (MIR) near-field measurements of the oxidized thin film layer on Si substrate. To enhance the contrast, some portion of the film was scraped off so that the Si substrate was also exposed together with the oxide before the neaSNOM imaging, whose operating principle is explained by Huth et al. Reference Huth, Schnell, Wittborn, Ocelic and Hillenbrand33 Topography and optical amplitude images of Si substrate and WO3 layer acquired at an illumination frequency of 936 cm−1 are shown in Fig. 5. The near-field optical amplitude measured on WO3 layer showed weaker intensity compared to the Si substrate as expected. Furthermore, through localized imaging on the oxide layer as shown in Fig. 6, a strong optical phase contrast was detected which was attributed to W6+=O stretching mode observed within a frequency range around 945–950 cm−1 with thin films deposited directly as WO3 without undergoing a high-level nanoscale porosity driven oxidation from W into WO3 under ambient conditions. Reference Li, Hsieh, Hung and Huang34
Topography (left) and optical amplitude (right) images of the Si substrate and WO3 layer obtained with MIR imaging at an illumination frequency of 936 cm−1. Scale for the z-height is given as an intensity profile with pure white corresponding to 975 nm. On the scan plane, the scale bar corresponds to 50 µm.

Localized topography (a and b), optical amplitude (c and d) and optical phase (e and f) images of the WO3 layer. The strong optical phase contrast at an illumination frequency of 936 cm−1 was attributed to W6+=O stretching mode of WO3.

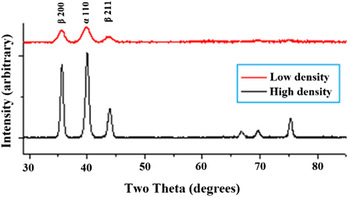
X-ray diffraction (XRD) analysis on tungsten films was performed to study the crystallinity of the samples deposited on Si substrates. According to the XRD profiles of Samples #1 and #2 given in Fig. 7, the narrower 2θ peak at around 40° for the high density Sample #1 with the smallest porosity content of 7% implies that the crystallites of the high density films are bigger than those in low density films, such as Sample #2 with a porosity content of 33%. The peak widening and magnitude attenuation phenomena observed in the XRD profiles of lower density films can be attributed to grain growth and merger inhibiting effect of porous domains as these would conceivably act as geometric impediments against interactions between individual crystallites forming during film deposition. These results agreed with previous observations reported by Karabacak et al., Reference Karabacak, Picu, Senkevich, Wang and Lu12 where high density W films deposited at similar experimental conditions exhibited good crystalline behavior with clearly defined sharp XRD peaks.

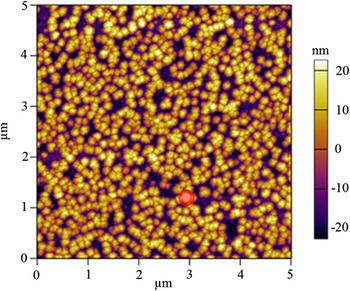
The root-mean-square (RMS) roughness values for the investigated samples were determined with an Asylum MFP-3D-SA AFM (Asylum Research, Santa Barbara, CA). As shown in Fig. 8, 5 µm × 5 µm area scans were collected and analyzed with the Gwyddion software by using only the height data within the unmasked scan area to eliminate the influence of defects or contaminants on the roughness calculation. RMS roughness values calculated for the entire scan area and rounded up to the closest integer value were included in the last column of Table III. The general trend for these RMS roughness values indicates that increasing porosity content up to 40% resulted in a nonmonotonic linear increase in roughness. For the sample with 69% porosity content, transformation of W into WO3 did not result in marked roughening, as the extrapolation of the linear trend present in the sample set up to the 40% porosity level remained within the proximity (i.e., less than 10% difference) of the RMS roughness value obtained through AFM measurements.
Height image generated with Asylum MFP-3D-SA AFM for the Sample 4 with 31% porosity. RMS roughness for the entire unmasked area was calculated as 11 nm. The red region near the coordinates (3,1) is the mask whose height data were excluded from the roughness calculation.

B. Nanomechanical properties as a function of porosity
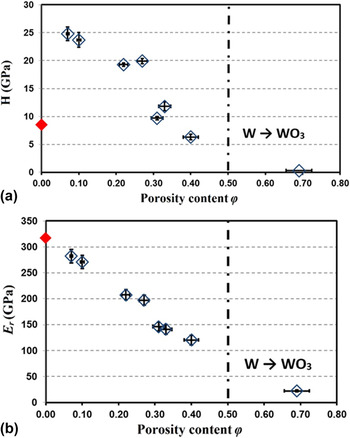
Experimental values of hardness and reduced modulus obtained for single layer density-modulated nanoporous W thin film samples were plotted as a function of porosity content in Figs. 9(a) and 9(b), respectively. Hardness and reduced modulus values measured for the fully dense (φ = 0) W disc sample by Cleveland Tungsten Inc. and Sample #6 which underwent complete oxidation into WO3 under ambient conditions due to its high level of initial porosity were also included in these figures for comparison purposes. Although the measured reduced modulus value of the fully dense W disc sample (indicated with a marker on the y-axis) agreed with the general trend present among density modulated samples, its hardness was significantly lower than those of density modulated thin film samples with low porosity content, i.e., φ < 0.1, and close to the values measured for samples with a porosity content φ in the 0.3–0.4 range. This significant deviation observed in the value of the hardness for the fully dense cold pressed tungsten disc was attributed to microstructural differences such as grain size and dislocation density of this sample, as compared to the thin film samples grown with sputter deposition. A detailed analysis concerning the correlations between hardness, yield strength, elastic modulus, and porosity content of sputter deposited W thin film samples investigated in this study are provided at the end of this section. The presence of a well-defined trend in terms of the correlation between reduced modulus values and the amount of porosity for all samples including the bulk scale W disc revealed that the elastic response remained as a generalizable function of the level of porosity.
(a) Hardness H, (b) reduced modulus E r values of W thin film samples with different porosity content. Fully dense (i.e., zero porosity) W disc sample designated with a marker on the y-axis and the sample which underwent complete oxidation into WO3 (φ = 0.69) are also included in these plots for comparison purposes. The dash-dot demarcation line indicates the spontaneous conversion of W into WO3. The error bars for porosity content correspond to 5% which is based on the standard deviation in thickness measurements.

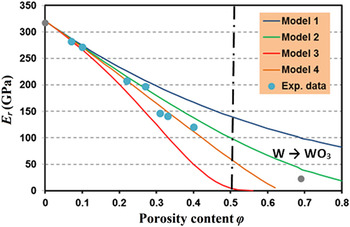
Theoretically predicted reduced modulus values, E r(φ), calculated based on Eq. (3) using the 4 separate models summarized in Table II for the porosity dependent elastic modulus E f(φ) and Poisson's ratio νf(φ) of the density modulated tungsten film, are shown in Fig. 10 as color coded curves along with the experimental measurements obtained through nanoindentation tests. It should be noted that Eq. (3) is applicable for the specific case of density modulated W thin films due to the complete fulfillment of all its underlying assumptions concerning material isotropy, homogeneity and linear elastic behavior. Among all metals, tungsten is unique due to its Zener anisotropy ratio: Its value, 1.01, Reference Bower35 is almost equal to unity and this attribute peculiar to W ensures that the material isotropy condition required for the applicability of Eq. (3) is perfectly satisfied regardless of the extent of crystallographic orientation differences among the individual nanoscale grains in terms of the intrinsic material response.
Reduced modulus E r(φ) versus porosity content of the density modulated tungsten films: Comparison between the models (Table II) and the experimental data. Demarcation line depicting spontaneous conversion of density modulated W thin film into WO3 under ambient conditions is placed in the proximity of φ ≈ 0.5 since this is the porosity level nulling the Poisson's ratio according to Model 4, which appeared to be the most descriptive one for high porosity contents, i.e., φ > 0.3.

The most important caveat to this argument is the morphological component of the anisotropic or transversely isotropic mechanical response observed in nanoporous metallic thin films fabricated through dealloying approach. Reference Liu and Antoniou20,Reference Li and Antoniou36 As expressed before, because of the high working gas pressure condition and associated shadowing effect with the sputtered flux, in contrast to dealloyed metallic thin films with characteristic pore sizes of tens of nanometers, the pores in the particular case of density modulated metallic thin films are limited to a few nanometers and below, down to the atomic size scale. Reference Yonezawa, Yamazaki and Kikuta9–Reference Messier, Giri and Roy11 Although a homogeneous distribution of these nanoscale pores is expected in the through thickness direction of the film because of uniform adsorption kinetics governing the incident flux during deposition, the shadowing effects might lead to larger clustering of pores in the transverse direction, which can indeed beget a branched out morphology clearly visible in the cross-sectional close-up SEM images of high porosity films such as the one shown on Fig. 4. Conceivably, the validity of isotropic mechanical response assumption based on the Zener anisotropy ratio of bulk tungsten would diminish with increasing levels of porosity. In our nanoindentation experiments, no slope change was encountered in either loading or unloading segments of the force versus indentation depth curves generated for the entire set of W samples other than the ones which underwent spontaneous conversion into WO3. This observation together with the well-known homogenizing effect Reference Messier, Giri and Roy11 of film growth kinetics in the thickness direction indicate that experimental elastic modulus data were indeed qualified for a subsequent analysis for the correlation between porosity content and through thickness elastic properties. On the other hand, the true extent of a potential deviation of a sputter deposited nanoporous tungsten thin film's response from the isotropic case as a consequence of internal morphology change at increasing porosity levels should be scrutinized through future studies focusing particularly on tribological properties for a deeper understanding of nanoporous metallic thin film behavior.
The predictive quality of each model used for the calculation of the theoretically expected reduced modulus, E r, was assessed by means of the reduced χ2 analysis. The values of the reduced χ2 obtained for each model were tabulated in the last row of Table IV. The goodness of the fit based on Model 4 was the best among these DEMA based models for the dependence of elastic constants on the level of porosity. A reduced χ2 close to 1 indicates excellent descriptive capability for an analytical model, which tries to reflect the nature of a physical correlation without resorting to phenomenological fit parameters in the broad mathematical modeling sense. Reference Pal25 The form of the differential element can make a significant difference in determining the rate of change of elastic properties with increasing amounts of porosity. In the derivations leading to Models 3 and 4, Pal explained that Models 1 and 2 do not contain any physical insight related to the so-called “crowding effect” of pores at increasing values of porosity φ. Reference Oliver and Pharr23 According to our experimental values and accompanying reduced χ2 analysis for density modulated W thin films though, Model 2 still performed a lot better than both Model 1 and Model 3 and was slightly worse than Model 4. In fact, Model 3 which is derived based on Mooney's formulation for the incremental change in the volume fraction of the pores, Reference Oliver and Pharr23 d[φ/(1 − (φ/φm))], turned out to be the worst in terms of its reduced χ2 value when increasing amounts of new pores are introduced to the existing pore–solid composite system. The mismatch between Model 3 based theoretical estimates and actual experimental measurements increased significantly, as porosity φ exceeded 10%. This trend can be attributed to the definition of the differential operator for Model 3, which contains the volume fraction of the solid part of the pore–solid system, namely the expression 1 − (φ/φm) within the differential and hence amplifies the net effect of the porosity change in an unbounded way: As φ → φm d(f(φ)) → ∞.
Results of the reduced χ2 analysis for the nanoindentation tests of density modulated W thin films with different porosity levels. Degree of freedom used to reduce the χ2 was 6 since the equation of each model containing fixed parameters E 0, ν0 and φmax acted as the only constraint.

On the other hand, a physical lower bound for the differential operator of Model 3 exists simply because as φ → 0 d(f(φ)) → 0. Consequently, as can be verified with Table II, the expressions for E f(φ) and νf(φ) based on Model 3 reduce to those of Model 1 in the limit φ → 0. Krieger and Dougherty realized the problem with the unbounded change of the differential operator of Model 3 and suggested dφ/(1 − φ/φm) instead of d[φ/(1 − (φ/φm))], so that the denominator 1 − φ/φm can be integrated independently from the differential operator as φ → φm. Reference Oliver and Pharr23 The expressions for E f(φ) and νf(φ) resulting from this integration constitute the Model 4, which provided the best fit according to the reduced χ2 analysis whose results are given in Table IV.
To assess the contribution of the maximum packing volume fraction of pores φm to the value of the reduced χ2 for Model 4, it is taken as an adjustable parameter within the interval 0.4 ≤ φm ≤ 0.8, and a separate reduced χ2 analysis was carried out for each value of φm. The results of this approach are shown in Fig. 11. It should be noted that since φm was converted into an adjustable parameter, the degree of freedom to reduce the χ2 value diminished by one,
Reference Pal25
which in turn resulted in slightly higher reduced χ2 values as compared to before. To make this change clear, the reduced χ2 values obtained by keeping the degree of freedom the same as the analysis presented in Table IV, were also included. Figure 11 shows that regardless the degree of freedom used to reduce the χ2 values of Model 4, the value 0.643 for the maximum packing volume fraction of pores φm minimizes the reduced χ2. The maximum packing volume fraction of pores, φm, in 3D is taken as 0.637 for random close packing of monosized spherical inclusions in the model by Pal
Reference Oliver and Pharr23
and the result of our reduced χ2 minimization analysis for Model 4 with φm as an adjustable parameter indicates that this value is indeed very close to the best fit parameter,
 ${\varphi _{{\rm{m@}}{\chi ^2}{\rm{ \hbox- min}}}} = 0.643$
, of our experimental data.
Reduced χ2 versus the maximum packing volume fraction of pores φm using Model 4. The location of the global minimum in the 0 ≤ φm ≤ 1 range is indicated with the black dashed line. The numerical value of this reduced χ2 minimizer
 ${\varphi _{{\rm{m@}}{\chi ^{\rm{2}}}{\rm{ \hbox- min}}}}$
was 0.643.

As can be seen from Fig. 11 the variation in reduced χ2 between these two values of φm is less than 1% for both cases with either 5 or 6 degrees of freedom. This result clearly underlines the applicability of the φm value determined for random close packing of monosized spherical inclusions in the particular case of density modulated W thin films. It also points out that the governing mechanisms which control formation of pores during nucleation and planar atomic diffusion processes, e.g., length of diffusion path and momentum distribution of impinging particles, generally favor a random close packing while shadowing effects that govern vertical growth processes and hence overall geometry definition of the thin film layer are known to be subject to more deterministic process parameters, such as the incident flux angle and the deposition rate. Reference Messier, Giri and Roy11,Reference Jensen and Brett37
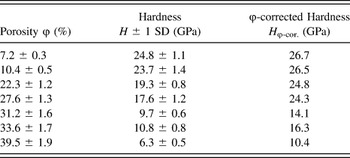
Hardness values of density modulated tungsten film specimens were also analyzed since significant changes were expected in the yield behavior of thin films with increasing levels of porosity. Reference Ding, Zhang and Vajtai38,Reference Wang39 Average hardness and one standard deviation values calculated for the whole sample set are provided in Table V. Following the approach by Ma et al. Reference Ma, Wang, Wood, Zekonyte, Luo and Walsh40 and Huber et al., Reference Huber, Viswanath, Mameka, Markmann and Weissmuller41 porosity corrected hardness, H φ-cor., values were determined by normalizing the experimental hardness values for each sample by the volume fraction of its solid constituents, i.e., H φ-cor. = H/(1 − φ). It should be noted that to reduce surface effects related broadening in the standard deviations, for each sample only the particular segment of the collected data corresponding to contact depths exceeding 10 nm was used for averaging. The quantitative relationship between hardness, elastic modulus, Poisson's ratio, and yield strength is of great interest to the contact mechanics and mechanics of materials communities and to the best of our knowledge, no definitive formulation exists to date which is directly applicable to porous thin film media. For this reason, prior to discussing the details of yield behavior (Fig 12.), we put our experimental hardness measurements into perspective relying on the combination of Johnson's original formulation, Reference Johnson42 with the DEMA based Model 4, Reference Pal25 which yielded successful results in terms of the reduced modulus as discussed before.
Average hardness H and porosity corrected hardness H φ-cor. for density modulated tungsten film samples with different porosity levels. Experimental values of hardness H are indicated along with one standard deviation.

Yield strength values calculated for increasing porosity content by plugging experimental hardness and porosity corrected hardness values in Table V into the models: (a) by Johnson, Reference Wang39 (b) Lee et al. Reference Ma, Wang, Wood, Zekonyte, Luo and Walsh40 Although yield strength values obtained for experimental hardness values exhibit a decreasing trend with increasing porosity according to both models, a definitive drop occurs for porosity corrected yield strength values after a similar threshold in both cases which is attributed to increased slenderness of load bearing ‘ligaments’ within the nanoporous thin film. In both figures the solid dots represent porosity corrected yield strength values and hollow diamonds stand for yield strength values determined based on experimental hardness measurements.

Johnson proposed one of the most widely used models for relating elastic properties to yielding within the indentation region by applying the expanding cavity concept to the onset of plastic deformation of the elastoplastic test material. Reference Johnson42 Johnson's original formulation for the relationship between hardness H, elastic modulus E, Poisson's ratio ν, and yield strength Y of a homogenous elastoplastic material is expressed as
 $$H = {{2Y} \over 3}\left( {2 + \ln \left[ {{{{E \over {Y\,\tan \,\alpha }} + 4\left( {1 - 2\nu } \right)} \over {6\left( {1 - \nu } \right)}}} \right]} \right)\quad .$$
In Johnson's analysis, this formulation was further simplified by assuming incompressibility for the indented homogenous elastoplastic material, i.e., ν = 1/2. Here since the value of the Poisson's ratio varies as a function of porosity present within density modulated W thin film, we didn't resort to any simplifications and used the formulation in Eq. (4) as it is, where porosity dependent elastic parameters E and ν were determined based on Model 4 in Table II with φmax = 0.637. Reference Oliver and Pharr23 α in Eq. (4) stands for the cone angle of the nanoindenter tip. The underlying assumption in Johnson's formulation Reference Wang39 concerning the geometric self-similarity of the indenter tip during elastic–plastic indentation is also present in our experiments along the central symmetry axis matching with the nanoindentation axis but rather than having a constant cone angle as in the case of conical tips, this particular angle varies continuously between 35.3° and 54.7° on all 3 facets of the cube-corner shaped Northstar tip. To account for this difference, the parameter tan α in Eq. (4) is determined through intermediate value theorem, Eq. (5), the applicability of which was justified by the continuous variation of α
 $$\tan \,\alpha = {1 \over {{\xi _{\rm{f}}} - {\xi _{\rm{i}}}}}\int_{{\xi _{\rm{i}}}}^{{\xi _{\rm{f}}}} {\tan \,\xi {\rm{d}}\xi } \quad .$$
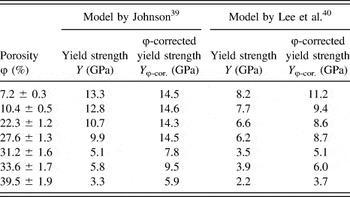
Equation (5) with ξi = 35.3° and ξf = 54.7° resulted in tan α = 1.02, which was slightly larger than unity, tan α would have attained for the median of the considered cone angle range. The transcendental Eq. (4) was solved for the yield strength Y for different levels of porosity using both the nominal hardness H and porosity corrected hardness H φ-cor. given in Table V. The obtained results are given in Table VI, where Y φ-cor. stands for the porosity corrected yield strength of the specimen. Yield strength values determined by applying the finite element analysis based model by Lee et al. Reference Lee, Yeo and Polycarpou43 for elastic-perfectly plastic thin film constitutive behavior, were also included in Table VI for comparison purposes. In contrast to Johnson's model, which requires the Poisson's ratio, ν, the model by Lee et al. necessitates only a single elastic parameter, namely the elastic modulus, E, to predict the hardness to yield strength ratio as a direct consequence of the analysis-of-variance with 32 factorial design of experiments approach implemented in that work. Reference Ma, Wang, Wood, Zekonyte, Luo and Walsh40
Yield strength Y and porosity corrected yield strength Y φ-cor. for density modulated tungsten film samples with different porosity levels determined according to the models by Johnson Reference Wang39 and Lee et al. Reference Ma, Wang, Wood, Zekonyte, Luo and Walsh40

The nominal and porosity-corrected yield strength values listed in Table VI for both models have two important implications. First of all, in an agreement with the discussions provided in Refs. Reference Bower35, Reference Li and Antoniou36, Reference Ding, Zhang and Vajtai38, and Reference Giri, Tao, Kirca, To, Li and Gao44–Reference Hodge, Biener, Hayes, Bythrow, Volkert and Hamza46 for numerous nanoporous metallic films and planar structures of different elemental species, the inapplicability of both the Tabor's relation, H ≈ 3Y, and the scaling laws of Gibson and Ashby are established for the particular case of density modulated W thin films with nanoscale pores. Secondly, based on the porosity corrected yield strength values of Table VI, for both models a sharp transition in the yield behavior of the density modulated W thin films was identified within the porosity interval 26.3% ≤ φ ≤ 32.8%. This trend qualitatively agreed with the findings in the studies by Huber et al., Reference Ding, Zhang and Vajtai38 Sun et al. Reference Johnson42 and Hodge et al., Reference Lee, Yeo and Polycarpou43 which explained the transition in yield behavior through a geometric parameter such as the amount of disorder in pore distribution or the ligament size (i.e., the diameter of ligaments within representative volume units of nanoporous media), which became increasingly influential at higher porosity levels.
According to our current understanding, this effect, graphically depicted in Fig. 12 for both models, arises from a pure geometric origin rather than an intrinsic transition in the constitutive response of the nanoporous material. Hence, the drop in the porosity corrected yield strength can be associated with the change in the structural yield criterion as rising levels of porosity would lead to increasingly more slender ligaments throughout the effective total load bearing cross-section of the thin film. The comparison of the results by the two models also reveals that due to its underlying assumptions concerning lack of strain hardening (i.e., elastic perfectly plastic material behavior) and presence of a one-to-one correspondence between scratch hardness and indentation hardness, the model by Lee et al. Reference Ma, Wang, Wood, Zekonyte, Luo and Walsh40 consistently underestimates the yield strengths as compared to the model by Johnson. Reference Wang39 Moreover, it is conceivable that the model by Johnson would define an upper bound for the yield strengths since smaller grain size in the particular case of a density modulated metallic film would beget a more densely localized work hardening due to spatial discontinuities associated with nanoscale porosity. Reference Ding, Zhang and Vajtai38,Reference Wang39,Reference Lydzba, Shao, Dormieux and Ulmedited47 Therefore, this coupled porosity and nanostructure related fundamental difference in the dissipation mechanisms of deformation energy in density modulated metallic thin films is expected to give rise to much stronger but short-range hardening behavior inside and in the immediate proximity of the indentation region as compared to the nonporous conventional elastoplastic materials with much larger grain sizes and widespread dislocation activity facilitating extensive plasticity Johnson considered in his formulation. Reference Wang39 Taking these factors into account, it would be plausible to assume that in actuality, the true yield strength values for density modulated W thin film samples of this study would be enveloped by the porosity corrected yield strength values suggested by these two models independently. Further experimental studies and simulations are needed to answer the question, whether this kind of geometrically substantiated drop in yield strength above a certain porosity threshold can be defined as a universal structural buckling criterion for metallic thin films with nanoscale porosity.
It is also worth mentioning that as compared to relative densities between 0.25 and 0.40, typically studied in the case of nanoporous metallic films synthesized through dealloying methods, Reference Liu and Antoniou20,Reference Li and Antoniou36,Reference Ding, Zhang and Vajtai38,Reference Wang39 the films whose yield behavior is analyzed through the present work have relative densities above 0.50. This fundamental difference places the samples investigated herein under the regime where ‘the intrinsic material effects would dominate over geometric effects’ in terms of the yield criteria owing to enlarged junction effect and increased joint size to ligament length ratio as described in the excellent work by Liu and Antoniou. Reference Liu and Antoniou20 To gain further insight into the geometrically dictated yielding behavior in nanoporous W thin films, a dealloying based synthesis route should be devised, which would not only enable relative densities less than 0.5 without experiencing spontaneous oxidation into WO3 in air, but also allow for a direct comparison with other nanoporous metallic film samples with well-defined ligament sizes Reference Liu and Antoniou20,Reference Li and Antoniou36–Reference Wang39 instead of atomic scale to couple of nanometers sized pores. Reference Yonezawa, Yamazaki and Kikuta9−Reference Messier, Giri and Roy11
IV. CONCLUSIONS
Nanomechanical properties of density modulated W thin film samples were investigated as a function of porosity content by means of nanoindentation. Collected experimental reduced modulus data at different porosity levels were used in the reduced χ2 analysis of four different models formulated through DEMA. Among these models, Model 4 resulted in the best fit, where up to a porosity content of around 40%, the mismatch between the experimental data and theoretical predictions was consistently limited to less than 5% of the measured nanoindentation value. A direct implication of this excellent agreement between experimental data and predictions of Model 4 from the thin film growth and process engineering perspective is the potential utility of achieving desired mechanical properties for application specific tasks in single-/multilayer thin film structures, by controlling the porosity content through fundamental process parameters such as chamber pressure and deposition time. That the elastic response and mechanical behavior of a certain metallic thin film material can be manipulated through the level of porosity it bears, can also transform the parametric design space for many technologically important functional coating and thin film applications and thus open new avenues for optimization.
In the particular case of density modulated W thin films, our results have shown that the auxetic barrier demarking the level of porosity at which the material would start exhibiting negative Poisson's ratio, i.e., ν < 0, cannot be breached. Attempts to increase the porosity beyond 50% resulted in either large scale pulverization during deposition or spontaneous conversion of the deposited film into WO3 following its immediate contact with atmospheric oxygen. This reaction represents an alternative chemical pathway for the room temperature synthesis of WO3, whereby functional WO3 thin films can be obtained.
The overall significance of the study presented herein is the provided experimental evidence concerning the increase in thin film mechanical compliance through density modulation. Experimental data have shown that by increasing the porosity content to around 30%, it is possible to eliminate the mismatch between a Si wafer substrate and a nanoporous W thin film in terms of their elastic moduli in the through thickness direction. This observation is in agreement with the results obtained in earlier studies by Karabacak et al. Reference Karabacak, Picu, Senkevich, Wang and Lu12,Reference Karabacak, Senkevich, Wang and Lu13 concerning residual stress reduction in thicker films through density modulation. It also provides physical insight into the enhanced mechanical integrity and delamination resistance of alternating layers of high and low density films in multilayer structures by virtue of density modulation induced discontinuity in the stress field and suppression of residual stress accumulation during film deposition.
Implications of nanoscale porosity content in terms of commencement of plasticity were also investigated through models proposed by Johnson Reference Wang39 and Lee et al. Reference Ma, Wang, Wood, Zekonyte, Luo and Walsh40 Increasing porosity levels from around 7% to 40% were found to result in somewhat linear drop in apparent yield strength amounting to 10 GPa and 6 GPa according to the formulations by Johnson and Lee et al. respectively. Calculation of porosity corrected yield strength enabled us to discern between the constitutive effects and a predominantly geometrical response change attributed to increasing slenderness of load bearing ligaments because of porosity. For both models, a porosity level around 30% was found to be acting as a threshold beyond which the increased slenderness ratio of individual ligaments would abruptly diminish the compressive yield strength of density modulated W thin film samples due to an increased susceptibility to buckling phenomena both within the indentation zone and its proximity.
ACKNOWLEDGMENTS
Authors Tanil Ozkan and Andreas A. Polycarpou gratefully acknowledge the support of the National Science Foundation under grant no. NSF CMMI 1030657. Film growth and structural analyses of films were carried out in the laboratories of the University of Arkansas at Little Rock. Nanoindentation, SPM and AFM analyses were performed in the Frederick Seitz Materials Research Laboratory Central Research Facilities, University of Illinois. Authors gratefully acknowledge Dr. Tobias Gokus at Neaspec GmbH for nano-FTIR analysis. Authors also express their gratitude for the constructive feedback they received from the reviewers of the JMR, which enhanced the scope and the depth of analysis provided in the revised version of this paper.