Nomenclature
- A
-
anhedral angle
- B
-
backswept angle
- CFD
-
computational fluid dynamics
- DEM
-
discrete element method
- F
-
forward-swept angle
- PIV
-
particle image velocimetry
- R
-
radius
- RANS
-
Reynolds-averaged Navier-Stokes
- VTM
-
vortex transport model
- VVPM
-
viscous vortex particle method
Symbols
-
 $dV$
-
volume microelement of the control body cell
-
$dS$
-
surface element of the control body cell
-
$D$
-
aerodynamic drag (
${\rm{kg\;m}}{{\rm{s}}^{ - 2}})$
-
${D_p}$
-
sediment particle diameter (
${\rm{m}})$
-
$E$
-
total energy per unit of fluid
-
${F_c}$
-
convective flux
-
${F_v}$
-
viscous flux
-
$H$
-
total enthalpy per unit of fluid
-
$k$
-
turbulent kinetic energy (
${{\rm{m}}^2}{{\rm{s}}^{ - 2}})$
-
${K_D}$
,
${K_L}$
,
${K_M}$
-
drag, lift, moment coefficients, respectively
-
$L$
-
lift force (
${\rm{kg\;m}}{{\rm{s}}^{ - 2}})$
-
${M_a}$
-
aerodynamic moment (
${\rm{kg\;}}{{\rm{m}}^2}{{\rm{s}}^{ - 2}})$
-
$n$
-
normal vector
-
$p$
-
fluid pressure (
${\rm{N}}{{\rm{m}}^{ - 2}})$
-
$t$
-
time
$\left( {\rm{s}} \right)$
-
$u$
,
$v$
,
$w$
-
velocity components in the x, y, and z directions, respectively (
${\rm{m}}{{\rm{s}}^{ - 1}})$
-
${u_{\rm{*}}}$
-
friction velocity
$\left( {{\rm{m}}{{\rm{s}}^{ - 1}}} \right)$
-
${U_a}$
-
axial velocity (
${\rm{m}}{{\rm{s}}^{ - 1}})$
-
${U_I}$
-
induced velocity
$\left( {{\rm{m}}{{\rm{s}}^{ - 1}}} \right)$
-
${U_r}$
-
radial velocity
$\left( {{\rm{m}}{{\rm{s}}^{ - 1}}} \right)$
-
${V_r}$
-
relative velocity vector
-
$W$
-
conserved variable


Greek symbol
-
${\tau _{ij}}$
-
viscous stress component
-
${\tau _w}$
-
wall shear (
${\rm{N}}{{\rm{m}}^{ - 2}})$
-
$\rho $
-
fluid density (
${\rm{kg\,m}}{{\rm{s}}^{ - 3}})$
-
${{\Phi}_{ij}}$
-
heat conduction component


1.0 Introduction
The vertical take-off and landing capabilities and the utilisation of ground effect represent a significant advantage of the helicopter, which thus occupies a distinctive position among aircrafts. However, when helicopters take off and land in harsh environments such as deserts and snow fields, they will inevitably be affected by the multiphase environment, which will irreversibly affect the pilot’s operation and the aircraft’s equipment [Reference Collins and Moore1], and pose a serious threat to the safety of helicopters in near-earth flights [2]. This phenomenon, known as brownout or whiteout, has consistently attracted significant attention within the helicopter industry. The ground effect phenomenon, which is the cause of this phenomenon, has naturally attracted considerable attention. As one of the earliest researchers to study the ground effect phenomenon, Light [Reference Light3] observed that the radial direction of the blade tip vortex shrinks and then expands, and that the vertical direction of the blade tip vortex decreases significantly near the ground in ground effect. Lee et al. [Reference Lee, Leishman and Ramasamy4] conducted experiments based on the PIV technique for the shrinkage model with different hovering heights and derived the evolution process of the blade tip vortex in the ground effect flow field. The evolution of the tip vortex in the ground-effect flow field is characterised by strong bending and stretching when the vortex is in proximity to the ground. It then moves along the radial direction on the ground, forming a wall jet between the residual wake region and the ground. This jet accelerates the dissipation of the blade tip vortex at a distance from the rotor. Subsequently, Milluzzo [Reference Milluzzo5] employed the PIV technique to investigate a scaled model of four distinct rotor tip shapes (rectangular, backswept, BERP and slotted) fixed at an altitude of 1.0R. The dimensions of the vortex core and the velocities of the vortex profile at the 800° azimuthal angle were measured. The velocity distributions at the same spreading position for different tip shapes were analysed using transient and phase average analysis, which led to conclusions about velocity distributions and ground deposits.
A substantial body of ground effect experiments has been conducted with the objective of elucidating the mechanism of brownout generation. These experiments, conducted by Greeley [Reference Greeley, Balme, Iversen, Metzger, Mickelson, Phoreman and White6], have demonstrated that while the primary hopping mechanism for particles larger than 60μm is the shearing of the boundary layer, the aerodynamic hopping of sand particles due to the unstable pressure exerts a non-negligible and significant influence on particles of a smaller size (approximately 2μm). Sydney and Johnson et al. [Reference Johnson, Leishman and Sydney7, Reference Johnson8] have conducted meticulous observations of the hopping process of sand particles. Their findings indicate that a significant number of particles are caught by blade tip vortices near the surface and intermittently lifted up, ultimately leading to the formation of the brownout phenomenon. In the vicinity of the boundary layer, the flow field of the brownout phenomenon exhibits pronounced non-periodicity as a consequence of the stretching, deformation and fusion of the blade tip vortices. The fused blade tip vortices exert an even more pronounced influence on the entrainment of sand particles.
However, the accuracy requirements of flow visualisation methods such as PIV and imaging methods also significantly increase the complexity and cost of experiments. Consequently, many researchers have begun to utilise numerical simulation methods. Due to the distinctive starting vortex phenomenon observed in the early stages of numerical simulation, the evolution of the ground effect flow field can exhibit markedly different outcomes in the initial and full-developed stages.
Due to the rapid computational capabilities of the free wake method, Pulla [Reference Pulla and Conlisk9] conducted numerical simulations of up to 100 revolutions for helicopters with characteristics such as prolonged hovering periods. Although subject to minor influence from the advance ratio, the results presented in this article demonstrate that the flow field on the surface and in the vicinity of the blades exhibits a periodicity characterised by a cycle of 30 revolutions. Nevertheless, the free wake method still fails to achieve the desired level of precision. By solving the Reynolds-Averaged Navier-Stokes (RANS) equations with a finite volume computational fluid dynamics (CFD) method, Kalra [Reference Kalra, Lakshminarayan and Baeder10] conducted a more detailed numerical simulation of the ground-effect flow field of a miniature hovering rotorcraft, and ultimately identified the occurrence of flow separation. A bubble was observed near the surface, formed by the interaction of the ground boundary layer and the vortex of the shedding blade tip. It was concluded that the surface flow field exhibited essentially laminar flow characteristics, with an increase in turbulence as the height above ground decreased. Simulations of the ground-effect flow field of rotor blades were conducted by Thomas and Baeder et al. [Reference Thomas and Baeder11] using the RANS method. These simulations were then extended to investigate the effect of sand.
In the brownout study, the semi-empirical formula for judging the jumping of sand particles, which is widely used internationally, is essentially derived from the critical friction velocity formula proposed by Shao [Reference Shao, Raupach and Findlater12, Reference Shao and Lu13] in 1993. Syal [Reference Syal and Leishman14, Reference Syal15] modified the formula on the basis of Shao et al. and introduced a collision model, which successfully realised the numerical simulation of the bombardment phenomenon, improved the accuracy of the numerical simulation, and obtained a more suitable numerical simulation of brownout. The accuracy of the simulation is significantly enhanced, and a semi-empirical formula for sand particle lifting, which is more appropriate for helicopter brownout, is derived. It has been demonstrated that the region of tip vortex/circulation/ground vortex in the ground effect flow field of a helicopter has a significant impact on the occurrence of the bombardment phenomenon, resulting in a considerable number of particles being lifted upwards.
On this basis, a variety of methodologies have been employed for the simulation of the brownout phenomenon, including the utilisation of CFD techniques with a vortex transport model (VTM) [Reference Phillips and Brown16], one-way coupling of CFD-DEM [Reference Hu, Xu, Shi and Wu17, Reference Hu, Xu, Shi and Huang18], and numerical simulation of the flow field based on viscous vortex particles (VVPM) coupled to DEM [Reference Tan, He, Yu and Zhou19–Reference Tan, Sun and Barakos21].
Nevertheless, in order to obtain the motion of sand particles in the brownout phenomenon, the mainstream coupled DEM method must be employed. This method is characterised by a computing burden that is dependent on two key factors: firstly, the number of sand particles present within the coupled flow field; and secondly, the unique Rayleigh time step, which is considerably smaller than the physical time step of fluid computation [Reference Norouzi, Zarghami, Sotudeh-Gharebagh and Mostoufi22] is also extremely demanding in terms of computational resources as well as computational time. This places an even greater burden on the CFD flow field computation of the ground effect, which is already extremely computationally burdensome. Consequently, there is a paucity of research exploring the potential modifications to rotor design parameters that could enhance the existing flow field, thereby mitigating the onset of brownout. Furthermore, there is a dearth of studies for indirectly anticipating the outcomes of brownout based on the intrinsic characteristics and mechanisms of the phenomenon, namely the ground effect flow field, through the application of pertinent theories.
This is the motivation behind conducting the present research. In light of the aforementioned considerations, this paper proposes an efficient and somewaht reliable approach to brownout prediction based on analysis of helicopter ground effect flow field eigen quantities. This approach involves the extraction of eigen quantities from each region of the flow field, in conjunction with the Greely-Iversen expression in particle dynamics. Unlike existing techniques, it does not rely on the coupled DEM method, which is known to be computationally expensive. The conclusions obtained through the established approach are then compared and demonstrated with those obtained through CFD-DEM for different hovering heights. Furthermore, the intrinsic connection between the flow field eigen quantities and the late development of brownout is explored through the study of the ground effect flow field with different blade tip shapes.
2.0 Methodology
2.1 CFD solver
In this paper, the commercial software STAR-CCM+ is employed, and the Reynolds-Averaged Navier-Stokes (RANS) system of equations is selected for the control equations, whose integral form is:
 \begin{align}{\partial \over {\partial t}}\int \int {\int _{\partial V}}WdV + {\mathop{{\int\!\!\!\!\int}\mkern-21mu \bigcirc}\limits_{} {} _{\partial S}}({F_c} - {F_v}) \cdot ndS = 0 \end{align}
where
 $dV$
is the volume microelement of the control body cell,
 $dS$
is the surface element of the control body cell,
 $W$
is a conserved variable, and
 ${F_c}$
and
 ${F_v}$
denote the convective and viscous fluxes, respectively, with the expressions:
 \begin{align} W = \left[ \begin{array}{c}\rho \\[3pt] {\rho u}\\[3pt] {\rho v}\\[3pt] {\rho w}\\[3pt] {\rho E}\end{array} \right],{F_c} = \left[ {\begin{array}{c}{\rho {V_{\rm{r}}}}\\[3pt] {\rho u{V_{\rm{r}}} + {n_x}p}\\[3pt] {\rho {W_{\rm{r}}} + {n_y}p}\\[3pt] {\rho w{V_{\bf{r}}} + {n_z}p}\\[3pt] {\rho H{V_{\rm{r}}}}\end{array}} \right],{F_v} = \left[ {\begin{array}{c}0\\[3pt] {{n_x}{\tau _{xx}} + {n_y}{\tau _{xy}} + {n_z}{\tau _{xz}}}\\[3pt] {{n_x}{\tau _{yx}} + {n_y}{\tau _{yy}} + {n_z}{\tau _{yz}}}\\[3pt] {{n_x}{\tau _{zx}} + {n_y}{\tau _{zy}} + {n_z}{\tau _{zz}}}\\[3pt] {{n_x}{{\Phi}_x} + {{\bf{n}}_y}{{\Phi}_y} + {n_z}{{\Phi}_z}}\end{array}} \right] \end{align}
where
 $\rho $
is the fluid density, p denotes the fluid pressure,
 $u$
,
 $v$
, and
 $w$
are the velocity components in the x, y, and z directions of the fluid, respectively,
 $E$
is the total energy per unit of fluid,
 $p$
denotes pressure and
 $H$
is the total enthalpy per unit of fluid.
The continuity and momentum conservation equations are solved by the coupled fluid solver in implicit integral format. The gas in the flow field is set to be a compressible ideal gas, and the turbulence model is the SST k-
 $\omega $
model, which incorporates cross-diffusion derived from the
 $\omega $
equations. Its turbulence viscosity takes into account the propagation of the turbulent shear stresses and can simulate the ground effect flow field more accurately due to its different model constants.
2.2 Mesh system
The calculations presented in this paper employ a moving-embedded grid methodology to simulate the rotational, pitch-variable and other motions of the blades. To guarantee the orthogonality and compatibility between the meshes, all the meshes, including the blade mesh and the background mesh, are polyhedral meshes generated by STAR-CCM+.
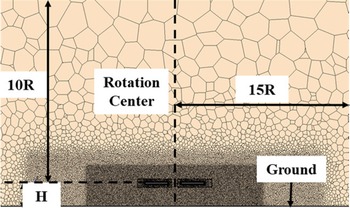
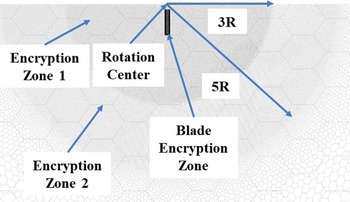
The mesh system employed in this paper is illustrated in Fig. 1. The two blades are situated within the region of the body-fitted mesh, which comprises approximately 2.5 m meshes each. The hybrid mesh system, which contains the viscous boundary layer, is generated using a polyhedral mesh generator and prismatic layer model. The background mesh comprises approximately 10 m elements and exhibits a composition and structure consistent with that of the body-fitted mesh. In order to ascertain the characteristics of the ground-effect flow field in a hovering state, the regions in which the blade-tip vortices evolve throughout the full-size helicopter’s ground-effect flow field have been identified and encrypted. The encrypted regions are located at 3R and 5R radii centred on the rotation axis, as well as a rectangular region with a side length of 15R centred on the rotation axis. Each boundary condition is set as follows: the ground is designated as a no-slip boundary, while the surrounding and upper boundaries are defined as pressure outlets. The precise dimensions of the computational domain are illustrated in Fig. 2.
Mesh system.

Computational domain setup.

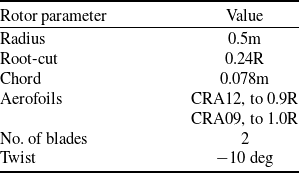
The baseline rotor system employed in this study is a pair of rectangular blades with linear negative twist which rotates clockwise. The parameters of the rotor model are presented in Table 1, with a collective pitch of 5.1546° and a tip Mach number of 0.647.
Rotor parameters

2.3 Validation of CFD method
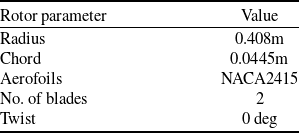
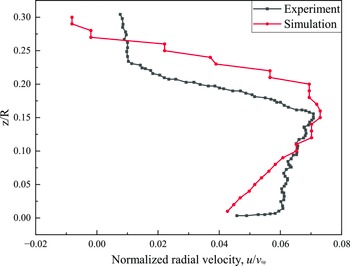
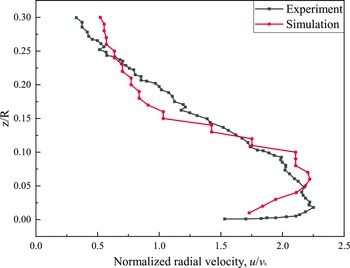
In order to verify the accuracy of the CFD method utilised in this study within the context of the rotor blade ground effect flow field, a comparative analysis is conducted with the isolated rotor blade model test conducted at the University of Maryland [Reference Milluzzo5]. The rotor blade parameters employed in this test are delineated in Table 2. The test conditions compared in this paper are rectangular blades, height above ground 1R, collective pitch 4.5°, with the rotor hovering.
Test rotor parameters

As illustrated in Figs 3 and 4, the relationship of the normalised radial velocity to the normalised height is presented for r/R = 1.29 and r/R = 1.6. According to the model test [Reference Milluzzo5], the radial velocity is normalised with the tip velocity and induced velocity in hovering condition, respectively. As demonstrated in the figure, this numerical simulation method effectively captures the characteristics of the ground effect flow field in terms of both trend and value.
Relationship of the normalised radial velocity at r/R=1.29 to the normalised height above the ground z/R.

Relationship of the normalised radial velocity at r/R=1.6 to the normalised height above the ground z/R.

3.0 Brownout predicting approach based on flow field eigen quantity analysis
3.1 Flow field eigen quantities and brownout prediction
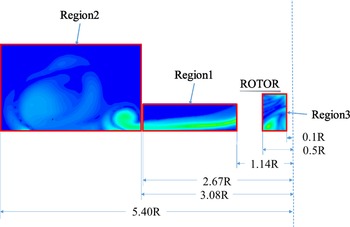
This paper will examine two aspects to alleviating the deterioration of the brownout phenomenon in its late stages based on previous studies and related therotical foundations of particle dynamics. In order to achieve this objective, this paper divides the rotor ground effect flow field region of interest into three distinct sections, as illustrated in Fig. 5. Initially, the wall jet region is formed by the blade tip vortex, which is shed off and moves with the downwash flow. After being subsequently blocked, the flow then moves outward along the ground. Secondly, along the periphery of the wall jet region, where a fusion phenomenon of the blade tip vortex in the winding region occurs. Thirdly, the region of unsteady turbulence directly under the rotor disc is affected.
Characteristic regions of the ground effect flow field.

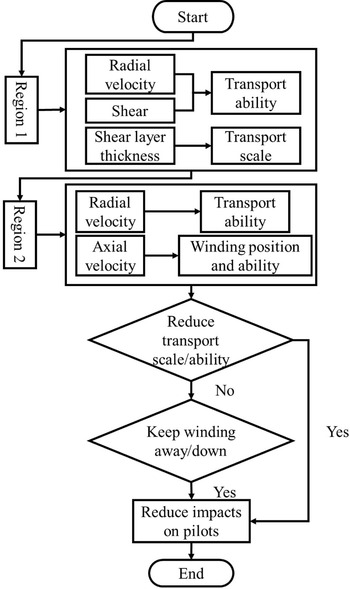
Flow chart of the flow field eigen quantity analysis in region 1 and region 2.

Firstly, from the perspective of the pilot, the objective in the formation of brownout is to maintain optimal visibility and control sand concentration. This can be achieved by reducing the size of the sand particles involved in the brownout or by pushing the sand cloud away from the rotor blades. Figure 6 presents a flow chart of the flow field eigen quantity analysis in the wall jet region and the winding region. In the wall jet region, the aerodynamic force exerted on sand particles is illustrated by the Greely-Iversen expression (Equations 3, 4 and 5). This expression demonstrates that the thickness of the shear layer, along with the shear stress and radial velocity present within it, play a pivotal role in determining the transport scale and capacity of sand [Reference Thomas and Baeder11]. A reduction in the thickness of the shear layer is conducive to a reduction in the scale of sand particle transport. Similarly, a reduction in shear stress and radial velocity is conducive to a reduction in sand particle transport capacity, implying that fewer sand particles are involved in the brownout phenomenon. In the RANS method, the Reynolds stress in the flow is averaged, with the closest turbulent kinetic energy used for characterisation. In the outermost region of the vortex fusion and winding, increasing the radial velocity helps to push the brownout phenomenon away from the rotor blade, while decreasing the speed of the winding velocity of sand particles and delaying the start of the winding can effectively reduce the size of the sand particles being swept up into the upper layer of the sand cloud, and thus reduce the size of the sand particles that are actually involved in the overall brownout phenomenon. The number of sand particles involved and the location of the winding both have significant implications for drivers. This paper therefore transforms the analysis of these two key factors into an examination of their corresponding flow field eigen quantities, combining the analysis of the two regions to draw a unified conclusion.
 \begin{align}D = {K_D}\rho u_{\rm{*}}^2D_p^2 = {K_d}{\tau _w}D_p^2 \\[-24pt] \nonumber \end{align}
 \begin{align}L = {K_L}\rho u_{\rm{*}}^2D_p^2 = {K_l}{\tau _w}D_p^2 \\[-24pt] \nonumber \end{align}
 \begin{align}{M_a} = {K_M}\rho u_{\rm{*}}^2D_p^3 = {K_m}{\tau _w}D_p^3 \\[-2pt] \nonumber \end{align}
Secondly, from the perspective of engine and component maintenance costs, reducing the level of turbulence in the region of unsteady turbulence below the rotor disks can minimise the likelihood of sand particles in the downwash being caught up in the turbulent flow, thus reducing the risk of compromising the safety of the components. Conversely, excessive turbulence may also disrupt the formation of downwash tip vortices, influencing their subsequent development.
3.2 Effectiveness analysis of approach based on eigen quantity analysis
This section serves to verify the effectiveness of the eigen quantities selected in the previous section for the purpose of brownout prediction in rotor ground effect flow fields, with a view to establishing their applicability at different heights. The baseline value of rotor height above the ground is selected as 0.8R or 0.4m in order to ensure a strong practical significance while allowing for sufficient ground effect influence. Given the considerable variation in thrust observed for different height conditions as well as different blade tip shapes when controlling the collective pitch, the majority of results presented in this paper are expressed in dimensionless form through the induced velocity in each case.
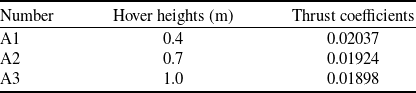
In order to facilitate comparison, the hover heights and corresponding thrust coefficients for the height control group are presented in Table 3, with rotor parameters and collective pitch held constant. Each of the three characteristic regions in the flow field domain presented in the previous section will be analysed and compared with the existing conclusions in this section.
Case setup of different hover heights and thrust coefficients

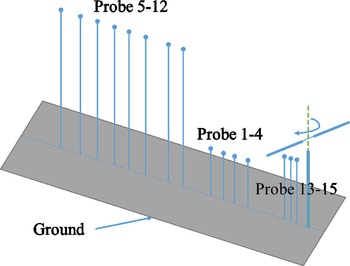
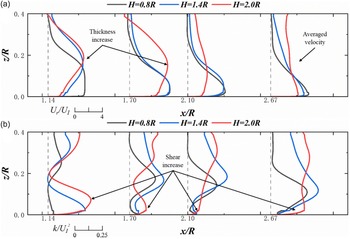
Firstly, the most characteristic wall jet region in the ground effect flow field is initially analysed, as this is also the region with the most significant influence on the transport of sand particles in the middle and late stages of rotor hovering. Four locations within this region have been selected for investigation, and their precise positions are illustrated in Fig. 7. In this region, the tangential motion of the particles is typically minimal in comparison to the radial motion. Consequently, the transport of sand particles is predominantly influenced by the radial force. Given the significant variation in the thrust coefficient with height when the collective pitch is held constant, the aforementioned quantities are treated as dimensionless. Figure 8 illustrates the distribution of radial velocity and turbulent kinetic energy at varying locations within the wall jet region of the flow field. It can be observed that in the vicinity of the rotor blades, within the height range affected by the ground effect, an increase in height results in a gradual thickening of the shear layer, accompanied by an increase in shear force. However, following the attenuation of the ground effect, the radial velocity in this region exhibits a tendency towards a gradual reduction, accompanied by a decrease in shear force. However, as the distance increases, the effect of the weakened stability of the tip vortex due to the increase in hovering height gradually manifests itself, resulting in a decrease in the overall radial velocity and a more chaotic distribution of shear stresses in the flow field. Consequently, the transport capacity of the wall jets due to the rotor blades is significantly reduced with increasing height. Only sand particles of smaller size and smaller number are lifted up to the upper layer, resulting in a gradual decrease in the number of particles able to move to the upper layer.
Diagram of ground effect flow field eigen quantity probe distribution.

Eigen quantity distribution in wall jet region in cases of different hover heights: (a) radial velocity; (b) turbulent kinetic energy.

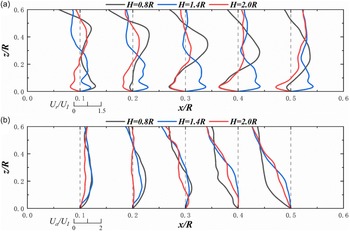
Secondly, an analysis of the winding characteristics of the winding region is conducted, with a particular focus on the radial and axial velocities of the flow field. Given the extensive nature of this region, eight positions within it have been selected for analysis, with the specific locations illustrated in Fig. 7. Figure 9 illustrates the distribution of radial and axial velocities at various points within the winding region of the flow field. In this region, an increase in hovering height results in an increase in radial velocity instability and an increase in axial velocity amplitude in the region closer to the rotor. This facilitates the trapping of sand particles in this region and their subsequent uplift with the airflow. However, in the more distant part, the radial velocity gradually tends to zero, and the axial velocity decreases at a slower rate but also gradually tends to zero, which results in the gradual disappearance of the brownout phenomenon in this region. As previously indicated, an increase in height results in a reduction in the number of sand particles transported, accompanied by a decrease in particle size. Consequently, although the winding region is gradually approaching the rotor blade horizontally with the increase in hovering height, the increase in vertical distance and diminishing ability to lift sand particles causes the rotor to move away from the influence of brownout.
Eigen quantity distribution in winding region in cases of different hover heights: (a) radial velocity; (b) axial velocity.

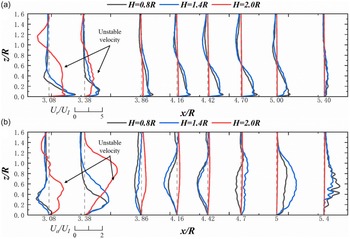
Finally, in order to gain insight into the movement of sand particles as the downwash flow re-enters a new cycle of brownout, and the potential effects on critical components such as the engine, the axial and radial velocities within the flow field directly below the rotor were considered. Given the relatively limited extent of this region in comparison to the preceding two, three locations were identified in the vicinity of the rotor blades’ central section for the purposes of this study, as illustrated in Fig. 7. However, due to the complexity of the flow field conditions in this region at different heights, two additional probes were included in the study. Figure 10 illustrates the distribution of radial and axial velocities at various points in the flow field directly beneath the rotor. As the distance from the rotor centre decreases, the radial velocity distribution becomes increasingly chaotic, with the sand particles in this area exhibiting more erratic movement. This has a significant impact on the critical components situated in this region. As the altitude increases and the distance from the rotor centre increases, the motion of the sand particles becomes dominated by the downwash motion until they are removed from the ground effect, which reduces the impact on the components. Concurrently, the elevation of the rotor blades also has the advantage of reducing the radial velocity of the particles, which consequently results in a greater number of particles being deposited beneath the rotor blades, rather than entering a new brownout cycle.
Case setup of different blade tip shapes

Eigen quantity distribution in unsteady turbulence region under the rotor disk in cases of different hover heights: (a) radial velocity; (b) axial velocity.

In conclusion, the analysis of the corresponding eigen quantities in each of the three regions revealed that an increase in hovering height is beneficial for helicopters to overcome the brownout and mitigate its overall impact. This finding aligns with the conclusions of related literature [Reference Hu, Xu, Shi and Wu17, Reference Hu, Xu, Shi and Huang18] on the influence of height on the brownout and demonstrates the effectiveness of the prediction of these eigen quantities for the brownout phenomenon.
4.0 Results and analysis
In this section, the validated judgements will be employed to analyse and predict the development of the brownout in the corresponding flow field by the distribution of the eigen quantities for the case of different blade tip shapes. Additionally, the relationship between the two will be examined by considering the characteristics of the respective blade vortices of the different blade tip shapes.
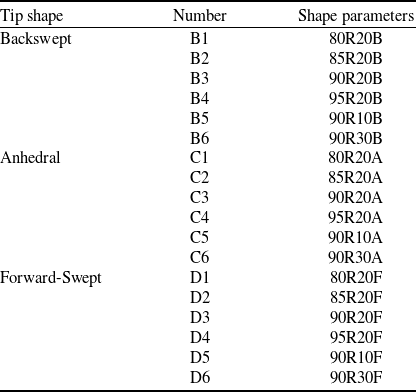
The following Table 4 illustrates the case setup of this section. Four distinct sets of starting positions are employed for the various blade tip shapes, while three different sets are utilised for the shape angles. As previously stated, the collective pitch was maintained as a constant across all blades.
4.1 Region 1 – wall jet region
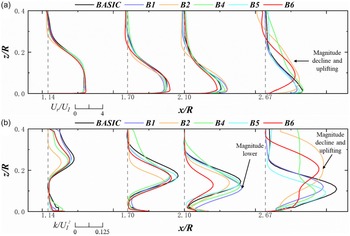
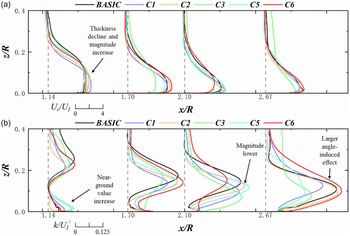
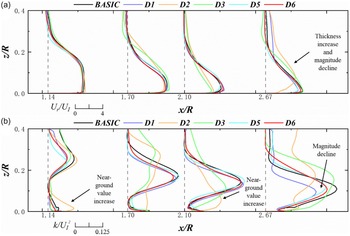
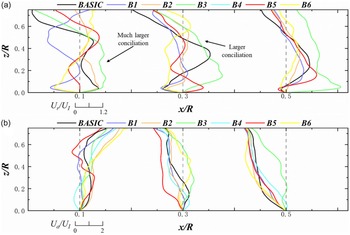
Figures 11, 12 and 13 illustrate the distribution of eigen quantities in the flow field of rotor blades with varying blade tip shapes in the wall jet region. The change in the starting position of the backswept blade tip has a negligible effect on the radial velocity in the vicinity of the rotor. Meanwhile, there is a notable reduction in the shear force in this region for the blade with a larger back-sweep. Conversely, the radial velocity of the backswept blade tip rotor exhibits a slight increase in the region more distant from the rotor, while the area with the larger shear force shifts towards the ground with the thickness of the shear layer remaining relatively constant.
Eigen quantity distribution in wall jet region of backswept blades: (a) radial velocity; (b) turbulent kinetic energy.

Eigen quantity distribution in wall jet region of anhedral blades: (a) radial velocity; (b) turbulent kinetic energy.

Eigen quantity distribution in wall jet region of forward-swept blades: (a) radial velocity; (b) turbulent kinetic energy.

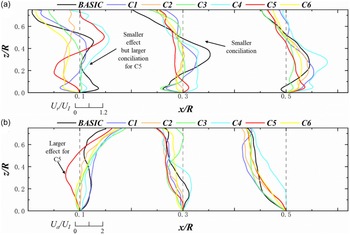
In conjunction with the subsequent section, the effect of anhedral to the eigen quantities in the disparate regions is more pronounced in comparison to the other two blade tips. In the section of the wall jet region situated in closer proximity to the rotor blade, the presence of the anhedral results in a reduction in shear layer thickness, accompanied by an increase in both shear force and radial velocity. In the region of the wall jet situated at a greater distance from the rotor, the thickness of the shear layer is observed to decrease in comparison to the baseline rotor. However, there is a gradual tendency for this value to converge towards the baseline rotor value. Furthermore, the radial velocity and shear force exhibit a similar magnitude to that of the baseline rotor. However, due to the aforementioned decrease in shear layer thickness, the portion of the shear force exhibiting a larger magnitude also becomes closer to the ground. The influence of varying anhedral angles on the shear layer thickness and radial velocity in the wall jet region is markedly diminished in comparison to the impact of the anhedral position. However, the effect of varying angles on the shear force is more pronounced than that of varying starting positions.
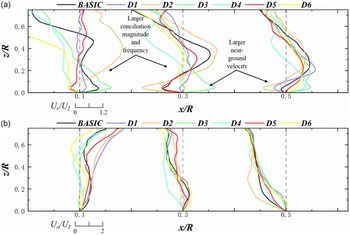
The presence of a forward-swept blade near the rotor part has a negligible effect on the thickness of the shear layer and the amplitude of the radial velocity. However, it has a more pronounced impact on the shear force, particularly within the shear layer, which plays a pivotal role in enhancing it. Conversely, at the periphery of this region, a slight increase in the thickness of the shear layer is observed, accompanied by a decrease in radial velocity and a tendency for the shear force to exhibit a reduction in amplitude. However, the peak region is situated closer to the ground. The variation in angle for different forward-swept angles has no significant impact on the shear layer thickness, radial velocity and shear force in the vicinity of the ground in the wall jet region.
4.2 Region 2 – winding region
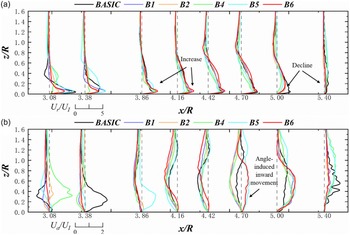
Figures 14, 15 and 16 illustrate the distribution of eigen quantities in the flow field of the rotor with different blade tip shapes in the winding region. In the case of the backswept blade, a decrease in radial velocity is observed at the transition from the outer to the inner regions of the wall jet, followed by an increase in the middle of the winding region. In the outer part of the winding region, the radial velocity remains relatively low in comparison to that of the baseline rotor. In contrast, the axial velocity distribution in the same region demonstrates a gradual increase towards the centre, accompanied by a slight tendency to wind up, and a downward wash in the middle part, which transitions to a wind-up mode in the outer part. The conclusions for the different back-sweep angles are analogous to those for the starting position, but the point at which wind-up commences is shifted inwards. The effect of back-sweep on the flow field is more pronounced at smaller degrees of back-sweep, i.e. when the back-sweep starting position is close to the blade tip or when the back-sweep angle is small. Conversely, at larger degrees of back-sweep, this effect of back-sweep is rather diminished. In combination with the results of the analysis presented in the preceding section, it can be observed that the presence of backswept blades reduces the scale of sand particle transport, while having a negligible effect on the overall transport capacity. Furthermore, fewer sand particles are involved in the brownout than in the baseline rotor. However, a change in the starting position of the backswept blades does not result in an inward shift of the winding position, which occurs only when the angle is altered. Therefore, the backswept blade tip has a positive effect on reducing the size of the brownout, but the optimal angle must be identified, as an inappropriate angle may result in unintended consequences.
Eigen quantity distribution in winding region of backswept blades: (a) radial velocity; (b) axial velocity.

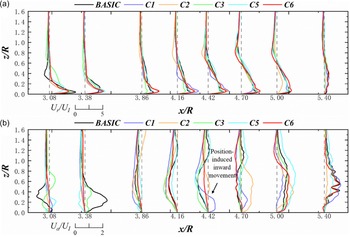
Eigen quantity distribution in winding region of anhedral blades: (a) radial velocity; (b) axial velocity.

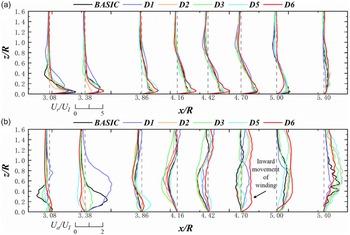
Eigen quantity distribution in winding region of forward-swept blades: (a) radial velocity; (b) axial velocity.

In the case of the anhedral blade, radial velocity, along with some downwash flow, remain dominant within the interior as well as at the centre of the winding region. Furthermore, the radial velocity is larger and more concentrated near the ground than in the baseline rotor. However, the internal starting position of the anhedral blade results in the start of the winding being closer to the centre of the rotor, and the axial velocity is larger in comparison to the other two blade tip shapes. Small anhedral angle has a negligible impact on radial velocity. However, when the anhedral angle is increased to a certain extent, a similar effect on radial velocity is observed to that seen with different anhedral starting positions. With regard to axial velocity, the alteration of the anhedral angle does not result in a notable impact on the position of the winding or the downwash zone. Instead, it merely introduces fluctuations in amplitude. It can be concluded that modifying the angle value has a negligible impact on the overall sand cloud distribution in this region. Furthermore, when the anhedral angle is increased to a larger value, the resulting effect is similar to that observed when the anhedral position is altered. In conclusion, while the transport of sand particles due to anhedral is somewhat reduced in size, the increase in the number of features allows larger particles to become involved in the brownout and transported with greater capacity. Furthermore, an inappropriate choice of starting position can also lead to a greater impact on the pilot by bringing the winding closer to the rotor blades.
In the case of forward-swept blades, a reduction in radial velocity amplitude is observed across the majority of this region. Conversely, there is an increase in axial velocity, accompanied by an inward tendency of the winding. The impact of the alteration in swept-forward angle on the radial velocities differs from that of the change in swept-forward position, exhibiting a more pronounced surge in radial velocity magnitude across the majority of this region, with the exception of the area where the winding commences. The conclusions reached for the winding are analogous to those derived for the forward-swept position change. The forward-swept blade is observed to drive larger particles outwards to a greater extent than the backswept blade, with a limited effect on the overall magnitude. Additionally, the inward movement of the winding region also moves the region where brownout occurs closer to the rotor blade. However, the contribution of these larger particles to the overall brownout phenomenon is found to be extremely small due to the sharp reduction in subsequent lift force. In conclusion, although forward-swept causes larger sand particles to participate in the brownout, the reduced transport capacity results in earlier deposition of those particles that do participate, even though the winding position is shifted inwards, thus reducing the size of the brownout to some extent.
4.3 Region 3 – unsteady turbulence region under the rotor disk
Figures 17, 18 and 19 illustrate the distributions of eigen quantities in the rotor flow field for varying blade tip shapes within the turbulent region situated beneath the rotor. In the case of a backswept blade, the presence of the backswept shape results in a more chaotic radial velocity distribution in this region, with a greater degree of turbulence and a more pronounced effect in the vicinity of the rotor’s centre. The axial velocity is almost consistent with that of the baseline rotor, but the degree of chaos is also larger than that of the baseline rotor. This results in a state of irregular movement of the sand particles which re-enter into the downwash flow. Such a phenomenon has a more serious impact on the key components located here.
Eigen quantity distribution in unsteady turbulence region under the rotor disk of backswept blades: (a) radial velocity; (b) axial velocity.

Eigen quantity distribution in unsteady turbulence region under the rotor disk of anhedral blades: (a) radial velocity; (b) axial velocity.

Eigen quantity distribution in unsteady turbulence region under the rotor disk of forward-swept blades: (a) radial velocity; (b) axial velocity.

The presence of the anhedral blade has a negligible impact on the overall velocity distribution. However, the radial velocity is markedly reduced in comparison to the baseline rotor. The smaller angle of the anhedral blade results in increased instability in both the normal and radial velocities.
In the case of the forward-swept blade, the velocity distribution in the flow field demonstrates an increase in both amplitude and fluctuation frequency in the vicinity of the rotor’s centre. Conversely, the radial velocity in the outboard portion exhibits an increase near the ground, while the axial velocity displays a more consistent overall trend. The re-entry of sand particles into the downwash flow, which occurs in a chaotic manner, exerts a greater influence on the key components than the aforementioned backswept blades, due to the increase in velocity. When a blade with a different forward-swept angle is considered, the flow field below the rotor blade is observed to exhibit a more uniform distribution of radial and axial velocities, in comparison to a blade with a different forward-swept starting position.
4.4 Impact of disturbances on eigen quantities during blade tip vortex evolution
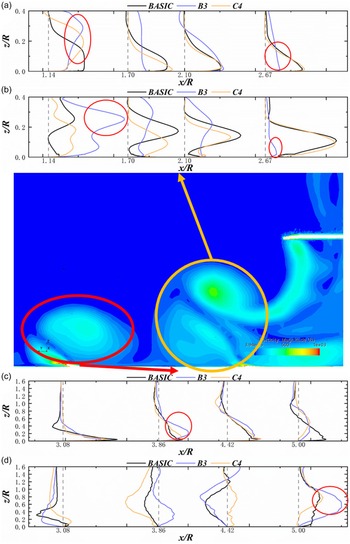
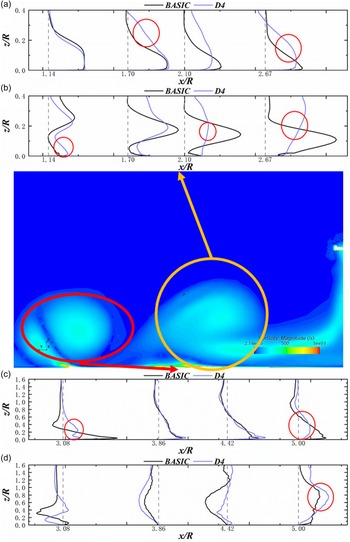
It is noteworthy that, for part of the cases of the backswept blade as well as the anhedral blade, the influence of the irregular flow under the rotor gives rise to the aberration illustrated in Fig. 20 occurs in the region of the wall jet, which leads to the radial wall jet being disturbed near the rotor in this region. As a result, the velocity profile of the jet is no longer maintained. Concurrently, the shear stress increases substantially. In contrast, in the region away from the rotor, both the shear stress and the near-the-ground radial velocity are reduced to some extent. However, the flow field below the anhedral blade rotor is less chaotic than that of the backswept blade, resulting in a less drastic change in radial velocity of the disturbed flow field. Furthermore, the reduction in radial velocity in the winding region is not significant. However, the additional dissipation caused by the disturbance results in an earlier fusion of the blade tip vortices in the winding region, a greater change in axial velocity in the winding region, and a more pronounced reduction in radial velocity at the periphery of the winding region.
Aberration and eigen quantity distribution caused by the fusion of the blade tip vortices: (a) radial velocity in region 1; (b) turbulent kinetic energy in region 1; (c) radial velocity in region 2; (d) axial velocity in region 2.

Similarly, as illustrated in Fig. 21, there are also cases of comparable aberrations in the wall jet region for the forward-swept blade. However, these instances are caused by the fusion of the blade tip vortices and, as a result, differ considerably from the case of the backswept blade in terms of outcomes. The distribution of velocity does not undergo a significant change in height; rather, it tends to average out. Consequently, the shear stress in the same region tends to become zero. The fusion of the vortices results in some dissipation, which in turn leads to a more pronounced reduction in radial velocity at the periphery of the winding region than would otherwise be the case.
Aberration and eigen quantity distribution caused by the fusion of the blade tip vortices: (a) radial velocity in region 1; (b) turbulent kinetic energy in region 1; (c) radial velocity in region 2; (d) axial velocity in region 2.

4.5 Effect of blade tip vortex strength on flow field eigen quantities for different blade tip shapes
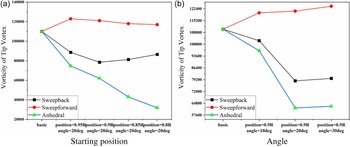
As evidenced by numerous preceding studies [Reference Hu23–Reference Pátý, Cernat, De Maesschalck and Lavagnoli25], the configuration of the blade tip exerts a pronounced influence on the strength and morphology of the tip vortex. Figure 22 illustrates that both backswept and anhedral reduce the strength of the blade tip vortex, while forward-swept increases it slightly. The anhedral has the greatest effect on the strength of the blade tip vortex, with the degree of anhedral having a significant impact on vortex strength. That’s to say, a greater degree of reduction in the strength of the blade tip vortex is observed when the starting position of the anhedral is shifted inward or when the anhedral angle is increased.
Comparison of blade tip vortex strength for different blade tip shapes.

In light of the aforementioned analysis, it can be observed that the three characteristic regions exhibit varying degrees of change affected by the blade tip vortex. Primarily, in the case of the wall jet region, only the anhedral blades demonstrate a pronounced alteration. Concurrently, an increase in the angle of the anhedral blade does not have as significant an impact on the attenuation of the blade tip vortex as moving the anhedral starting position inwards. Consequently, it can be inferred that the blade tip vortex exerts a more considerable influence on the wall jet region only when it has been sufficiently weakened. Secondly, in the case of the winding region, minor fluctuations in the initial intensity of the blade tip vortices will have a markedly diminished impact on the flow field. This is due to the fact that the blade tip vortices are already undergoing a gradual dissipation and merging process within this region. However, the emergence of weaker blade tip vortices will result in this process occurring at an earlier stage. This, in turn, will lead to a shift in the winding position inwards, towards the rotor. Concurrently, for anhedral blades, the diminished blade tip vortices result in a reduction in vorticity within the wall jet, which is transformed from the downwash of the rotor. Consequently, the disturbance of the flow below the rotor disk, when applied to an area situated at a greater distance from the source of the disturbance, exhibits minimal variation from the situation in the absence of the disturbance. In the region below the rotor, the change in the intensity of the blade tip vortices has no direct effect on the alteration of the flow field.
5.0 Conclusion
In this paper, the rotor ground effect flow field is obtained using the embedded-grid methodology. Thereafter, a new approach for predicting the late development of brownout through the flow field eigen quantities is established by combining the relevant theories. This is achieved without carrying out the coupled calculations that consume a lot of extra computational resources. This approach is employed to investigate the flow fields formed by rotor blades with different blade tip shapes or at varying heights within the ground effect. The reliability of the approach is demonstrated, the prediction of the late development of the brownout in these flow fields is made, and the following conclusions are drawn:
-
1. The transport capacity of the wall jets due to the rotor blades is found to decrease substantially with increasing height, and the number of particles able to move to the upper layers is observed to decrease gradually. Concurrently, as a consequence of the augmented vertical distance and the diminished capacity to elevate sand particles, the rotor wing progressively deviates from the influence of the brownout phenomenon, which also attenuate the impact of the movement of sand particles beneath the rotor wing on the component and facilitate the deposition of additional sand particles. This finding is consistent with those of previous CFD-DEM studies.
-
2. The existence of backswept permits a reduction in the number of sand particles participating in the brownout phenomenon, thereby mitigating the impact of the brownout phenomenon on the area in proximity to the rotor. However, this also allows for the lifting of smaller sand particles, which may re-enter a new round of the brownout cycle. In contrast, sand particles moving irregularly under the rotor may have a more pronounced impact on critical components. The impact of the back-sweep on the flow field is more pronounced when the degree is minimal.
-
3. Rotors with anhedral blade tip are observed to transport a smaller scale but larger types of sand particles outward in comparison to the other rotors. The winding of sand particles is located in a more proximal position relative to the rotor, while sand particles situated below the rotor tend to wash directly down towards the ground.
-
4. The forward-swept blades demonstrate a greater propensity to drive larger particles outwards, despite the inward movement of the winding. However, this outward transport occurrs on a smaller overall scale. In contrast, sand particles re-entering a new cycle have a more pronounced impact on the component than the backswept blades. The increase in the forward-swept angle is more pronounced in preventing sand particles from re-entering the new cycle.
-
5. With regard to the blade tip vortex, it should be noted that the intensity of this phenomenon only varies to a certain extent before it exerts an intuitive influence on the eigen quantities that are relevant to the development of brownout phenomenon in the ground effect flow field. Furthermore, minor variations in intensity have a limited and non-linear impact on the aforementioned eigen quantities of the flow field.
Competing interests
The authors declare none.