

Introduction
Meliponinae, one of three subfamilies of the family Apidae, form an important group of primary wild pollinators in the tropics, and some are able to produce honey (Brosi, Reference Brosi2009). Meliponinae bees are found throughout most tropical and subtropical regions of the world ranging from such diverse habitats as the humid rainforest to the dry savannah (Michener, Reference Michener2000). In Africa, 20 Meliponinae species endemic to the African continent have so far been reported (Eardley, Reference Eardley2004). Species such as Hypotrigona gribodoi, Meliponula bocandei, Meliponula lendliana and Meliponula ferruginea are reported to nest in forest habitats (Kajobe, Reference Kajobe2007; Kiatoko et al., Reference Kiatoko, Raina, Muli, Klaus and Mueke2012). However, there is lack of information in Africa about stingless bee species’ responses to habitat change and whether stingless bees differ in habitat preference. This information is needed to protect stingless bee species and their habitat in the wild, to maintain their diversity (Cortopassi-Laurino et al., Reference Cortopassi-Laurino, Imperatriz-Fonseca, Roubik, Dollin, Heard, Aguilar, Venturieri, Eardley and Nogueira-Neto2006). We studied the effect of habitat degradation on nest abundance and species diversity of five major stingless bee species in the tropical rainforest of Kenya. The Kakamega tropical rainforest is the only surviving tropical rainforest in Kenya, and nowadays, the forest stands as an island of different types of forest habitats in a sea of human-dominated landscapes (Kokwaro, Reference Kokwaro1988). Several grasslands have also appeared either in or surrounding the Kakamega forest (Tsingalia, Reference Tsingalia1988, Reference Tsingalia1990; Tsingalia and Kassily, Reference Tsingalia and Kassily2009). Eltz et al. (Reference Eltz, Bruhl, Imiyabir and Linsenmair2003) and Samejima et al. (Reference Samejima, Marzuki, Nagamitsu and Nakasizuka2004) have reported that habitat characteristics are important in regulating the diversity of stingless bee species and their population size. Degradation of the Kakamega indigenous forest into different habitat types might have either negatively affected the diversity of the Afrotropical stingless bee species or increased nesting sites for some of the species. The aim of this study was to explore the nest abundance of H. gribodoi, M. bocandei, M. ferruginea and M. lendliana over various habitat types compared to the indigenous forest. For M. ferruginea, we used two different morphospecies: a reddish-brown (Lepeletier, Reference Lepeletier de Saint-Fargeau1841) one and a black (Smith, Reference Smith1854) one. We also compared the diversity of these Meliponinae bees over the different habitats and the degree of similarity in bee species composition within the habitats. We expected nest abundance for each species and the species diversity would be higher in the indigenous forest than in any other habitat type. Knowledge from this study on how the nest abundance of the stingless bee species changes across different habitats will indicate how the populations of these species are affected by human activities and how they can be protected.
Methods
Study sites
The Kakamega forest is located about 45 km northwest of Lake Victoria from 1500 to 1700 m above sea level, between latitudes 0°10′ and 0°21′ N and longitudes 34°47′ and 34°58′ E (Kokwaro, Reference Kokwaro1988; Tsingalia, Reference Tsingalia1990). The forest is the easternmost remnant of the rainforest found in the Democratic Republic of Congo and much of West Africa (Kokwaro, Reference Kokwaro1988). The natural vegetation of Kakamega forest is tropical rainforest, but nowadays the forest is no longer a homogeneous habitat. Four different types of forest habitats can be found—forest habitats with only indigenous species (indigenous forest), forest habitats with a mixture of indigenous and exotic species (mixed indigenous forest), forest habitats with only exotic hardwood species (hardwood plantation) and forest habitats with only exotic softwood species (softwood plantation). Grasslands that have appeared in or around the Kakamega forest have either scattered trees or termite mounds, others are devoid of trees, and yet others combine these characteristics in various degrees (Tsingalia, Reference Tsingalia1988, Reference Tsingalia1990). In this study, surveys were carried out along a successive gradient of three categories of habitat, namely forest, grassland, and homesteads adjacent to the forest. For the forest habitat, two different types were surveyed—indigenous forest and mixed indigenous forest. For the grasslands, surveys were carried out in grassland with scattered indigenous tree species and in grassland with scattered exotic tree species (Eucalyptus sp.). Homesteads adjacent to the indigenous forest (Ivihiga homesteads) and to the mixed indigenous forest (Isiekuti homesteads) were surveyed.
Study species
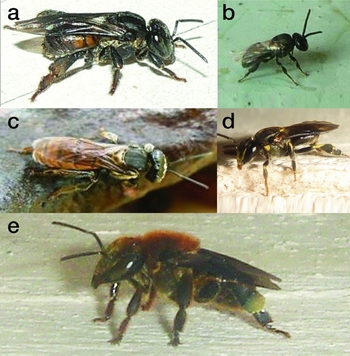
The study was carried out with the H. gribodoi, M. bocandei, M. ferruginea and M. lendliana species (all Hymenoptera: Apidae) (Fig. 1). These Meliponinae bees are reported to differ in their selection of nesting site in the African wild (Kajobe, Reference Kajobe2007; Kiatoko et al., Reference Kiatoko, Raina, Muli, Klaus and Mueke2012). Meliponula bocandei has a large body size (7.0 mm) and organizes its brood in clusters (as well as H. gribodoi), while the two morphospecies of M. ferruginea are smaller than M. bocandei, but with a mostly bigger body size (5.1–5.9 mm) than M. lendliana (4.1–4.5 mm) and H. gribodoi (2.2–2.9 mm). Meliponula ferruginea (M. ferruginea [reddish-brown], M. ferruginea [black]) and M. lendliana all organize their broods in horizontal combs (Eardley, Reference Eardley2004).
The different species of Afrotropical Meliponini bees investigated in this study: (a) Meliponula ferruginea (black), (b) Hypotrigona gribodoi, (c) M. ferruginea (reddish-brown), (d) M. lendliana and (e) M. bocandei.

Sampling method
Line transect methods were used to determine nest abundance for the Meliponini bee species in each habitat (Krebs, Reference Krebs1999; Jongjitvimol et al., Reference Jongjitvimol, Boontawon, Wattanachaiyingcharoen and Deowanish2005; Otieno et al., Reference Otieno, Le Ru, Ong'amo, Moyal, Dupas, Calatayud and Silvain2008). Thirty line transects, 500-m long and 20-m apart, were followed to inspect for nesting colonies. Nest inspections on the line transect of each habitat were carried out during sunny days, to facilitate viewing of forager bees flying in and out of the nests on every substrate likely to have nests (such as the ground, living and dead trees, termite mounds and houses). For nest inspections in living or dead trees higher than 6 m, a binocular spectrum (Olympusج, Porro Prism standard binocular) was used to detect the presence of nesting colonies (Eltz et al., Reference Eltz, Bruhl, Imiyabir and Linsenmair2003; Mbahin, Reference Mbahin2008). When a nest was found, some bees flying out of the nest were collected using a sweep net, identified and recorded (Kajobe, Reference Kajobe2007). The specimens from different nests were preserved in 70% alcohol, in separate vials and coded, for further identification to confirm the species. The number of nests of each Meliponini species observed per transect in the different habitats was recorded.
Data analysis
To study the differences in nest abundance of the different stingless bee species over various habitat types, we first tested the differences in the presence of a nest of a specific bee species in a habitat type. The predicted probability (P) reported as the nest occurrence of a stingless bee species (A) in a specific habitat (Z) was obtained by the following formula (Canard and Poinsot, Reference Canard and Poinsot2004):
 $PA( Z ) = \frac{{\sum {TiA} ( Z )\ }}{{TZ}}$
, where PA(Z) is the predicted probability of the presence of stingless bee species A in habitat Z, ∑TiA(Z) is the score (zero or one) given to a line transect (Ti) when a nest was found in habitat Z. Score one indicates that species A was present in the transect Ti and zero indicates that species A was absent in the line transect. TZ is the total number of line transects surveyed in habitat Z (Canard and Poinsot, Reference Canard and Poinsot2004). A generalized linear model (with binomial distribution and logit link) was used to model the predicted probability of the presence (PA(Z)) of a nest of stingless bee species A in habitat Z. Differences in mean predicted probability within habitats were subsequently compared using Tukey's test. The analysis was performed in R statistical software version 2.11.1 (R Development Core Team, 2005). The biodiversity package in R statistical software version 2.1.1 was used to make the species accumulation curves and the Rényi diversity profiles for each habitat type. The Rényi diversity profile is calculated by the formula
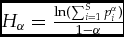 ${H_\alpha } = \frac{{{\rm{ln}}( {\mathop \sum \nolimits_{i = 1}^S p_i^\alpha } )}}{{1 - \alpha }}$
, where pi
is the proportion of each species and provides some specific details on the profile values of Hα
at alpha for each habitat. A profile is calculated by changing the value of alpha from 0 to infinity, and in Biodivesity R, the standard values for α are 0, 0.25, 0.5, 1, 2, 4, 8, and infinity. Rényi diversity profiles are curves that provide information on richness and evenness, as they provide a diversity ordering technique (Tóthmérész, Reference Tóthmérész1995). At α = 0, the profile values of Hα
provide information on the species richness (species richness = exp(H
α)) for each habitat; the profile value of H
α for each habitat at α = 1 is its Shannon diversity index; the profile value of H
α for each habitat at α = 2 is the logarithm of its reciprocal Simpson diversity index; and the profile value of H
α for each habitat at α = infinity provides information on the proportion of the most abundant species
 $( {{\rm{proportion\ of\ the\ most\ dominant\ species}} = \frac{1}{{\exp ( {{H_\alpha }} )}}} )$
. The shape of the profile is an indication of the evenness. A horizontal profile indicates that all species have the same evenness. The less horizontal a profile is, the less evenly species are distributed. The biodiversity package in R statistical software version 2.1.1 was also used to analyse the species quantitative data to perform the cluster analysis comparing the similarity in: (1) species composition between habitat, and in (2) habitat preferences between the stingless bee species (Kindt and Coe, Reference Kindt and Coe2005; Boontop et al., Reference Boontop, Malaipan, Chareansom and Wiwatwittaya2008; Ayuke et al., Reference Ayuke, Karanja, Muya, Musombi, Mungatu and Nyamasyo2009). The degree of similarity of stingless bee species between paired habitats was calculated using Sorensen's similarity coefficient (Cs
):
 $( {{C_s}} ) = \frac{{2C}}{{A + B}}$
and the Jaccard similarity coefficient (Cj
):
 $( {{C_j}} ) = \frac{C}{{A + B - C}}$
, where A and B are the species numbers in samples A and B, respectively, and C is the number of species shared by the two samples (Rasmussen, Reference Rasmussen2009).
Results
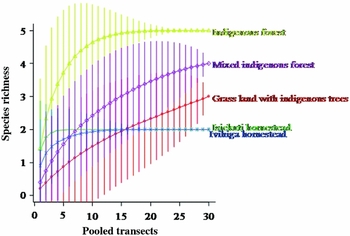
A total of 1030 nests from five meliponine species were located in the 30 ha area we surveyed in each of the six habitats in and around the Kakemega forest. The species richness within the habitats varied from 0 to 5, as indicated by the species accumulation curve (Fig. 2). The indigenous forest accounted for the highest number of species (5), while the lowest number of species (2) was recorded in the homesteads adjacent to the indigenous forest and the mixed indigenous forest. A moderate number of three species was recorded nesting in the grassland with scattered indigenous tree species. The mixed indigenous forest accounted for four species nesting in this habitat. None of the five Meliponini bee species nests were found in the grassland with scattered Eucalyptus sp. trees.
Species accumulation curves comparing total species richness along transects between the habitats. The points in the curve indicate pooled transects and the bars indicate the standard deviation, respectively, of the species richness to pooled transects.

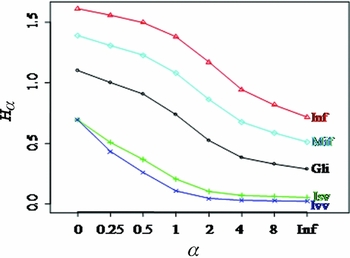
There was a rank ordering of the five habitats from the most diverse to the least diverse for the five stingless bee species (Fig. 3). The indigenous forest was the most diverse in stingless bee species, while homesteads at Ivihiga site were the least diverse. The rank ordering of the five habitats from the most diverse to the least diverse was as follows: indigenous forest > mixed indigenous forest > grassland with indigenous tree species > homesteads at Isiekuti > homesteads at Ivihiga.
Rényi diversity profiles H α as function of alpha indicating differences in diversity within homesteads at Isiekuti (Isv), homesteads at Ivihiga (Ivv), mixed indigenous forest (Mif), indigenous forest (Inf) and grassland with indigenous tree species (Gli). The habitat type with the highest profile is the most diverse in species richness. Profiles of a habitat type whose starting position on the left-hand side is at an upper level have a higher species richness, and habitat types with a lower horizontal profile have a low evenness, and less evenly distributed species are distributed in that habitat.

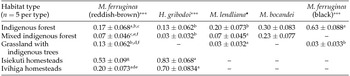
The species fauna recorded varied from one type of habitat to another as indicated in Table 1. In the indigenous forest, all the five Meliponini bee species were nesting, while in the mixed indigenous forest, M. ferruginea (black) was the only species whose nest was not found. In the grassland with scattered indigenous tree species, nests of M. ferruginea (black), M. ferruginea (reddish-brown) and M. lendliana were observed. Hypotrigona gribodoi and M. ferruginea (reddish-brown) were the only species found to be nesting in homesteads adjacent to the indigenous forest and homesteads adjacent to the mixed indigenous forest. Meliponula ferruginea (reddish-brown) was found in all the study habitat types (5), followed by H. gribodoi (four types) and M. lendliana (three types). Meliponula bocandei and M. ferruginea (black) were each found in only two habitat types (Table 1). The indigenous and mixed indigenous forest compared to both homesteads shared only two species, namely M. ferruginea (reddish-brown) and H. gribodoi. However, M. ferruginea (reddish-brown) and M. lendliana were the only species shared between the mixed indigenous forest and the grassland with scattered indigenous tree species. The species M. ferruginea (reddish-brown) was the only shared species within the grassland with indigenous tree species and both homesteads (Table 1).
Stingless bee species fauna: Overall nest abundance per 30 ha within six habitats

Inf, indigenous forest; Ivv, homesteads adjacent to the indigenous forest; Isv, homesteads adjacent to the mixed indigenous forest; Mif, mixed indigenous forest; Gli, grassland with scattered indigenous tree species; and Gle, grassland with scattered Eucalyptus trees.
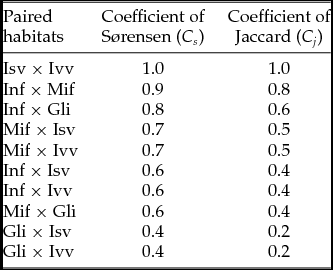
The similarity coefficients of Sørensen and of Jaccard indicate that homesteads adjacent to the indigenous and to the mixed indigenous forest shared exclusively similar species fauna (coefficient = 1.0) (Table 2). The indigenous forest and mixed indigenous forest shared almost similar species fauna with the coefficient of Sørensen equal to 0.9 and the coefficient of Jaccard equal to 0.8. The grassland with scattered indigenous tree species compared to both homesteads shared the least similar species fauna (coefficient of Sørensen 0.4; coefficient of Jaccard 0.2).
Similarity coefficients of Sørensen and Jaccard comparing the degree of similarity in stingless bee fauna between pairs of habitats

Isv, homesteads adjacent to the mixed indigenous forest; Ivv, homesteads adjacent to the indigenous forest; Inf, indigenous forest; Mif, mixed indigenous forest; and Gli, grassland with scattered indigenous tree species.
The predicted probabilities for having a stingless bee species to nest in a specific habitat are summarized in Table 3. The probability of having M. ferruginea (reddish-brown) nesting in the homesteads adjacent to the mixed indigenous forest was significantly higher compared to the other four habitats (χ 2 = 21.3; d.f. = 4, 145; P < 0.001). The probability of having M. bocandei nesting either in the indigenous or mixed indigenous forests was not significantly different (χ 2 = 0.34; d.f. = 1, 58; P > 0.05). For the M. ferruginea (black) species, there was a significantly higher occurrence of nests in the indigenous forest than in the grassland with scattered indigenous trees (χ 2 = 28.18; d.f. = 1, 58; P < 0.001). The occurrence of having a M. lendliana nest in the indigenous forest was significantly higher than in the mixed indigenous forest and in the grassland with scattered indigenous tree species (χ 2 = 5.03; d.f. = 2, 87; P < 0.001). Both homesteads adjacent to the mixed indigenous forest and homesteads adjacent to the indigenous forest had a significantly higher occurrence of H. gribodoi nests (χ 2 = 67.63; d.f. = 3, 116; P < 0.001), whereas no significant difference in the occurrence of nests was observed between both homesteads. Also, no significant difference in the occurrence of H. gribodoi nests was observed between the indigenous forest and the mixed indigenous forest habitats.
Species fauna and predicted probability for the presence of a nest of stingless bee species in each of the habitat types

***Highly significant difference between habitats at P < 0.001. *Significant difference between habitats at P < 0.05. Letters indicate the significant differences between the habitat types.
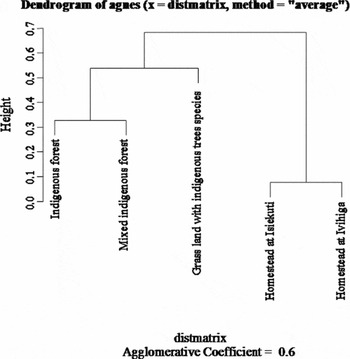
The cluster analysis at 0.40 dissimilarity levels yielded three groups within the habitat types (Fig. 4). Homesteads at Isiekuti and Ivihiga sites were the most similar habitats in species composition at a Bray Curtis ecological distance of 0.077, while the indigenous forest and mixed indigenous forest were similar habitats in stingless bee species composition at a Bray Curtis ecological distance of 0.33.
Dendrogram of UPGMA clustering habitats that are similar in species composition, resulting in three groups at 0.40 dissimilarity level: the homesteads at Isiekuti and Ivihiga sites form one group sharing similar stingless bee species (Bray Curtis ecological distance of 0.077), the indigenous forest and mixed indigenous forest also form one group (Bray Curtis ecological distance of 0.33) and the grassland is the third group.

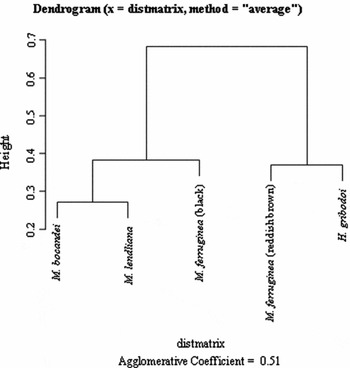
The cluster analysis at 0.38 dissimilarity level resulted in three groups of membership with regard to similar habitat preferences for nesting within the five stingless bee species (Fig. 5). A tendency to share a similar habitat for nesting was observed between M. bocandei and M. lendliana species at a Bray Curtis ecological distance of 0.27. It was also indicated that the stingless bee M. ferruginea (reddish-brown) and H. gribodoi species share similar habitats for nesting at a Bray Curtis ecological distance of 0.37. The cluster analysis indicated that the M. ferruginea (black) species is a divergent species that does not share a similar nesting habitat with any other species at a Bray Curtis ecological dissimilarity level below 0.38.
Dendrogram of UPGMA clustering species with similarity in habitat preferences for nesting, resulting in three groups at 0.38 dissimilarity level: M. bocandei and M. lendliana share similar habitat for nesting (Bray Curtis ecological distance of 0.27), the second group is formed by M. ferruginea (reddish brown) and H. gribodoi species (Bray Curtis ecological distance of 0.37), and the third group is M. ferruginea (black).

Discussion
Species richness and diversity within habitats
Results of this study have shown that a decrease in species richness and diversity was observed for the various habitats compared to the indigenous forest. The indigenous forest had the highest number of species (five species) and was the most diverse in species. The lowest number of species richness (two species) and diversity was recorded in homesteads of both sites. No nest of the five studied species was recorded in the grassland with Eucalyptus sp. This result indicates that forest regeneration by introducing Eucalyptus sp. might negatively affect the community of the studied stingless bee species. Parallel studies in Kanchanaburi Province, Thailand also found a variation in species richness and diversity among four types of forest habitats (Boontop et al., Reference Boontop, Malaipan, Chareansom and Wiwatwittaya2008). Boontop et al. (Reference Boontop, Malaipan, Chareansom and Wiwatwittaya2008) have reported that management practices within tropical areas (such as deforestation and forest regeneration through the introduction of exotic tree species) have been shown to be among the factors destroying bee habitats, which then cause disappearance or reduction of key species. In our study, the indication of the highest number of species (five species) and more diversity in the indigenous forest confirms previous studies that reported that meliponine bees are associated with natural native forest habitats for nesting (Brosi et al., Reference Brosi, Daily, Shih, Oviedo and Duràn2008). The results obtained from the current study are also in agreement with Bommarco et al. (Reference Bommarco, Biesmeijer, Meyer, Potts, Pöyry, Roberts, Steffan Dewenter and Öckinger2010) who observed that natural native habitat loss poses a major threat to biodiversity, as it leads to clear shifts in the species richness and the composition of wild bee communities.
Species fauna and degree of similarity in stingless bee fauna within habitats
The species fauna was similar between both homesteads and forests. In both homesteads, M. ferruginea (reddish-brown) and H. gribodoi were recorded, while between both forests habitat difference was recorded for one species, M. ferruginea (black). The nests of this latter species were recorded in tree cavities of Diospyros abyssinica (Hiern) F. White (1956) (Ericales: Ebenaceae). This latter tree was never found in the homesteads, mixed indigenous forest and grassland with indigenous tree species during our survey.
Studies on meliponine bees in Neotropical regions reported that habitats have an important impact on the natural composition of the stingless bee community structure, which is reflected in their nest abundances (Nates-Parra et al., Reference Nates-Parra, Palacios and Parra2008). In our study, because M. ferruginea (reddish-brown) and H. gribodoi were found nesting in more habitats, this could be an indication that these bee species are cosmopolitan and might easily adapt to nests in any type of disturbed habitat. Winfree et al. (Reference Winfree, Griswold and Kremen2007) reported that some anthropogenic land use might be compatible with the conservation of many, but not all, bee species. This was relevant in our study with H. gribodoi and M. ferruginea (reddish-brown) being the only species that nested in homesteads of both sites, and whose nests mainly occurred in homesteads adjacent to the natural forest and mixed forest habitat.
Predicted probabilities of nest occurrence and similarity in species fauna within habitats
The nest occurrence of each stingless bee species varied between the five stingless bee species and habitats. Our results indicate that differences in habitat type in the Kakamega forest landscape lead to shifts in the nest abundance of the five stingless bee communities. This variation indicates that each species has a habitat and nesting site preference and differences in the availability of nesting site might occur within the studied habitats. According to Velthuis (Reference Velthuis1997) and Pyper (Reference Pyper2001), each species of stingless bee has a preference for specific nesting site and substratum. Limitations in the availability of nesting sites and substrata in a specific habitat have been reported to be one of those factors that affect nest biomass of meliponine bees (Hubbell and Johnson, Reference Hubbell and Johnson1977).
Species with similarity in habitat preferences
A similarity in habitat preference for nesting was observed between paired species, M. bocandei vs M. lendliana and M. ferruginea (reddish-brown) vs H. gribodoi. The stingless bee M. ferruginea (black) was the most divergent species compared to other meliponine species, with no similarity in habitat preference for nesting. These results indicate that the indigenous forest is the most preferred nesting habitat for M. ferruginea (black) in the Kakamega forest.
Conclusion
Our study demonstrates qualitative and quantitative changes in species fauna, nest occurrence, species richness and diversity of five stingless bee species within different types of habitats in the tropical rainforest of Kenya. The natural native indigenous forest had the most diverse community compared to the degraded habitats. There are taxon-specific responses to habitat change, and in our study, there is clear value to conserve the native indigenous forest, particularly due to its ecological and economic importance for meliponine bees. Management, such as planting of trees around the villages that are adjacent to Kakamega forest, has facilitated nesting sites for M. ferruginea and H. gribodoi. This management of the forest has contributed to an increase in nesting sites of these two bee species. Our results corroborate other studies that have found contrasting responses from different meliponine bee groups to anthropogenic disturbance in their habitats. Protection of the five stingless bee species in the wild will require conservation of the natural indigenous forest of Kakamega.
Acknowledgements
We gratefully acknowledge the financial support for this research by the European Union (EU) and the International Fund for Agricultural Development (IFAD) (under the project DCI-FOOD/2013/313-659, grant number TA icipe 819), and icipe core funding from UK Aid from the UK Government, Swedish International Development Cooperation Agency (Sida), the Swiss Agency for Development and Cooperation (SDC), Federal Ministry for Economic Cooperation and Development (BMZ), Germany, Aid for Africa, USA and the Kenyan Government. The views expressed herein do not necessarily reflect the official opinion of the donors. We also acknowledge the Kenya Forest Service for providing us with all the assistance on the ground during the fieldwork. We thank the Kakamega stingless bee farmers’ group, Makuchi Plar farmers’ youth group and Isiekuti organic farming youth group, for their participation during the entire process of data collection.