Introduction
A large body of research has explored functional and structural brain abnormalities associated with major depressive disorder (MDD). Most previous studies examining structural abnormalities in depression have utilized a region-of-interest (ROI) rather than a whole-brain approach. Findings from such studies may be biased towards investigating only a subset of brain regions, such as those that are more easily defined via anatomical scans or those of primary theoretical interest (e.g. amygdala and hippocampus; Koolschijn et al. Reference Koolschijn, van Haren, Lensvelt-Mulders, Hulshoff Pol and Kahn2009; Bora et al. Reference Bora, Fornito, Pantelis and Yucel2012). An important benefit of voxel-based morphometry (VBM) is that it allows for a more comprehensive whole-brain assessment of structural abnormalities without the a priori selection of ROIs (Ashburner & Friston, Reference Ashburner and Friston2000). Structural magnetic resonance imaging (MRI) studies have the additional benefit of facilitating comparison across studies, as they are paradigm-free, unlike functional MRI studies in which cross-study comparisons may be obscured due to differences in the paradigms employed.
A growing number of VBM studies of MDD have been conducted, allowing for the aggregation of findings using meta-analytic methods. Across three separate and recent meta-analyses of VBM studies, the most consistent finding reported was that subjects with MDD had reduced gray matter volume in the anterior cingulate cortex (ACC) relative to those without MDD (Bora et al. Reference Bora, Fornito, Pantelis and Yucel2012; Du et al. Reference Du, Wu, Yue, Li, Liao, Kuang and Gong2012; Lai, Reference Lai2013; for examples of individual studies, see Tang et al. Reference Tang, Wang, Xie, Liu, Li, Su, Liu, Hu, He and Blumberg2007; Treadway et al. Reference Treadway, Grant, Ding, Hollon, Gore and Shelton2009). The ACC is a particularly large and heterogeneous structure in terms of function, receptor architecture and cytology (Vogt et al. Reference Vogt, Vogt, Farber and Bush2005; Palomero-Gallagher et al. Reference Palomero-Gallagher, Mohlberg, Zilles and Vogt2008; Pizzagalli, Reference Pizzagalli2011), and has been subdivided into a more dorsal portion (dorsal ACC; dACC) and a more ventral subregion, the latter of which has been further divided into the rostral ACC (rACC; also referred to as the ‘pregenual’ or ‘perigenual’ ACC) and the subgenual ACC (sgACC; Etkin et al. Reference Etkin, Egner and Kalisch2011). Broadly speaking, a distinction may be made between the more ‘cognitive’ dACC versus the more ‘affective’ ventral subdivision encompassing the rACC and sgACC. Indeed, the ventral portion of the ACC has rich interconnections with limbic and paralimbic structures [e.g. amygdala, nucleus accumbens, orbitofrontal cortex (OFC), periaqueductal gray], whereas the dACC has strong connections with regions in the dorsolateral prefrontal cortex (DLPFC), parietal cortex and supplementary motor areas. Consistent with these differential connectivity patterns, the ventral ACC has been implicated in emotion expression and regulation, as well as assigning emotional valence to both internal and external stimuli. In contrast, the dACC has been associated with the processing of cognitively demanding information and response selection (Etkin et al. Reference Etkin, Egner and Kalisch2011; Pizzagalli, Reference Pizzagalli2011).
Given these patterns of findings, it is interesting to note that gray matter volume reductions in the ACC in MDD subjects seem to be largely concentrated in a relatively focal region of the rACC (Bora et al. Reference Bora, Fornito, Pantelis and Yucel2012), a core hub in Mayberg's limbic–cortical dysregulation model of depression (Mayberg, Reference Mayberg1997). The structural deficit in the rACC observed in MDD is intriguing given that this region has been implicated in cognitive and emotional processes that are believed to be abnormal in many depressed individuals. These include: (1) emotion regulation and assigning emotional valence to stimuli (Pizzagalli, Reference Pizzagalli2011; D'Avanzato et al. Reference D'Avanzato, Joormann, Siemer and Gotlib2013); (2) self-referential processing (Northoff et al. Reference Northoff, Heinzel, de Greck, Bermpohl, Dobrowolny and Panksepp2006; Yoshimura et al. Reference Yoshimura, Ueda, Suzuki, Onoda, Okamoto and Yamawaki2009); (3) inhibitory processes (e.g. Bush et al. Reference Bush, Luu and Posner2000; Shafritz et al. Reference Shafritz, Collins and Blumberg2006; Eugene et al. Reference Eugene, Joormann, Cooney, Atlas and Gotlib2010); (4) error processing (e.g. Holmes et al. Reference Holmes, Bogdan and Pizzagalli2010; Santesso et al. Reference Santesso, Bogdan, Birk, Goetz, Holmes and Pizzagalli2012); and (5) optimistic biases (i.e. relatively high probability estimates of positive events occurring to oneself compared with others; Sharot et al. Reference Sharot, Riccardi, Raio and Phelps2007; Blair et al. Reference Blair, Otero, Teng, Jacobs, Odenheimer, Pine and Blair2013). Indeed, hyper-responsiveness of this region has been shown to correlate with subclinical depressive mood in adolescent children (Killgore & Yurgelun-Todd, Reference Killgore and Yurgelun-Todd2006). It is important to note that in addition to ACC abnormalities, other areas found to have reduced gray matter volume within MDD subjects in the above-mentioned meta-analyses include the middle and inferior frontal gyrus, hippocampus and thalamus (Kim et al. Reference Kim, Hamilton and Gotlib2008; Vasic et al. Reference Vasic, Walter, Hose and Wolf2008; Zou et al. Reference Zou, Deng, Li, Zhang, Jiang, Huang and Sun2010; Wagner et al. Reference Wagner, Koch, Schachtzabel, Schultz, Sauer and Schlsser2011; Du et al. Reference Du, Wu, Yue, Li, Liao, Kuang and Gong2012), as well as the DLPFC and dorsomedial prefrontal cortex (Bora et al. Reference Bora, Fornito, Pantelis and Yucel2012). Given that the thalamus connects the cortex to negative emotion-generating limbic structures such as the amygdala (Price & Drevets, Reference Price and Drevets2009), relatively reduced thalamic gray matter volume may help account for deficits in top-down regulation of negative affect among individuals more prone to experiencing depressive symptoms. Moreover, reduced hippocampal volume in depression may be attributable to stress-related or neurotoxic processes associated with cumulative exposure to stress and depressive symptomatology (MacQueen et al. Reference MacQueen, Campbell, McEwen, Macdonald, Amano, Joffe, Nahmias and Young2003; Warner-Schmidt & Duman, Reference Warner-Schmidt and Duman2006).
As is the case with the bulk of functional MRI research, studies investigating structural brain abnormalities in depression have typically employed a categorical rather than dimensional approach to conceptualizing depression. Namely, studies have usually compared a group of subjects diagnosed with MDD, as defined by current Diagnostic and Statistical Manual of Mental Disorders (DSM) criteria, with a group of individuals who do not meet MDD diagnostic criteria [also see the International Classification of Diseases (ICD) diagnostic system; World Health Organization, 1993]. The extent to which depressive symptoms – irrespective of DSM-defined MDD status – are linearly related to gray matter volume reductions in theoretically important brain regions (e.g. the ACC) is not well understood. Indeed, the National Institute of Mental Health (NIMH), through their Research Domain Criteria (RDoC) initiative, has encouraged a dimensional approach to the study of psychopathology as opposed to an over-reliance on traditional diagnostic categories (e.g. see NIMH funding opportunity ‘Dimensional Approaches to Research Classification in Psychiatric Disorders’ no. RFA-MH-13-080). Previous studies comparing dimensional versus categorical models of depression, including findings from taxometric analyses, have tended to support dimensional conceptualizations of depressive symptoms (Prisciandaro & Roberts, Reference Prisciandaro and Roberts2009), and it is likely that such approaches may ultimately lead to a more valid understanding of the underlying neurobiological basis of depression than research focused on categorical diagnostic distinctions.
It is also important to note that subthreshold levels of depressive symptoms (i.e. severity levels below DSM criteria) have been found to be associated with a range of negative outcomes (Cuijpers et al. Reference Cuijpers, de Graaf and van Dorsselaer2004; Fergusson et al. Reference Fergusson, Horwood, Ridder and Beautrais2005), including a significantly increased risk of developing MDD (Klein et al. Reference Klein, Glenn, Kosty, Seeley, Rohde and Lewinsohn2013). These findings highlight the importance of investigating the neurobiological underpinnings of subclinical levels of depressive symptoms. A few previous studies have explored structural abnormalities in subclinical depression, but these studies differed widely in study samples (e.g. youth versus the elderly), analytic strategy (ROI versus whole-brain approach, group comparisons versus dimensional analyses) and depression measures employed. For example, in a ROI-based study focused on rACC volumes in children and adolescents (aged 7–17 years) with no history of MDD or psychiatric disorder, Boes et al. (Reference Boes, McCormick, Coryell and Nopoulos2008) found that males with depressive symptoms had lower rACC volumes bilaterally than males without depressive symptoms. This pattern was not observed in females. In addition, in a recent VBM study comparing adults with elevated, but subthreshold, levels of depressive symptoms versus those with no depressive symptoms, Hayakawa et al. (Reference Hayakawa, Sasaki, Takao, Mori, Hayashi, Kunimatsu and Ohtomo2013) reported that subclinically depressed females had smaller gray matter volume in the bilateral ACC and in the right rectal gyrus. The pattern was not observed in males. There has also been a series of studies examining structural abnormalities in elderly populations with subthreshold depression (e.g. Taki et al. Reference Taki, Kinomura, Awata, Inoue, Sato, Ito and Fukuda2005; Dotson et al. Reference Dotson, Davatzikos, Kraut and Resnick2009; Ries et al. Reference Ries, Wichmann, Bendlin and Johnson2009), with mixed findings regarding the ACC (Ries et al. Reference Ries, Wichmann, Bendlin and Johnson2009). None of the above-mentioned studies employed the commonly used Beck Depression Inventory (BDI; Beck & Steer, Reference Beck and Steer1993; Beck et al. Reference Beck, Steer and Brown1996).
In line with the NIMH's RDoC initiative, the current study examines – in a dimensional rather than categorical manner – the association between gray matter volume and depressive symptoms in a non-clinical sample. We employed a whole-brain VBM regression approach with a sample of adults (aged 18–45 years) deemed free of any history of DSM-IV Axis I diagnoses. Importantly, to examine the consistency of any emerging findings, two separate instruments were used to assess depressive symptoms, including the commonly used BDI and the Depression subscale of the Personality Assessment Inventory (PAI-DEP; Morey, Reference Morey1991). The PAI-DEP was selected in addition to the BDI for several reasons. First, the BDI, like the Hamilton Rating Scale for Depression (Hamilton, Reference Hamilton1960), tends to exhibit very low mean scores and little variability in healthy samples. In contrast, the PAI-DEP includes items intended to assess the full range of depressive symptoms and with greater variability of scores across non-clinical samples (Morey, Reference Morey2007). Moreover, whereas the BDI has a relatively heavy representation of cognitive aspects of depression, the PAI-DEP was designed to tap cognitive, affective and physiological symptoms of depression with generally equal weighting across these three domains.
Informed by the literature discussed above, we hypothesized that the severity of mild depressive symptoms, even in a healthy subclinical population, would be associated with reduced gray matter volume in the rACC, hippocampus, thalamus, as well as the DLPFC and dorsomedial prefrontal cortex.
Method
Participants
A total of 54 healthy participants (28 females), aged 18 to 45 years (mean = 30.9 years, s.d. = 8.13 years), were recruited from the greater Boston region through flyers posted in the area and from Internet advertisements. The sample was 69.1% Caucasian, 16.4% African–American, 9.1% Asian, 1.8% other, and 3.6% ‘more than one race’. In addition, 3.6% classified themselves as Hispanic. All participants identified English as their primary language. A trained Bachelor's-level technician screened all participants for evidence of mental disorders and medical conditions using a structured series of questions adapted from the Structured Clinical Interview for DSM-IV, text revision (SCID-I; First et al. Reference First, Spitzer, Gibbon and Williams2001). All participants included in the current study were determined to be free of any history of DSM-IV Axis I mental disorders, excessive substance use, drug or alcohol treatment, or severe medical or neurological conditions. The current study was embedded within a larger study on the neural correlates of emotional intelligence in which subjects completed a battery of self-report measures and behavioral tasks. Unrelated findings emerging from that larger study have been reported elsewhere (Killgore et al. Reference Killgore, Schwab, Kipman, DelDonno and Weber2012a , Reference Killgore, Schwab and Weiner b , Reference Killgore, Schwab, Weber, Kipman, Deldonno, Weiner and Rauch2013; Webb et al. Reference Webb, Schwab, Weber, DelDonno, Kipman, Weiner and Killgore2013) and will not be discussed further here. To reduce subject burden, self-report measures (including the BDI and PAI) were administered 1 day after the MRI scan.
BDI
The BDI (Beck & Steer, Reference Beck and Steer1993; Beck et al. Reference Beck, Steer and Brown1996) is a commonly used 21-item self-report measure of depressive symptoms with strong psychometric properties (Beck et al. Reference Beck, Steer and Carbin1988). The BDI has been shown to have acceptably high internal consistency reliability in psychiatric (α = 0.86; Beck et al. Reference Beck, Steer and Carbin1988) and non-clinical (α = 0.88; Killgore, Reference Killgore1999) samples.
Personality Assessment Inventory (PAI)
The PAI personality assessment (Morey, Reference Morey1991) contains 344 statements that are rated using one of four response options (‘false, not at all true’, ‘slightly true’, ‘mainly true’, ‘very true’). The measure yields 11 clinical subscales (Somatic Complaints, Anxiety, Anxiety-Related Disorders, Depression, Mania, Paranoia, Schizophrenia, Borderline Features, Antisocial features, Drug-Related Problems, Alcohol-Related Problems). Given the current study's focus on depressive symptoms, we restricted our analyses to the Depression subscale of the PAI (PAI-DEP). Raw scores were converted into T scores. The PAI-DEP scale shows high internal consistency reliability for clinical (α = 0.87) and non-clinical (α = 0.93) samples (Morey, Reference Morey2007). The use of the PAI, in addition to the BDI, allows us to test the consistency of our findings across two measures of depression, which sample somewhat different aspects of depression (i.e. whereas the BDI weights cognitive items more heavily, the PAI is designed to tap cognitive, affective and physiological symptoms of depression with generally equal weighting across these three domains).
MRI parameters
Structural magnetic resonance images were acquired at 3.0 T using a 12-channel head coil (Siemens Tim Trio; Germany) and a T1-weighted three-dimensional magnetization-prepared rapid acquisition with gradient echo (MPRAGE) sequence using the following parameters: repetition time = 2.1 s; echo time = 2.25 ms; flip angle = 12°; 128 sagittal slices; 256 × 256 matrix; in-plane resolution = 1 × 1×1 mm; slice thickness = 1.33 mm.
VBM
Preprocessing of structural images was conducted using the VBM8 toolbox (http://dbm.neuro.uni-jena.de/vbm.html) in SPM8 (Wellcome Department of Imaging Neuroscience Group, UK; http://www.fil.ion.ucl.ac.uk/spm). The VBM8 default settings were used (i.e. modulated VBM – gray matter volume was corrected for total intracranial volume). Each structural image was DARTEL-normalized (diffeomorphic anatomical registration through exponentiated lie algebra) to Montreal Neurological Institute (MNI) space and subsequently segmented into gray matter, white matter and cerebrospinal fluid using a fully automated algorithm within SPM8. Standard quality checks of segmentation and sample homogeneity were conducted, before normalized gray matter images were smoothed with an 8 mm full-width at half-maximum (FWHM) Gaussian kernel. In other words, the data were preprocessed such that the dependent variable of interest was the local concentration of gray matter at each local voxel without concern for differences in morphological shape (Ashburner & Friston, Reference Ashburner and Friston2000).
Statistical analysis
Scores on both depression scales were initially tested for normality. To assess the severity of skew and kurtosis, z scores were computed (Field, Reference Field2009a ). Consistent with prior work examining the distribution of BDI scores in the population (Veerman et al. Reference Veerman, Dowrick, Ayuso-Mateos, Dunn and Barendregt2009), scores in the present sample were positively skewed (z = 4.10, p < 0.001; Kline, Reference Kline2005; Field, Reference Field2009b ). Accordingly, a square-root transformation was applied to reduce the positive skew (transformed BDI, z = 0.861, p > 0.05). For simplicity, the term BDI is used henceforth, rather than repeating the more accurate but unwieldy term ‘square-root transformed BDI’.
Normalized smoothed gray matter images were entered into a series of three random-effects multiple regression analyses in SPM8. A non-stationary cluster extent correction was implement in SPM8 according to the random field theory (RFT) framework (Hayasaka et al. Reference Hayasaka, Phan, Liberzon, Worsley and Nichols2004). In the first regression, we tested the association between BDI scores and voxelwise gray matter volume. Normalized smoothed gray matter images were entered as the dependent variable into a whole-brain general linear model. For statistical inference, a whole-brain false discovery rate (FDR)-corrected height threshold of p < 0.05 was applied. A cluster extent threshold of k ⩾81 (i.e. determined statistically as the number of voxels per cluster that would be expected by chance based on the theory of Gaussian random fields applied to this analysis as provided in standard VBM8 output) was also applied for the purpose of reducing noise in the images and to minimize reporting of clusters of little interest, but was not considered for statistical inference. For the second regression, we conducted a similar analysis with PAI-DEP as the covariate of interest (height threshold of FDR p < 0.05 for statistical inference, with an empirically derived cluster extent of k ⩾65). Finally, to examine the overlap in gray matter volume correlations across the BDI and PAI-DEP analyses, the activation clusters obtained from the first regression analysis (i.e. BDI) were used as a region of interest (ROI) mask in conjunction with the output from the second regression (i.e. PAI-DEP; height threshold FDR p < 0.05, cluster extent k ⩾65). Thus, the resulting findings from the latter analysis reflect overlapping regions where gray matter volume correlated significantly with self-reported depression symptoms on both the BDI and PAI-DEP scales. Age and gender were included as nuisance covariates in all analyses.
Results
The mean raw BDI score was 3.89 (s.d. = 4.56, range = 0–17), with seven participants scoring above the suggested clinical criterion for ‘minimal depression’ (i.e. total BDI score >9; Beck et al. Reference Beck, Steer and Brown1996). The mean PAI-DEP score was 46.20 (s.d. = 7.97, range = 36–71)Footnote 1 Footnote †. The Pearson correlation between the BDI and PAI-DEP in the current sample was r = 0.67 (p < 0.001).
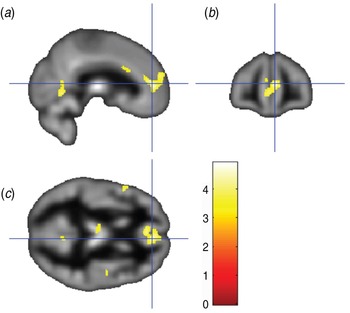
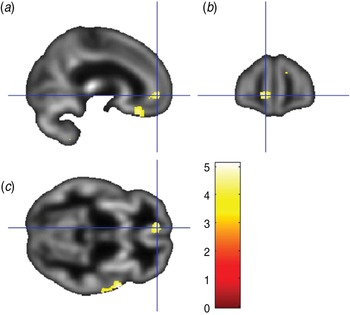
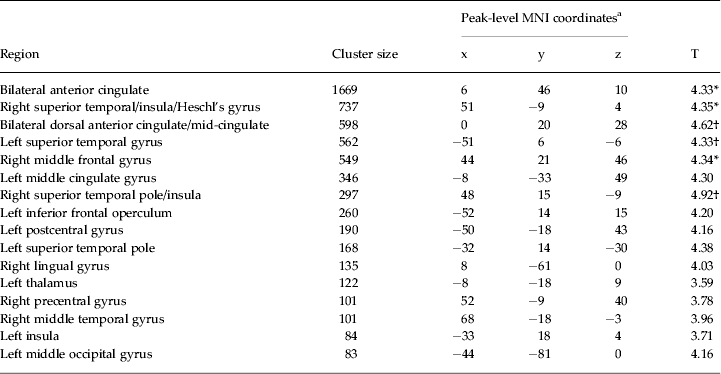
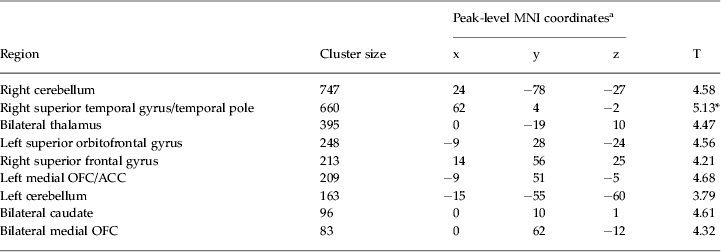
As detailed in Table 1, relatively higher BDI scores were associated with reduced gray matter volume in 16 clusters, including: (i) bilateral anterior cingulate, bilateral medial frontal cortex and left medial OFC (see Fig. 1); (ii) bilateral anterior/mid-cingulate; (iii) left thalamus; and (iv) left insula. As shown in Table 2, relatively higher PAI-DEP scores were associated with reduced gray matter volume in nine clusters, including: (i) left anterior cingulate and left medial OFC (see Fig. 2); (ii) bilateral medial OFC; and (iii) bilateral thalamus.
Sagittal view (a), coronal view (b) and axial view (c) of the anterior cingulate/medial orbitofrontal cortex cluster (overlaid on sample-specific T1 mean image) that was negatively correlated with depressive symptoms on the Beck Depression Inventory. Montreal Neurological Institute (MNI) coordinates x = 6, y = 46, z = 10; cluster size = 1669 voxels.

Sagittal view (a), coronal view (b) and axial view (c) of the left anterior cingulate/medial orbitofrontal cortex cluster (overlaid on sample-specific T1 mean image) that was negatively correlated with depressive symptoms on the Depression subscale of the Personality Assessment Inventory. Montreal Neurological Institute (MNI) coordinates x = − 9, y = 51, z = − 5; cluster size = 209 voxels.

Brain regions with reduced gray matter volume associated with higher Beck Depression Inventory scores

MNI, Montreal Neurological Institute.
a All false discovery rate-corrected p < 0.05; k ⩾81.
* p < 0.05, † p < 0.10 cluster level, family-wise error corrected.
Brain regions with reduced gray matter volume associated with higher scores on the Depression subscale of the Personality Assessment Inventory

MNI, Montreal Neurological Institute; OFC, orbitofrontal cortex; ACC, anterior cingulate cortex.
a All false discovery rate-corrected p < 0.05; k ⩾65.
* p < 0.05, † p < 0.10 cluster level, family-wise error corrected.
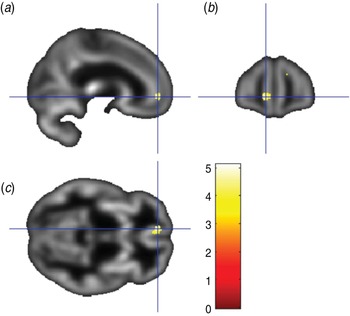
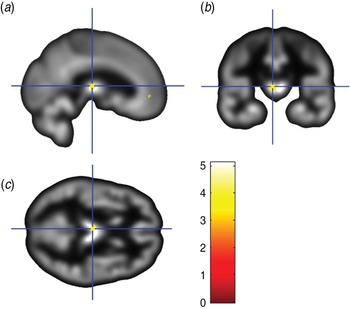
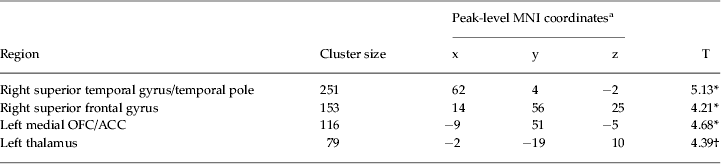
The conjunction between the two primary analyses was used to identify the regions showing common overlap between the gray matter volume correlations for the two depression measures used in the current study. As shown in Table 3, this analysis showed that the BDI and PAI-DEP scores were both associated with reduced gray matter volume in four common regions: (i) left medial OFC and anterior cingulate (Fig. 3); (ii) left thalamus (Fig. 4); (iii) right superior medial frontal gyrus/superior frontal gyrus; and (iv) right superior temporal gyrus extending to the superior temporal pole.
Sagittal view (a), coronal view (b) and axial view (c) of the results of a conjunction analysis showing a cluster where gray matter volume in the left rostral anterior cingulate/medial orbitofrontal cortex (overlaid on sample-specific T1 mean image) was negatively correlated with depressive symptoms on both the Beck Depression Inventory and Depression subscale of the Personality Assessment Inventory. Montreal Neurological Institute (MNI) coordinates x = − 9, y = 51, z = − 5; cluster size = 116 voxels.

Sagittal view (a), coronal view (b) and axial view (c) of the results of a conjunction analysis showing a cluster where gray matter volume in the left thalamus (overlaid on sample-specific T1 mean image) was negatively correlated with depressive symptoms on both the Beck Depression Inventory and Depression subscale of the Personality Assessment Inventory. Montreal Neurological Institute (MNI) coordinates x = − 2, y = 19, z = 10; cluster size = 79 voxels.

Brain regions with reduced gray matter volume associated with higher scores on both the Beck Depression Inventory and the Depression subscale of the Personality Assessment Inventory

MNI, Montreal Neurological Institute; OFC, orbitofrontal cortex; ACC, anterior cingulate cortex.
a All false discovery rate-corrected p < 0.05; k ⩾65.
* p < 0.05, † p < 0.10 cluster level, family-wise error corrected.
Discussion
The present study complements prior research on structural brain abnormalities in depression. Specifically, previous studies examining structural deficits in depression have typically relied on categorical comparisons of subjects diagnosed with MDD versus healthy controls. The extent to which depressive symptoms in individuals who do not meet DSM criteria for MDD are linearly related to structural differences in key brain regions is not well understood. Inspired by the NIMH's RDoC initiative, which highlights dimensional/continuous – rather than DSM-based categorical – conceptualization of psychopathology, we examined the linear associations between gray matter volume and depressive symptoms in a sample of adults deemed free of any history of DSM-IV Axis I diagnoses. Paralleling findings from prior studies employing a categorical (i.e. MDD versus healthy controls) analytic approach, we found that relatively higher depressive symptoms were associated with reduced gray matter volume in the left rACC (extending into the medial OFC). Perhaps the most consistently reported finding in the existing literature is that subjects with MDD have reduced gray matter volume in the ACC relative to those without MDD (for recent meta-analytic reviews, see Bora et al. Reference Bora, Fornito, Pantelis and Yucel2012; Du et al. Reference Du, Wu, Yue, Li, Liao, Kuang and Gong2012; Lai, Reference Lai2013). The current findings extend prior work by suggesting that reduced ACC/OFC gray matter volume can be observed even in a sample that does not meet DSM criteria for MDD, but who nevertheless report relatively elevated levels of depressive symptoms. In addition, we also observed an association between relatively elevated depressive symptoms and reduced gray matter volume in the left thalamus, as well as the right superior medial frontal gyrus/superior frontal gyrus, and right superior temporal gyrus extending to the superior temporal pole. The fact that this finding emerged across both of our depressive symptom measures, including the commonly used BDI, as well as the depression subscale of the PAI (PAI-DEP), suggests that these findings probably reflect true and robust associations between gray matter and depressive symptoms within the subclinical range.
Regarding our ACC finding, it is interesting to note that gray matter volume reductions were concentrated in the rACC. The rACC has been implicated in a range of cognitive/affective functions, including: (1) optimistic biases (e.g. Blair et al. Reference Blair, Otero, Teng, Jacobs, Odenheimer, Pine and Blair2013); (2) error processing (e.g. Holmes et al. Reference Holmes, Bogdan and Pizzagalli2010; Santesso et al. Reference Santesso, Bogdan, Birk, Goetz, Holmes and Pizzagalli2012); (3) self-referential processing (Northoff et al. Reference Northoff, Heinzel, de Greck, Bermpohl, Dobrowolny and Panksepp2006; Yoshimura et al. Reference Yoshimura, Ueda, Suzuki, Onoda, Okamoto and Yamawaki2009); (4) inhibitory processes (e.g. Bush et al. Reference Bush, Luu and Posner2000; Shafritz et al. Reference Shafritz, Collins and Blumberg2006; Eugene et al. Reference Eugene, Joormann, Cooney, Atlas and Gotlib2010); and (5) regulation of emotional conflict and dampening of amygdala hyperactivity (Etkin et al. Reference Etkin, Egner, Peraza, Kandel and Hirsch2006). Given these patterns of findings, one could speculate that structural abnormalities in the rACC in part underlie the biased information processing and negative maladaptive cognitive features described in the cognitive model of depression (Beck & Alford, Reference Beck and Alford2009; DeRubeis et al. Reference DeRubeis, Webb, Tang, Beck and Dobson2010). More specifically, to the extent that the rACC does play a role in the aforementioned functions, relatively reduced gray matter volume in this region may help account for the depressogenic, cognitive features of depression, including: (1) pessimistic (rather than optimistic) biases (e.g. Strunk et al. Reference Strunk, Lopez and DeRubeis2006); (2) hypersensitivity to perceived errors and negative feedback (e.g. Elliott et al. Reference Elliott, Sahakian, Michael, Paykel and Dolan1998; Pizzagalli et al. Reference Pizzagalli, Peccoralo, Davidson and Cohen2006); (3) maladaptive self-referential cognitive processes (e.g. Nolen-Hoeksema, Reference Nolen-Hoeksema1991; Nolen-Hoeksema et al. Reference Nolen-Hoeksema, Wisco and Lyubomirsky2008; Pizzagalli, Reference Pizzagalli2011); (4) difficulties inhibiting negative information (e.g. Goeleven et al. Reference Goeleven, De Raedt, Baert and Koster2006); and (5) emotion regulation deficits (D'Avanzato et al. Reference D'Avanzato, Joormann, Siemer and Gotlib2013). These abnormal cognitive and emotion regulatory features of depression do not appear to be categorical in nature (i.e. present in MDD, yet absent in those who do not meet DSM criteria for the disorder). Rather, behavioral and neural findings suggest that at least some of these features are linearly related to depressive symptoms across a broad range of severity, from no or very low levels of depressive symptoms to very high levels (e.g. Joormann, Reference Joormann2004; Pizzagalli et al. Reference Pizzagalli, Peccoralo, Davidson and Cohen2006; Strunk et al. Reference Strunk, Lopez and DeRubeis2006). Overall, and consistent with the NIMH's RDoC initiative, these findings may highlight the limitations of restricting the study of abnormal cognitive, emotional and behavioral processes in depression to DSM-based categorical comparisons, and the need for additional research using dimensional/continuous conceptual and analytic approaches.
Although perhaps not as consistently reported as rACC findings, prior studies have also identified gray matter reductions in the thalamus among MDD subjects (Bielau et al. Reference Bielau, Trubner, Krell, Agelink, Bernstein, Stauch and Baumann2005; Kim et al. Reference Kim, Hamilton and Gotlib2008; Vasic et al. Reference Vasic, Walter, Hose and Wolf2008; Lee et al. Reference Lee, Tae, Yoon, Lee, Paik, Son and Ham2011). The current study suggests that reductions in thalamic gray matter volume can also be observed in individuals with subclinical, yet relatively elevated, levels of depressive symptoms. The latter finding is intriguing given that the thalamus connects the cortex to negative emotion-generating limbic structures such as the amygdala (Price & Drevets, Reference Price and Drevets2009). Thus, relatively reduced thalamic gray matter volume, coupled with volumetric reductions in the rACC, may also help account for the deficits in top-down regulation of negative emotions among individuals more prone to experiencing depressive symptoms.
In addition, previous depression studies have also reported volume reductions in the superior temporal gyrus/temporal pole (e.g. Caetano et al. Reference Caetano, Hatch, Brambilla, Sassi, Nicoletti, Mallinger, Frank, Kupfer, Keshaven and Soares2004; Abe et al. Reference Abe, Yamasue, Kasai, Yamada, Aoki, Inoue, Takei, Suga, Matsuo, Kato, Masutani and Ohtomo2010) and superior frontal gyrus (e.g. Serra-Blasco et al. Reference Serra-Blasco, Portella, Gómez-Ansón, de Diego-Adeliño, Vives-Gilabert, Puigdemont, Granell, Santos, Alvarez and Pérez2013). Interestingly, Caetano et al. (Reference Caetano, Hatch, Brambilla, Sassi, Nicoletti, Mallinger, Frank, Kupfer, Keshaven and Soares2004) found that right superior temporal gyrus volume was inversely correlated with length of depression illness. Similarly, the findings of Serra-Blasco et al. (Reference Serra-Blasco, Portella, Gómez-Ansón, de Diego-Adeliño, Vives-Gilabert, Puigdemont, Granell, Santos, Alvarez and Pérez2013) revealed that participants who suffered from chronic, treatment-resistant depression exhibited the smallest volumes in frontotemporal regions. It is tempting to attribute such volumetric reductions to neurotoxic effects of stress and depression accumulating over time. However, conclusions regarding the direction of effects are necessarily tempered when cross-sectional designs are employed.
It may be that reduced gray matter volume in the regions highlighted in the current study (e.g. rACC, thalamus) increase the risk of experiencing depressive symptoms. Conversely, these structural differences may also reflect the neurotoxic effects of prior depressive symptoms and stress. It should be noted that we intentionally restricted our sample to those without prior episodes of depression. Nevertheless, reduced gray matter volume could of course still be due to cumulative exposure to subthreshold depressive symptoms and neurotoxic stress processes. Methodologically sound longitudinal studies are needed to disentangle causal direction and test whether or not reduced gray matter volume in certain brain regions (e.g. rACC) prospectively predicts depression onset, and/or whether structural abnormalities are a consequence of depression due to particular neuropathological processes associated with the disorder. Longitudinal studies could help delineate factors that predict the development of these structural brain abnormalities over time. For example, prior research has found that smaller ACC volumes are associated with retrospective reports of early life stressors (Cohen et al. Reference Cohen, Grieve, Hoth, Paul, Sweet, Tate and Williams2006). This finding highlights the possible neurotoxic effects of early life stress on the developing brain. Ideally, however, given that current symptomatology may bias recall of early life stressors (e.g. Southwick et al. Reference Southwick, Morgan, Nicolaou and Charney1997), prospective longitudinal, rather than retrospective studies would be needed to more conclusively establish the link between early life stress and structural brain abnormalities, ideally complementing self-report measures of stressors with more ‘objective’ measures (e.g. assessments of stress hormones).
A strength of the current study is that we tested the consistency of our findings across two separate measures of depressive symptoms. In addition, in contrast to many prior studies, we used a whole-brain VBM approach, rather than an ROI approach, the latter of which may bias investigators towards examining only a subset of brain regions and possibly ignoring other relevant regions (Ashburner & Friston, Reference Ashburner and Friston2000). However, despite these strengths, several limitations of the current study should be noted. As discussed above, our findings were cross-sectional in nature and we cannot draw strong inferences regarding causal direction between structural brain differences and depressive symptoms. Moreover, our study focused on a sample without a history of Axis I pathology. It will be important for future studies to examine the full continuum from no depression to very severe levels of depressive symptoms, to fully examine the extent to which depressive symptoms are linearly related with structural brain differences. In addition, given our non-clinical sample, variability in depression scores was, as expected, limited. Thus, restriction in the range of depression scores may have limited our ability to detect significant effects in other brain regions. It should be noted that the current findings indicate that we did have sufficient variability to detect reduced gray matter volume in a number of regions, across two separate depression measures.
Acknowledgements
This study was supported by a US Army Medical Research Acquisition Activity (USAMRAA) grant (no. W81XWH-09-1-0730 to W.D.S.K.). The grant provided support for subject remuneration, scan costs, supplies and salary.
The authors assert that all procedures contributing to this work comply with the ethical standards of the relevant national and institutional committees on human experimentation and with the Helsinki Declaration of 1975, as revised in 2008.
Declaration of Interest
None.