Implications
The ability of individual nutritional strategies to reduce methane (CH4) emissions from cattle is limited by potential adverse consequences such as reduction in fibre digestion for increased lipid or toxicity for added nitrate. The reduction in CH4 emissions when dietary nitrate was fed was not influenced by the presence of lipid. Combining different nutritional strategies to mitigate CH4 emissions could be a useful means of achieving reductions in CH4 while minimising any adverse effects on cattle health and performance.
Introduction
Methane emissions arising from the enteric fermentation of feed by ruminant livestock contribute significantly to greenhouse gas emissions. In the United Kingdom (Department of Energy and Climate Change, 2016), enteric CH4 emissions were estimated to account for 23.8 Mt carbon dioxide equivalents or 48% of total greenhouse gas emissions from the agriculture sector in 2014. Strategies to mitigate CH4 emissions have been classified (Hristov et al., Reference Hristov, Oh, Lee, Meinen, Montes, Ott, Firkins, Rotz, Dell, Adesogan, Yang, Tricarico, Kebreab, Waghorn, Dijkstra and Oosting2013) as addressing enteric fermentation, manure management or animal husbandry (where animal husbandry included genetics, health and fertility).
Many nutritional strategies which target CH4 emissions have been tested but convincing evidence for long-term efficacy in vivo for many is lacking. Increasing dietary lipid and inclusion of nitrate in the diet are effective mitigation strategies (Hristov et al., Reference Hristov, Oh, Lee, Meinen, Montes, Ott, Firkins, Rotz, Dell, Adesogan, Yang, Tricarico, Kebreab, Waghorn, Dijkstra and Oosting2013) and their use has been recently reviewed (Martin et al., Reference Martin, Morgavi and Doreau2010; Lee and Beauchemin, Reference Lee and Beauchemin2014; Patra, Reference Patra2014; Yang et al., Reference Yang, Rooke, Cabeza and Wallace2016). However, the extent to which either strategy can be included in the diet is limited by potential adverse effects: a reduction in fibre digestion and consequently feed intake from increased lipid in the diet and nitrate/nitrite toxicity from adding nitrate. As the mechanisms by which lipid (reduction in fermentable carbohydrate intake, inhibition of micro-organisms; Martin et al., Reference Martin, Morgavi and Doreau2010; Patra, Reference Patra2013) and nitrate (alternative hydrogen acceptor; Yang et al., Reference Yang, Rooke, Cabeza and Wallace2016) reduce CH4 emissions are different, it may be practically useful to combine these mitigation strategies.
Klop et al. (Reference Klop, Hatew, Bannink and Dijkstra2016) fed lipid and nitrate alone or in combination to dairy cows and found no evidence for any negative interactions between strategies for either CH4 emissions or animal performance. Similarly in non-lactating dairy cows (Guyader et al., Reference Guyader, Eugène, Doreau, Morgavi, Gérard, Loncke and Martin2015), there were no interactions between nitrate and tea saponins. Interactions between mitigation strategies have not been explored to date in beef cattle. The main hypotheses addressed in this study were that the effects on CH4 emissions of increasing lipid or including nitrate in diets of finishing beef cattle would be additive and that there would be no adverse effects upon animal performance. The nutritional strategies used were based on those reported previously (Troy et al., Reference Troy, Duthie, Hyslop, Roehe, Ross, Wallace, Waterhouse and Rooke2015; Duthie et al., Reference Duthie, Rooke, Troy, Hyslop, Ross, Waterhouse and Roehe2016).
Material and method
This experiment was conducted at Scotland’s Rural College (SRUC) Beef and Sheep Research Centre in Edinburgh in 2014. The experimental protocol was approved by SRUC’s Animal Welfare and Ethical Review Body, the Animal Experiments Committee and was conducted in accordance with the requirements of the UK Animals (Scientific Procedures) Act, 1986.
Experimental design, animals and diets
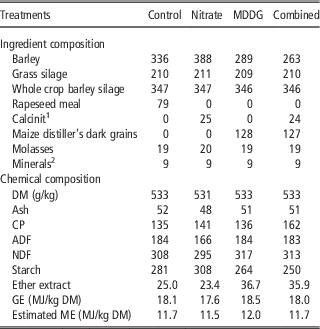
The experiment was a 2×4 factorial (breed×dietary treatment) design. The basal diet contained 550 forage (grass and whole crop barley silages) : 450 concentrate (g/kg dry matter (DM)). The four dietary treatments were assigned according to a 2×2 factorial arrangement where the control diet (CTL) contained rapeseed meal as the main protein source which was replaced either with nitrate (NIT, 21.5 g nitrate/kg DM) or maize distillers dark grains (MDDG) to increase diet lipid concentration or both nitrate and MDDG (COMB). Forage to concentrate ratio was maintained constant by varying the amounts of barley included in the diets. Nitrate was added in the form of calcium ammonium nitrate (Calcinit; Yara, Oslo, Norway). The ingredient and nutritional composition of each dietary treatment are given in Table 1. The steers were offered diets ad libitum. Feed samples were analysed for DM, ash, CP, ADF, NDF, starch and ether extract (Ministry of Agriculture Fisheries and Food, 1992), and gross energy (GE) by adiabatic bomb calorimetry.
Ingredient and chemical composition (g/kg dry matter (DM)) of the experimental diets

MDDG=maize distillers dark grains; ME=metabolisable energy; GE=gross energy.
1 Contained (g/kg DM): nitrate, 757; Ca, 225.
2 Contained (mg/kg): Fe, 6036; Mn, 2200; Zn, 2600; Iodine, 200; Co, 90; Cu, 2500; Se 30; (μg/kg): vitamin E, 2000; vitamin B12, 1000; vitamin A, 151 515; vitamin D, 2500.
The 80 cross-bred steers (13 to 15 months of age at start of performance trial) used were from a rotational cross between pure-bred Aberdeen Angus or Limousin sires and cross-bred dams of those genotypes and are referred to as AAx and LIMx, respectively. Thus, 20 steers (10 of each breed) were allocated to each dietary treatment. To avoid animals not adapted to nitrate gaining access to dietary nitrate, each treatment was allocated to one pen (four pens in total). Treatments were balanced for sire within each breed and BW at the start of the experiment. Fresh water was provided ad libitum using a water trough, and diets were offered using 32 electronic feeders (eight per pen, HOKO; Insentec, Marknesse, The Netherlands) to record individual animal feed intakes. All steers were bedded on wood fibre and sawdust to ensure that consumption of bedding did not contribute to nutrient intake.
Steers were adapted to the experimental diets in two stages. In stage one (days −64 to −36 in relation to the start of the performance test on day 0), the animals were all adapted to the control diet and trained to use the electronic feeders. In stage two (days –35 to 0), steers were adapted to the treatments over a 5-week period. Dietary treatments (nitrate and MDDG) were progressively incorporated into the NIT, MDDG and COMB treatments at 25% (day −35), 50% (day −28), 75% (day −21) and 100% (day −14) of the final dietary inclusion.
Blood met-haemoglobin (MetHb) measurements
Blood MetHb is formed when nitrite, arising from reduction of nitrate in the rumen, reacts with haemoglobin (Hb) to form MetHb, which is incapable of oxygen transport and responsible for acute toxicity (Bruning-Fann and Kaneene, Reference Bruning-Fann and Kaneene1993). Blood MetHb concentrations were monitored in all steers receiving dietary nitrate. Blood samples were taken 3 h after fresh feed was offered, when MetHb concentrations were expected to be greatest (van Zijderveld et al., Reference van Zijderveld, Gerrits, Apajalahti, Newbold, Dijkstra, Leng and Perdok2010). Samples were taken on days −34 (25%), −27 (50%), −13 (100%), −6 (100%) and 1 (100%), where 100% is the final dietary inclusion of nitrate. Blood samples were taken from the caudal vein into two evacuated tubes (Vacuette 9 ml LH Lithium Heparin, Vacuette; Griener Bio One Ltd, Gloucestershire, UK). The samples were immediately combined to give one tube from which air was excluded, sealed and kept on ice until blood MetHb concentrations were measured within 2 h of sampling by co-oximetry (Stat Profile Critical Care Xpress; Nova Biomedical U.K., Cheshire, UK).
Fifty-six-day performance test
After full adaptation to the experimental diets, performance and feed efficiency were characterised for all steers over a 56-day test period (days 0 to 56). Steers were maintained under controlled conditions, where group sizes within the pen remained constant. Individual dry matter intake (DMI, kg/day) was recorded for each animal using the electronic feeding equipment and BW was measured weekly, before fresh feed was offered, using a calibrated weigh scale. For all steers, ultrasonic fat depth was obtained at the 12th/13th rib at the start (FD0) and end (FD1) of the 56-day test using industry-standard equipment (Aloka 500; BCF Technology Ltd, Glasgow, UK). Images were analysed using Matrox Inspector 8 software (Matrox Video and Imaging Technology Europe Ltd, Middlesex, UK).
Respiration chamber measurements
In all, 72 of the steers, balanced for breed and treatment were chosen for respiration chamber measurements. The steers remained on the same diets and in the same pens as described above before entering the respiration chamber facility. The steers were allocated to six respiration chambers over a 12-week period using a 4 (dietary treatment)×6 (chamber) randomised block design which was replicated three times such that each dietary treatment was measured in each respiration chamber three times over the 12-week period. Before entering the respiration chambers the steers were housed in training pens, identical in size and shape to the pens inside the chambers, for a period of 1 week, to adapt to individual housing. The steers were allocated to chambers to minimise variation in BW on entry into the respiration chambers between blocks; thus the heaviest steers for each treatment were included in the first block. The steers remained in the respiration chambers for 3 days, during which time they were fed ad libitum once daily. Data for DMI during the 3-day chamber measurement period were averaged per animal. One chamber malfunctioned from weeks 1 to 6, which resulted in the requirement for a 13th week of chamber analysis to obtain measurements from each of 72 steers. Full details of the methods are described in Troy et al. (Reference Troy, Duthie, Hyslop, Roehe, Ross, Wallace, Waterhouse and Rooke2015).
Rumen sampling and analysis
Rumen fluid samples were taken to assess long-term changes in rumen volatile fatty acid (VFA) molar proportions from each animal on five occasions: before adaptation to dietary treatments (day −42); during adaptation (day −28); pre-performance test (day −11); end of performance test (day 56); immediately after leaving respiration chambers. Samples, ~50 ml rumen liquid, were taken before fresh feed was offered, by inserting a stomach tube (16×2700 mm Equivet Stomach Tube; JørgenKruuse A/S, Langeskov, Denmark) nasally and aspirating manually. This liquid was filtered through two layers of muslin. A 5 ml sample of the filtered liquid was deproteinised by adding 1 ml metaphosphoric acid (215 g/l) and 0.5 ml methylvaleric acid (10 g/l) was added as an internal standard. These samples were stored at −20°C between collection and analysis. Volatile fatty acid concentrations were determined by HPLC (Rooke et al., Reference Rooke, Borman and Armstrong1990).
Calculations and statistical analyses
Data from one steer from the 56-day test period was discarded as the steer was removed from the trial for health reasons unconnected to the diets and treatments imposed, leaving data from 79 steers available for analysis. Growth was modelled by linear regression of BW against test date, to obtain average daily gain (ADG), mid-test BW (mid-BW) and mid-test metabolic BW (mid-MBW, BW0.75). Mean DMI over the 56-day period was expressed as kilogram per day or as a proportion of mid-BW and mid-MBW. Feed conversion ratio (FCR) was calculated as average DMI (kg/day)/ADG. Residual feed intake (RFI) was calculated as deviation of actual DMI (kg/day) from DMI predicted based on linear regression of actual DMI on ADG, mid-MBW and FD1 (Basarab et al., Reference Basarab, Price, Aalhus, Okine, Snelling and Lyle2003).
Statistical analyses of performance data were conducted using the mixed procedure of SAS software (SAS 9.3 for Windows; SAS Institute Inc., Cary, NC, USA) with the fixed effects of breed, nitrate and lipid. In addition, in the analysis of FD1 and FD2, the deviation from the breed mean of FD0 was included as a covariate. In the analysis of the respiration chamber data, fixed effects were breed, nitrate and lipid, whereas the random effects were week of chamber measurement and chamber. The interactions, breed×nitrate, nitrate×lipid, breed×lipid and breed×nitrate×lipid were included as fixed effects in each model when these effects proved significant (P<0.05).
Changes in MetHb concentration were analysed using a repeated measures design where the fixed effects were breed, lipid and time and their interactions. As significant time×breed×lipid interactions were found, a two-factor (breed×lipid) ANOVA was then performed for each time to characterise this interaction. Where a significant breed×lipid interaction was detected, differences between individual treatments were characterised using LSD.
Molar proportions of VFA in rumen fluid when steers left the respiration chamber were analysed using fixed effects of breed, nitrate and lipid and their interactions with week of measurement as a random effect. For differences in the ratio, acetate to propionate, between samples taken at different stages of the experiment, a split plot ANOVA was used where sample was a split plot within steer and the effects of breed, nitrate, lipid and sample and their interactions were included in the model. Data for samples taken before introduction of dietary treatments (day −42), were included as a covariate in the model to control for pre-existing differences between steers in VFA pattern. For all analyses data are reported as means with their standard errors of the mean unless indicated otherwise. Probability values of P<0.05 were deemed to be significant, whereas probability values P>0.05 and P<0.1 were deemed to indicate a tendency.
Results
Met-haemoglobin response to dietary nitrate
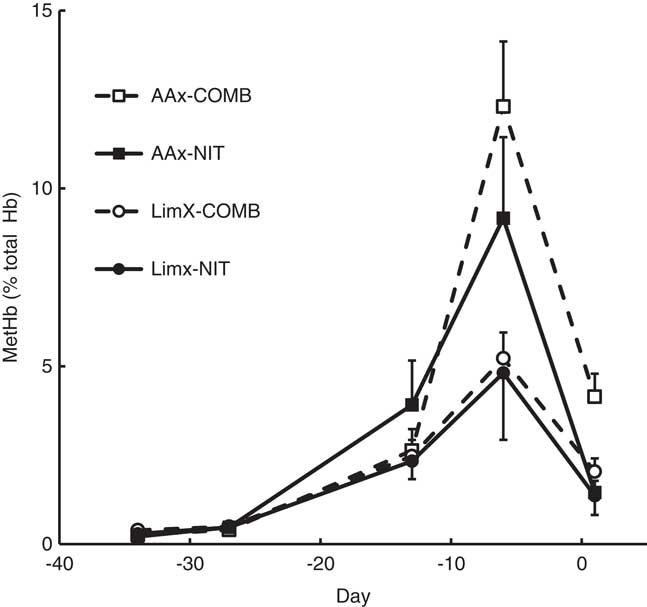
Met-haemoglobin concentrations were low (<1% total Hb; Figure 1) when nitrate was included at 25% and 50% of the maximum inclusion. Adding 100% nitrate increased MetHb concentrations (P<0.001); mean values were greater on day −6 (7.9% total Hb) than on day −13 (2.9% total Hb) or day 1 (2.2% total Hb). There was a significant time×breed×nitrate interaction (P<0.01). On day −13, MetHb concentrations were greater (P<0.01) on the COMB than the NIT treatment. However, on day −6, AAx steers on treatment COMB had greater MetHb concentrations (4.1% SEM 0.65) than other treatments (1.6% SEM 0.25). For individual steers, the highest values for MetHb concentration recorded were 13.0%, 20.5% and 7.6% total Hb on days −13, −6 and 1, respectively. Clinical signs of toxicity are considered to become apparent at MetHb values of 30% to 40% total Hb (Bruning-Fann and Kaneene, Reference Bruning-Fann and Kaneene1993).
Changes in blood met-haemoglobin (MetHb) (% total haemoglobin (Hb)) during adaptation to nitrate-containing diets. Samples were obtained from cross-bred Aberdeen Angus (AAx) or Limousin (LimX) steers offered diets containing nitrate alone (NIT) or nitrate and maize distillers dark grains (COMB). Blood samples were taken when 25% (day −34, where day 0 was the start of the performance test), 50% (day −27) and 100% (days −13, −6 and 1) of the dietary nitrate (100%=21.5 g nitrate/kg dry matter) inclusion was offered.

As there were no interactions between breed and dietary treatment for any measurement, for clarity, results in Tables 2 to 4 are presented as main effects of breed and dietary treatment.
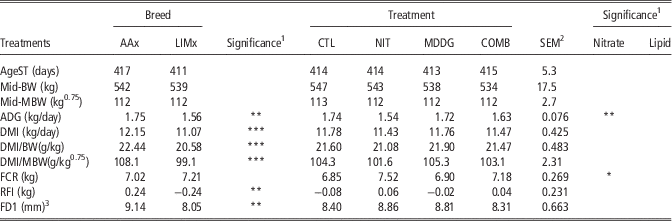
Effect of breed and dietary treatment on growth, fat depth, feed intake and feed efficiency of Aberdeen Angus- (AAx) and Limousin-sired (LIMx) steers fed four dietary treatments in which rapeseed meal (CTL) was replaced by nitrate (NIT) or lipid (MDDG) alone or in combination (COMB)

MDDG=maize distillers dark grains; AgeST=age at start of test; Mid-BW=mid-test BW; Mid-MBW=mid-test metabolic BW; ADG=average daily gain at the end of the 56-day test; DMI=dry matter intake; FCR=feed conversion ratio; RFI=residual feed intake; FD1=fat depth at the 12th/13th rib at the end of the 56-day test.
1 There were no significant (P>0.05) interactions between breed and dietary treatment or between nitrate and lipid.
2 SEM for 10 observations.
3 Deviation from breed mean of FD0 (measured at start of 56-day performance test) fitted as covariate.
*P<0.05, **P<0.01, ***P<0.001.
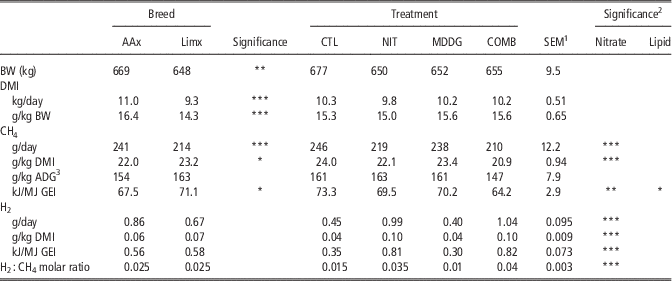
Effect of breed and dietary treatment on methane (CH4) and hydrogen (H2) emissions of Aberdeen Angus-sired (AAx) and Limousin-sired (LIMx) steers fed four dietary treatments in which rapeseed meal (CTL) was replaced by nitrate (NIT) or lipid (MDDG) alone or in combination (COMB)

MDDG=maize distillers dark grains; DMI=dry matter intake; ADG=average daily gain; GEI=gross energy intake.
1 SEM for nine observations.
2 There were no significant (P>0.05) interactions between breed and dietary treatments or between nitrate and lipid.
3 Calculated from CH4 (g/kg DMI) and DMI and ADG from Table 2.
*P<0.05, **P<0.01, ***P<0.001.
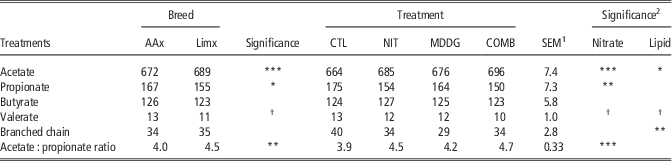
Effect of breed and dietary treatment on volatile fatty acid (mmol/mol) molar proportions in rumen fluid from Aberdeen Angus-sired (AAx) and Limousin-sired (LIMx) steers fed four dietary treatments in which rapeseed meal (CTL) was replaced by nitrate (NIT) or lipid (MDDG) alone or in combination (COMB)

MDDG=maize distillers dark grains.
Rumen samples taken when steers left respiration chambers.
1 SEM given for nine observations.
2 There were no significant interactions (P>0.05) between breed and treatments.
† P<0.1, *P<0.05, **P<0.01, ***P<0.001.
Performance traits
At the start of the experiment the treatments were balanced for age and BW. Thus, age at the start of the test period (AgeST) and mid-BW did not differ across dietary treatments (P>0.05; Table 2). Dry matter intake was not affected by the inclusion of nitrate or lipid (P>0.05). However, steers receiving dietary nitrate achieved poorer ADG throughout the 56-day test (P<0.01). The inclusion of nitrate or lipid did not affect fat depth at the end of the 56-day test (FD1; P>0.05). Steers receiving dietary nitrate were less efficient (greater FCR; P<0.05) than those not receiving nitrate, although this difference was not observed for RFI. In contrast dietary lipid did not affect feed efficiency (P>0.05); AgeST and mid-BW did not differ between breeds (P>0.05). Cross-bred Aberdeen Angus steers achieved greater ADG compared with LIMx steers (P<0.01). Dry matter intake was greater in AAx compared with LIMx steers, whether expressed daily (P<0.001), or as a proportion of BW (P<0.001); FD1 was greater in AAx compared with LIMx steers (P<0.05). Due to the higher levels of DMI and FD1, AAx steers were less efficient with greater RFI scores than LIMx steers (P<0.01).
Methane and hydrogen emissions
Steers receiving treatments which included nitrate produced less CH4 and more hydrogen (Table 3) than those treatments without added nitrate, expressed on either a daily or on a DMI basis (P<0.001). Increasing the lipid content of the diets had no effect on CH4 or H2 emissions. When expressed on a GE basis, CH4 emissions (kJ/MJ GE intake) were reduced when lipid was included in the diet. There were no significant interactions between inclusion of nitrate and lipid on CH4 emissions on either a daily (P=0.59) or DMI (P=0.82) basis. There were no differences in CH4 emissions when calculated/kilogram ADG for any nutritional treatment. Cross-bred Aberdeen Angus steers were heavier than the LIMx steers (P<0.01) and had a higher DMI during the chamber period (P<0.001). Therefore, they produced more CH4 on a daily basis (P<0.001). In contrast, the LIMx steers produced more CH4 on a DMI basis (P<0.05). Breed had no effect on H2 emissions on either a daily or DMI basis.
Volatile fatty acid molar proportions
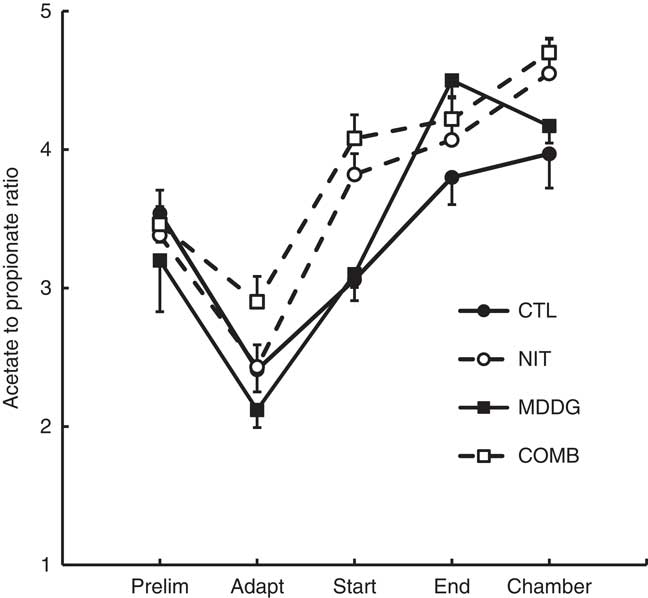
When nitrate was included in the diets, acetate molar proportions were greater (P<0.001), those of propionate less (P<0.01) and therefore acetate to propionate ratio (APR) greater (P<0.001) in rumen samples taken when steers left the respiration chambers (Table 4). Increasing the lipid concentration of the diet also increased (P<0.05) the molar proportions of acetate. There were greater molar proportions of acetate (P<0.01) and lesser propionate proportions (P<0.05) in LIMx than AAx steers. The APR ratio differed (P<0.001) in samples taken at different times during the experiment (Figure 2), increasing as the experiment progressed. Acetate to propionate ratio in samples taken before introduction of dietary treatments was a significant covariate (P<0.01) in the model indicating that individual steer VFA pattern before inclusion of treatments influenced VFA pattern throughout the experiment. The main effects of breed and treatment across the experiment were consistent with samples taken when steers left the respiration chambers (Table 4). Thus, LIMx steers had greater APR than AAx steers (P<0.05) and inclusion of both nitrate (P<0.001) and lipid (P<0.05) increased APR.
Changes in the ratio (mol/mol) of acetate to propionate during experiment in rumen fluid from steers fed four dietary treatments in which rapeseed meal (CTL) was replaced by nitrate (NIT) or lipid (maize distillers dark grains (MDDG)) alone or in combination (COMB). Samples were taken during adaptation to basal diet (Prelim, day −42); during introduction of experimental treatments (Adapt, day −28); before the start (Start, day −11) and at the end (End, day 56) of performance measurement and when steers left respiration chambers (Chamber).

Discussion
This study extended those of Troy et al. (Reference Troy, Duthie, Hyslop, Roehe, Ross, Wallace, Waterhouse and Rooke2015) and Duthie et al. (Reference Duthie, Rooke, Troy, Hyslop, Ross, Waterhouse and Roehe2016) by using a factorial design to investigate whether the effects of individual treatments to reduce CH4 emissions were additive and to characterize the consequences for animal performance. The diets were formulated from feedingstuffs practical for use in beef cattle systems. To maintain CP constant, MDDG and nitrate replaced dietary rapeseed meal. Thus, the increase in dietary lipid concentration achieved with MDDG was modest. However, this was representative of what is practically achievable using by-product feeds. To achieve higher lipid concentrations, it would have been necessary to use materials from which oil could have been extracted for human food consumption. As a main objective was to investigate the combined effects of lipid and nitrate, the COMB treatment inevitably contained a higher CP concentration than the other treatments. However, there were no interactions for any performance measurement between lipid and nitrate and thus no adverse effects of the higher CP.
Diet effects
Nitrate
Addition of nitrate to the diet reduced CH4 emissions, a consistent finding across many studies (see review by Lee and Beauchemin, Reference Lee and Beauchemin2014 and more recent studies including: Newbold et al., Reference Newbold, van Zijderveld, Hulshof, Fokkink, Leng, Terencio, Powers, van Adrichem, Paton and Perdok2014; Guyader et al., Reference Guyader, Eugène, Doreau, Morgavi, Gérard, Loncke and Martin2015 and Reference Guyader, Doreau, Morgavi, Gerard, Loncke and Martin2016; Lee et al., Reference Lee, Araujo, Koenig and Beauchemin2015; Troy et al., Reference Troy, Duthie, Hyslop, Roehe, Ross, Wallace, Waterhouse and Rooke2015; Veneman et al., Reference Veneman, Muetzel, Hart, Faulkner, Moorby, Perdok and Newbold2015; Klop et al., Reference Klop, Hatew, Bannink and Dijkstra2016). Unexpectedly, the reduction in CH4 from added nitrate was only 10% or 2.2 g/kg DM less than for diets not containing nitrate. As H2 consumed in reduction of 1 mol nitrate is equivalent to that used in formation of 1 mol CH4, the reduction in CH4 was only 45% of the theoretical maximum possible for the dietary nitrate inclusion. A 17% (4.4 g/kg DMI) reduction in CH4 yield (80% of theoretical maximum) was reported by Troy et al. (Reference Troy, Duthie, Hyslop, Roehe, Ross, Wallace, Waterhouse and Rooke2015) who used very similar experimental conditions to the present experiment. The meta-analysis of Lee and Beauchemin (Reference Lee and Beauchemin2014) predicted that the amount of nitrate used would have reduced CH4 emissions by 18%. A more recent analysis of the efficacy of nitrate, including the studies cited above (Rooke et al., Reference Rooke, Wallace, Duthie, McKain, de Souza, Hyslop, Ross, Waterhouse and Roehe2016) found that a mean inclusion of 21 g nitrate/kg DMI, reduced mean CH4 (g/kg DMI) by 21%.
The lower than expected reduction in CH4 by nitrate was accompanied by reduced FCR in nitrate-fed animals. Again, the reduction in animal performance was unexpected as in none of the studies reviewed by Lee and Beauchemin (Reference Lee and Beauchemin2014) or most recent studies (Li et al., Reference Li, Silveira, Nolan, Godwin, Leng and Hegarty2013; de Raphelis-Soissan et al., Reference de Raphelis-Soissan, Li, Godwin, Barnett, Perdok and Hegarty2014; Lee et al.. Reference Lee, Araujo, Koenig and Beauchemin2015; Veneman et al., Reference Veneman, Muetzel, Hart, Faulkner, Moorby, Perdok and Newbold2015; Duthie et al., Reference Duthie, Rooke, Troy, Hyslop, Ross, Waterhouse and Roehe2016; Klop et al., Reference Klop, Hatew, Bannink and Dijkstra2016) has animal performance been compromised by inclusion of nitrate. However, Guyader et al. (Reference Guyader, Doreau, Morgavi, Gerard, Loncke and Martin2016) reported reduced fat- and protein-corrected milk yield when both nitrate and extruded linseed were added to the diet and Hegarty et al. (Reference Hegarty, Miller, Oelbrandt, Li, Luijben, Robinson, Nolan and Perdok2016) in a feedlot study using high grain diets (700 g/kg DM) reported reduced DMI, ADG and FCR when nitrate replaced urea. In the current experiment, as DMI was not changed when nitrate was added to the diet, then the poorer FCR must have been due to alterations in nutrient supply or utilisation.
Although MetHb concentrations of >15% total Hb were observed during adaptation to nitrate, these were isolated occurrences and were substantially less than the 30% to 40% total Hb considered to lead to clinical toxicity (Bruning-Fann and Kaneene, Reference Bruning-Fann and Kaneene1993). As reduced performance is the most likely response to mild or subclinical toxicity, then this cannot be excluded as a reason for the poorer FCR in nitrate-fed animals. Another possibility is that rumen microbial protein synthesis and therefore host animal amino acid supply may have been less than expected. The reduction in CH4 attributed to nitrate was only 45% of the theoretical maximum. This implies that there was a corresponding reduction in the conversion of nitrate to ammonia. When the degradable protein supply to the rumen effective rumen degradable protein (ERDP) was estimated according to Agricultural and Food Research Council (1993) for diets CTL and NIT, ERDP supply was greater than requirement (1.14- and 1.18-fold, respectively; 9.9 and 10.6 g ERDP/MJ fermentable ME, fermentable metabolisable energy (FME)). When the ERDP supply from nitrate was reduced to 0.45 of that supplied by nitrate on diet NIT, ERDP supply was reduced to 0.99 of requirement or 9.0 g ERDP/MJ FME. However, estimated metabolisable protein supply to the animal was in excess of requirement (1.40- (CTL), 1.35- (NIT) and 1.30-fold (NIT with reduced ERDP supply), and therefore overall no reduction in performance as a result of reduced ERDP supply would have been expected as a consequence of a reduction in conversion of nitrate to ammonia. A further possibility is that as nitrate, a non-protein nitrogen source of ERDP replaced rapeseed meal in the diet then protein supply may have been impaired. However, this is unlikely as the reduction in FCR was a main effect of nitrate and so was also observed in diet COMB where both nitrate and MDDG were included in the diet and protein supply to both rumen and animal would have been in excess.
Lipid
As inclusion of MDDG in diets was limited by the need to avoid excess CP intake, the increase in lipid content of the diet was modest (12 g/kg DMI) and the overall reduction in CH4 emissions was not significant (P=0.12) on a g/kg DMI basis and only became significant on a kJ/MJ basis. However, the numerical decrease in CH4 emissions (g/kg DMI) of 4% (3% for a 10 g/kg diet DM increase in lipid) was consistent with the meta-analysis of Martin et al. (Reference Martin, Morgavi and Doreau2010) of a reduction in CH4 (g/kg DMI) of 3.8% for a 10 g/kg DM addition of supplementary fat.
Nitrate and lipid
A primary aim of the experiment was to investigate whether the effectiveness of different nutritional methods for reducing CH4 were additive. As the interaction between treatments was not significant (P=0.82) for CH4 yield (g/kg DMI) then there was no evidence that the effects of nitrate and lipid were not additive. Most in vivo studies investigating different strategies for reducing CH4 have either compared different treatments (e.g. van Zijderveld et al., Reference van Zijderveld, Fonken, Dijkstra, Gerrits, Perdok, Fokkink and Newbold2011a; El-Zaiat et al., Reference El-Zaiat, Araujo, Soltan, Morsy, Louvandini, Pires, Patino, Correa and Abdalla2014) or the combined effects of treatments (van Zijderveld et al., Reference van Zijderveld, Gerrits, Dijkstra, Newbold, Hulshof and Perdok2011b; Li et al., Reference Li, Silveira, Nolan, Godwin, Leng and Hegarty2013; Caetano et al., Reference Caetano, Wilkes, Pitchford, Lee and Hynd2016) but have not adopted the factorial design necessary to quantify interactions between treatments. Van Zijderveld et al. (Reference van Zijderveld, Gerrits, Apajalahti, Newbold, Dijkstra, Leng and Perdok2010) compared nitrate and sulphate when fed to sheep and found the effects of treatments on CH4 emissions were additive. Similarly de Raphelis-Soissan et al. (Reference de Raphelis-Soissan, Li, Godwin, Barnett, Perdok and Hegarty2014) fed nitrate and Propionibacterium acidipropionici to sheep and Klop et al. (Reference Klop, Hatew, Bannink and Dijkstra2016) nitrate and DHA to dairy cows and again treatment effects on CH4 emissions were additive. Thus, in agreement with the current study, there is no evidence that the effects of nutritional mitigation strategies for reducing CH4 are not additive.
The additive nature of mitigation treatments is of practical importance. The extent to which lipid-containing feeds can be incorporated into diets is limited by the need to avoid reductions in fibre digestion when lipid concentrations are >70 g/kg DM (Patra Reference Patra2013). During adaptation to nitrate, in both the current experiment and Duthie et al. (Reference Duthie, Rooke, Troy, Hyslop, Ross, Waterhouse and Roehe2016), blood MetHb concentrations did not increase until 15 g nitrate/kg diet DM was included in the diet. This is likely because the apparent efficiency of CH4 reduction by nitrate decreases as nitrate inclusion increases (Leng Reference Leng2014). Thus, potential adverse effects of mitigation strategies such as toxicity and impaired animal performance could be avoided by feeding lesser amounts of nitrate than in the present experiment.
Breed effects
Total CH4 emissions were greater in AAx than LIMx steers as noted before (Rooke et al., Reference Rooke, Miller, Flockhart, McDowell and MacLeod2014) primarily because of greater DMI. However, unlike Rooke et al. (Reference Rooke, Miller, Flockhart, McDowell and MacLeod2014), CH4 yield (g/kg DMI) was lower in AAx than LIMx steers. This was probably because of a faster rumen turnover rate in the AAx steers, an effect that has been well documented and included in empirical prediction equations for CH4 yield (Sauvant and Giger-Reverdin, Reference Sauvant and Giger-Reverdin2009; Ramin and Huhtanen, Reference Ramin and Huhtanen2013). Similarly the smaller proportion of acetate in rumen fluid samples from AAx steers was consistent with the meta-analysis of Nozière et al. (Reference Noziere, Glasser and Sauvant2011). In the performance trial, the greater DMI of AAx steers noticed when CH4 was measured was also evident and resulted in greater ADG in AAx steers. However, when the RFI of the steers was assessed, the LIMx steers were more efficient (smaller RFI) than the AAx steers. The lower CH4 emissions (g/kg DMI) and higher propionic molar proportion achieved with the AAx steers is not consistent with the differences in RFI. There is no obvious reason for these discrepancies but it should be noted that the performance and respiration chambers measurements were made sequentially.
In conclusion, inclusion of nitrate in the diet reduced CH4 emissions in growing beef cattle although the efficacy of nitrate was less than in previous work (Troy et al., Reference Troy, Duthie, Hyslop, Roehe, Ross, Wallace, Waterhouse and Rooke2015). Whereas Duthie et al. (Reference Duthie, Rooke, Troy, Hyslop, Ross, Waterhouse and Roehe2016) recorded no changes in animal performance when nitrate was fed, in the present experiment, growth rate and FCR were poorer when nitrate was included in the diet. However, when both increased dietary lipid and nitrate inclusion were combined there was no evidence of any interaction between treatments in CH4 emissions or performance traits. Therefore, combining different nutritional treatments to mitigate CH4 emissions could be a useful means of achieving reductions in CH4 emissions without adverse effects.
Acknowledgements
The authors are grateful to the technical staff at the Beef Research Centre for their skilled assistance during the experiment. This research was funded by AHDB Beef and Lamb, the Scottish Government and by DEFRA and the devolved administrations through the UK Agricultural Greenhouse Gas Inventory Research Platform.