INTRODUCTION
Green turtles (Chelonia mydas Linnaeus, 1758) have a circumglobal distribution in tropical and subtropical seas generally between latitudes 40°N and 40°S (Hirth, Reference Hirth1997). This species is currently classified as Endangered by the International Union for Conservation of Nature (IUCN; Seminoff, Reference Seminoff2004). In Brazil, green turtles nest almost exclusively on oceanic islands, mainly on Trindade Island (Moreira et al., Reference Moreira, Baptistotti, Scalfone, Thomé and de Almeida1995), but also on Atol das Rocas (Bellini et al., Reference Bellini, Marcovaldi, Sanches, Grossman and Sales1996) and Fernando de Noronha (Bellini & Sanches, Reference Bellini and Sanches1996); scant green turtle nesting has been observed on the mainland (Marcovaldi & Marcovaldi, Reference Marcovaldi and dei Marcovaldi1999; Projeto TAMAR–ICMBio (TAMAR), the Brazilian Sea Turtle Conservation Programme, unpublished data). However, juveniles of this species are commonly found along the Brazilian coast (Marcovaldi & Marcovaldi, Reference Marcovaldi and dei Marcovaldi1999; Naro-Maciel et al., Reference Naro-Maciel, Becker, Lima, Marcovaldi and DeSalle2007). The green turtle and the other species of sea turtles found in Brazil (loggerhead, Caretta caretta Linnaeus, 1758; leatherback, Dermochelys coriacea Vandelli, 1761; hawksbill, Eretmochelys imbricata Linnaeus, 1766; and olive ridley, Lepidochelys olivacea Eschscholtz, 1829; Marcovaldi & Marcovaldi, Reference Marcovaldi and dei Marcovaldi1999) are included in the Brazilian government's official list of endangered fauna (IBAMA, 2003) and all life history stages, including eggs and hatchlings, are fully protected by law. The main sea turtle nesting sites in Brazil have been protected since 1982 by TAMAR; work in some feeding areas only started in 1991, to deal with high levels of incidental captures by local fishermen (Marcovaldi & Marcovaldi, Reference Marcovaldi and dei Marcovaldi1999).
Juvenile green turtles are commonly found along the State of Espírito Santo coast, many of them stranded on beaches, often as a result of interactions with fishing gear. In the Bay of Vitória, around which the state capital is located, juvenile green turtles can regularly be observed near rocky shores (TAMAR, unpublished data). Many of the juvenile green turtles recorded in Espírito Santo exhibit tumours. Matushima et al. (Reference Matushima, Longatto Filho, di Loretto, Kanamura, Gallo, Baptistotte, Kalb and Wibbels2000) analysed tumour samples from 11 juvenile green turtles from the Brazilian States of Espírito Santo, São Paulo and Bahia; all examined samples had a histopathological confirmation of fibropapillomatosis (FP). This is a disease characterized by multiple tumour masses ranging from 0.1 cm to more than 30 cm in diameter each, found on the conjunctiva, neck, flippers, tail, axillary and inguinal areas and/or in internal organs (George, Reference George, Lutz and Musick1997); that disease was first described in 1938 in green turtles from Florida, USA (Smith & Coates, Reference Smith and Coates1938). The tumours can affect feeding, movement, breathing, vision, general health condition and growth rates of green turtles (George, Reference George, Lutz and Musick1997; Hirth, Reference Hirth1997; Balazs et al., Reference Balazs, Puleloa, Medeiros, Murakawa, Ellis, Epperly and Braun1998; Landsberg et al., Reference Landsberg, Balazs, Steidinger, Baden, Work and Russel1999; Work & Balazs, Reference Work and Balazs1999; Work, Reference Work2005). This seems to be a transmissible disease, although its aetiology and mode of transmission are still unknown; it has been found to be regularly associated with viruses, but parasites, environmental pollutants, marine toxins and ultraviolet light could also play a role in its causation (Work, Reference Work2005). This disease has been found in green turtles in different countries in the world, often at high prevalences (Balazs, Reference Balazs, Balazs and Pooley1991; Ehrhart, Reference Ehrhart, Balazs and Pooley1991; Adnyana et al., Reference Adnyana, Ladds and Blair1997; Aguirre et al., Reference Aguirre, Limpus, Spraker, Balazs, Kalb and Wibbels2000; Baptistotte et al., Reference Baptistotte, Rieth, Becker, Lopez, Castilhos, Lima, Bellini, Matushima and Barata2001).
This study began in 2000 out of the recognition of a special ecological situation, when an aggregation of juvenile green turtles, many of them with tumours, was found inside the effluent discharge channel of a steel plant. At that time, no studies on size-classes, growth, residency period and health condition of juvenile sea turtles had been carried out in the State of Espírito Santo, and few studies had been performed in Brazil that presented biometric, demographic or health data on juvenile sea turtles (Sanches & Bellini, Reference Sanches and Bellini1999; Gallo et al., Reference Gallo, Macedo, Giffoni, Becker and Barata2006). Our objective is to report information on the temporal pattern of occurrence, size-classes, residency, presence of tumours and growth rates of tumoured and non-tumoured green turtles in the study area. Studies on growth of juvenile green turtles are important to understand demographic patterns of the species (e.g. the period of time to sexual maturation), which could provide much-needed information for its conservation and management (Heppell et al., Reference Heppell, Snover, Crowder, Lutz, Musick and Wyneken2003). Furthermore, the information here presented should allow comparisons with other green turtle populations in regard to health patterns, which is also important for the development of management and recovery plans for this species.
MATERIALS AND METHODS
Study area and period
The study area (20°15′50″S 40°13′44″W) is located in the premises of ArcelorMittal Tubarão Steel Company (AMT; formerly, at the beginning of this study, Tubarão Steel Company—Companhia Siderúrgica de Tubarão), in the municipality of Serra, 10 km north-east of Vitória, the State of Espírito Santo capital, eastern Brazil. Seawater is taken from the sea at a rate of about 30 thousand m3/hour; after being used in the steel plant cooling, it is mixed with treated domestic and industrial effluents and then discharged into the sea through a channel about 1.1 km long. The study area is the final section of that discharge channel, extending from a 1 m high waterfall (placed across the channel) to the channel opening into the sea; it is about 290 m long, 30 m wide and averaging 2 m in depth. Fieldwork was generally carried out weekly at afternoon from 11 August 2000 to 25 July 2006, with approximately 4 hours of fieldwork per day, but in 13 weeks fieldwork was carried out twice-weekly. No fieldwork was carried out in May 2001, so there were 71 months of fieldwork.
Environmental data
Monthly mean seawater temperatures in the six years at both the sea intake and the discharge channel were provided by AMT, which daily monitors the water temperature at the two sites. The relatively high temperature and the availability of organic matter in the discharge channel make possible a noticeable growth of algae, mainly the green alga Enteromorpha flexuosa, but also Pterocladiella sp., Jania sp., Arthrocardia sp. and Chaetomorpha sp.
Capturing, measuring and tagging the turtles
Turtles were captured along the channel by means of cast nets (mesh = 5 cm) thrown from the channel banks (54.4% of the captures were performed this way), by means of a net (mesh = 5 cm) set across the channel near its opening into the sea (39.3% of the captures), or by hand (6.1% of the captures); in the latter case, one of the research assistants entered the channel water to capture the turtles. One turtle (0.1% of the captures) was captured while stranded alive on one of the channel banks. Cast nests were used exclusively on most days, but on many other days both cast nets and the set net were used; the hand technique was only occasionally used, to capture turtles that were relatively close to the channel banks. Cast nets were thrown by one or two people; to set the net (by using a boat), three or four people were needed; for capturing turtles by hand, only one person was needed. In addition, two people were needed to tag, measure, weigh and examine the captured turtles; some of them were photographed.
Curved carapace length (CCL) was measured to the nearest 0.1 cm with a flexible plastic tape, from the anterior point at midline (nuchal scute) to the midpoint of the line segment connecting the posterior tips of the supracaudal scutes, following standard TAMAR methods. Turtles weighing up to 20 kg were weighed to the nearest 0.1 kg with a spring scale with capacity of 20 kg; turtles weighing more than 20 kg were weighed to the nearest 0.2 kg with a spring scale with capacity of 50 kg (scales manufactured by Técnica Industrial Oswaldo Filizola Ltda., Brazil, models Crown AR-20 and AR-50). All size and weight measurements were made by the first author to avoid individual differences in measurement technique, a major source of error in growth data (Bjorndal & Bolten, Reference Bjorndal and Bolten1988; Boulon & Frazer, Reference Boulon and Frazer1990). The turtles were double tagged (inconel tags, style 681, National Band and Tag Co., USA) with one tag on the posterior edge of each front flipper, placed between the first and second scales, according to the standard TAMAR methods. Whenever a turtle was recaptured with a lost tag or tags in bad condition, they were replaced or substituted.
Overall body condition and presence of tumours
Overall body condition and presence or absence of external tumours were determined visually through physical examination of the turtle. As all captured turtles were alive, no necropsies were performed, and no kind of examinations were performed to determine whether there were any internal tumours. Therefore, in this paper a ‘tumour’ in a turtle means an external tumour. During the study period, samples of tumours were collected from 73 turtles (one sample per turtle); both pendunculated and sessile tumours were sampled. The samples were sent to Dr E.R. Matushima of the Faculty of Veterinary Medicine and Animal Science, University of São Paulo, Brazil, for histopathological analysis, and all of them had a histopathological confirmation of fibropapillomatosis (E.R. Matushima, personal communication, 2006). In the present study, both pendunculated and sessile tumours were considered as FP; bumps on the skin (rarely observed) were disregarded.
Overall body condition (normal, underweight or emaciated) was determined following Walsh (Reference Walsh, Eckert, Bjorndal, Abreu-Grobois and Donnelly1999). A turtle was classified as ‘normal’ if the plastron was convex, eyes were normal, the muscles of the neck areas had fatty tissues and axillary and inguinal areas were protuberant; ‘underweight’ if the plastron was a little concave, eyes were either normal or sunken, the muscles of the neck area had surrounding fatty tissues and axillary and inguinal areas were slightly sunken; or ‘emaciated’ if the plastron was very concave, the eyes were sunken, the muscles of the neck area were more obvious with little or no surrounding fatty tissues, and axillary and inguinal areas were very thin. The diameter of each tumour was measured to the nearest 0.1 cm with a calliper and grouped in four categories (1: <1.0 cm, 2: 1.0–4.0 cm, 3: 4.1–10.0 cm, and 4: >10.0 cm). On the basis of the number and size of tumours, each animal was assigned a tumour severity score following Work & Balazs (Reference Work and Balazs1999): either TS1 (lightly tumoured), or TS2 (moderately tumoured), or TS3 (heavily tumoured). After data collection, the turtles were released back into the discharge channel. Whenever recaptured, turtles were once again examined and again classified according to their overall body condition and presence or absence of tumours. All body condition assessments and tumour measurements were made by the first author to avoid individual differences in assessment criteria and measurement technique. When handling the turtles, every care was taken to avoid any contamination among different individuals. Each captured turtle was handled, examined and sampled separately, all instruments were adequately sterilized between successive examinations, and the researchers always used disposable gloves which were changed after the examination of each turtle. Moreover, regular asepsis of the laboratory where the examinations were carried out was performed just after each examination.
Data analysis
For data analysis, the overall body condition at capture and the tumour severity score were taken into account to create a classification of the turtles in regard to their health condition, by means of which tumoured turtles (with different levels of tumour severity) could be compared with non-tumoured turtles in apparently normal health condition; this last group of turtles will act as a control group in the analyses. Five health condition classes were defined, NoT-N, NoT-UE, T-TS1, T-TS2, and T-TS3, in this way: (1) turtles with no tumours were classified either as NoT-N, if their overall body condition was regarded as normal (the control group), or as NoT-UE, if their overall body condition was regarded as either underweight or emaciated; (2) turtles with tumours were classified as T-TS1, T-TS2 or T-TS3, if their tumour severity score was respectively TS1, TS2 or TS3. In this article, the expression ‘normal health condition’ will refer to turtles in class NoT-N, and the expressions ‘tumoured turtles’ and ‘turtles with tumours’ will refer to turtles in classes T-TS1, T-TS2 and T-TS3 combined.
For some of the recaptured turtles, the health condition class into which the turtle was classified changed among the several occasions in which the animal was captured (see Results). In case the condition of the turtle changed among the different captures, in the analyses to follow the turtle was considered as belonging to the health condition class into which it was classified in the last capture.
Monthly abundance of turtles was measured by means of the monthly capture per unit of effort (CPUE), defined as the number of turtles caught per hour of work in each month. The monthly temperatures at intake and discharge and the relationship between monthly CPUE and monthly temperature were analysed by means of loess regressions with locally quadratic fitting; pointwise 95% confidence intervals for the regression curves were also computed by the loess method (Cleveland et al., Reference Cleveland, Grosse, Shyu, Chambers and Hastie1993).
The CCL distribution of the turtles was computed on the basis of the first measurement of each turtle, that is, each turtle contributed to the distribution with just one CCL measurement. When computing the CCL distribution separately by year, the first CCL measurement of each turtle in each year was used.
For turtles that were captured more than once, the estimated annual variation in CCL (cm/year) in each of the health condition classes NoT-N, NoT-UE, T-TS1, T-TS2, and T-TS3 was computed by applying to each turtle of the class the formula: mean annual growth rate = (dCCL/dt) × 365, where dCCL is the difference in CCL between the first and last captures of the turtle and dt is the time difference in days between the dates of the first and last captures of the turtle; only turtles with dt either equal to or greater than 90 days were included in the analyses. The mean and the standard error of these growth rates were then computed, which allowed the construction of a 95% confidence interval. For turtles in health condition class NoT-N that were captured more than once, the mean annual growth rate (cm/year) and a confidence interval for that mean were also estimated through a different method, by using a loess regression (with locally quadratic fitting) relating the dCCL of each turtle to its time interval dt (dCCL and dt defined as above); the mean annual growth rate was then given by the point of the regression curve corresponding to a time interval equal to 365 days, and a pointwise 95% confidence interval was obtained from the loess calculations; again, only turtles for which dt was either equal to or greater than 90 days were included in the calculations. We have excluded from the growth rate calculations two turtles of class NoT-N with CCL at first capture equal to 54.2 and 55.3 cm, as these turtles were relatively isolated (in terms of CCL) from the much larger group of turtles of class NoT-N with CCL less than 47 cm.
For turtles in health condition class NoT-N, to analyse the relationship between the CCL at the first capture and the estimated annual variation in CCL (cm/year) for each turtle, a loess regression with locally quadratic fitting was used; only turtles for which dt (defined as above) was either equal to or greater than 90 days were included in these calculations.
Whenever necessary, to compare the CCL of captured green turtles and growth rates to data found in the literature, published straight carapace lengths (SCLs) were converted to CCLs and SCL-based growth rates were converted to CCL-based growth rates by using the formula in Teas (Reference Teas1993). When comparing the CCL of the green turtles captured in this study with the CCL of green turtles either stranded or incidentally captured in fishing gear in other areas of the State of Espírito Santo, we have only included in the calculations turtles from Espírito Santo with CCL below 90 cm, which is the minimum CCL of green turtles nesting in Brazil (TAMAR, unpublished data); likewise, when comparing the prevalence of tumoured turtles in this study with that from Espírito Santo, only turtles from Espírito Santo with CCL below 90 cm were included in the calculations; in this way, 10 turtles in the nesting CCL range, which amounted to 1.3% of the total number of stranded or incidentally captured green turtles in Espírito Santo with known CCL, were excluded from both the CCL and prevalence comparisons.
To analyse the variation of the prevalence of tumoured turtles by time (seasons along the years) and temperature, a generalized additive model (GAM; Hastie & Tibshirani, Reference Hastie and Tibshirani1990) was used, with Gaussian error distribution, identity link function and second degree loess smoothing; the model was fitted using the gam function (Hastie, Reference Hastie, Chambers and Hastie1993) of the R software (R Development Core Team, 2008). Given the null result of the GAM analysis in relation to temperature, the relationship between the prevalence of tumoured turtles and time (seasons along the years) was analysed by means of a loess regression with locally quadratic fitting. In both the GAM and the loess analyses, the data points (one for each season along the years) were weighed; the weight for each season was proportional to the sample size (the total number of captured turtles) in the season. In these analyses, only the first capture of each turtle was considered. Seasons were delimited by the dates 1 January, 1 April, 1 July and 1 October, taken as approximations to the dates 21 December, 21 March, 21 June and 21 September on which the seasons (very approximately) begin. Seasons were numbered consecutively from 1 to 25 for the analyses; season 11 (January–March 2003) was not included in the analyses, as there was no turtle whose first capture occurred during that season. Monthly temperatures at the discharge channel were averaged to obtain the mean temperature in each season; the mean seasonal temperatures were then used in the analyses.
In the analysis of the relationship between the time interval between the first and last captures and the seasons along the years, the seasons were defined as in the GAM analysis presented above. The difference in CCL-weight curves between turtles in normal health condition and those with tumours was analysed by means of a permutation test with 20,000 resamplings (Good, Reference Good2005). Mann–Whitney, Kruskal–Wallis (including post hoc multiple comparisons) and Kolmogorov–Smirnov tests used elsewhere followed Conover (Reference Conover1999), while t-tests (with Welch's approximation) and the Chi-square test followed Zar (Reference Zar1996).
Data analyses were carried out with the software R 2.8.1 (R Development Core Team, 2008); the significance level of the statistical tests was alpha = 0.05.
RESULTS
Abundance, seasonality and health condition class distribution
A total of 1058 captures of green turtles were performed in the six years, and 640 individual green turtles were captured; the green turtle was the only species of sea turtle captured in the study area during the study period. A total of 448 turtles were captured just once, 107 turtles were captured twice, 39 were captured three times, 14 were captured four times, 15 were captured five times, 6 were captured six times, 10 turtles were captured between seven and twelve times, and 1 turtle was captured twenty-three times; in all, 192 turtles were captured more than once.
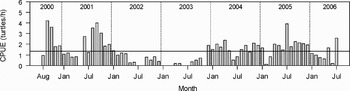
Monthly CPUEs ranged between 0 and 4.20 turtles/hour and the mean monthly CPUE in the 71 months of fieldwork was 1.34 turtles/hour (Figure 1). The monthly CPUE distribution was significantly different from a uniform distribution (one-sample Kolmogorov–Smirnov test, N = 71, P<0.00001), but no clear seasonal pattern can be seen in the monthly CPUE data: in the two initial years (2000–2001) a higher CPUE was found in the austral winter and spring than in autumn and summer, but in 2004–2006 no pattern can be detected. In eight months in 2002 and 2003 there were no captures of sea turtles, although fieldwork was regularly carried out in these months. A noticeable decrease in capture rates was observed between May 2002 and November 2003.
Capture per unit of effort (CPUE) by month, August 2000 to July 2006 except May 2001 (N = 71 months). No fieldwork was carried out in May 2001; in the other eight months with CPUE = 0, no green turtles were captured. All captured turtles were considered in this graph, no matter their health condition class. The vertical dotted lines separate the years. The horizontal line indicates the mean monthly CPUE (1.34 turtles/hour) in the 71 months in which fieldwork was performed.

Among the 192 turtles that were captured more than once, for 60 of them the health condition class into which the turtle was classified changed among the several occasions in which the animal was captured. Fifty-nine turtles which did not present any tumours at the first examination did present some tumours in subsequent examinations. In only one case a regression of tumours was observed: a green turtle first captured on 18 August 2000 (CCL = 43.3 cm) with three relatively small tumours (about 1–2 cm in size), and found with tumours in 7 further recaptures, was classified as being without any tumours in a subsequent capture on 25 January 2001 (CCL = 46.8 cm), and in 14 further recaptures this turtle did not show any tumours.
The turtles were classified according to the five health condition classes as follows: 378 turtles in class NoT-N, 42 in class NoT-UE, 80 in class T-TS1, 115 in class T-TS2 and 25 turtles in class T-TS3. So 59.1% of the turtles were in normal health condition (class NoT-N), and the overall prevalence of tumours was 34.4% (classes T-TS1, T-TS2 and T-TS3 combined).
Capture in relation to water temperature
The monthly mean water temperature at the discharge channel during the six years of the study was on average 8.1°C higher than that at intake (median = 8.3, SD = 1.6, minimum = 2.7, maximum = 10.3, N = 72 months; Figure 2A). From the beginning of the study until August 2002 approximately (that is, in the first 25 months of the study period), both the time series of the monthly mean water temperature at the discharge channel and the one of the monthly mean water temperature at intake showed increasing trends, although temperatures at discharge increased at a higher rate than those at intake (Figure 2A); the temperature difference between discharge and intake (measured by the trend lines in Figure 2A) was 7.6°C at the beginning of the study, and it was 9.4°C in August 2002. However, after August–December 2002, although the water temperature at intake went on increasing (in a general way), as measured by the trend line, there was a decreasing trend in the temperature at discharge, so the temperature difference between discharge and intake showed a decreasing trend after August–December 2002; at the end of the study period (July 2006, month 72), the temperature difference between discharge and intake (measured by the trend lines) was 5.2°C. At the start of the study period the mean intake temperature, which can be taken as a measure of the mean seawater temperature around the study area, was approximately 21.6°C (measured by the trend line), while at the end of that period it was approximately 24.7°C.
Upper graph (panel A): monthly mean water temperature at intake and at the discharge channel (N = 72 months); month 1 = August 2000, month 72 = July 2006; the solid curves are loess regressions, and the horizontal lines indicate the mean values of the monthly water temperatures at intake (23.5 °C) and discharge (31.6 °C). Lower graphs (panels B and C): monthly CPUE by monthly mean water temperature at the discharge channel, August 2000 to July 2006 except May 2001 (N = 71 months); panel B: turtles in normal health condition (N = 622 captures); panel C: tumoured turtles (N = 368 captures). In each of panels B and C, the solid curve is a loess regression, the dotted curves indicate 95% pointwise confidence intervals, and the solid horizontal line shows the mean monthly CPUE.

For turtles in normal health condition, the monthly CPUE varied significantly with the water temperature at the discharge channel, as the mean monthly CPUE is not always within the band formed by the 95% pointwise confidence intervals of the loess regression in Figure 2B; the highest CPUEs were observed for water temperature between 26 and 31°C approximately, although such temperatures were relatively less common than higher temperatures. For tumoured turtles, no significant relationship was observed between the water temperature at the discharge channel and the monthly CPUE (Figure 2C).
Prevalence of tumoured turtles in relation to time and water temperature
The prevalence of tumoured turtles varied significantly with time (seasons along the years), but it did not vary significantly with the water temperature at the discharge channel, as shown by the GAM analysis presented graphically in Figure 3A & B; in relation to time, the zero-level line in Figure 3A gets outside the band formed by the 95% pointwise confidence intervals; in relation to the temperature, the zero-level line in Figure 3B is clearly always within the band formed by the 95% pointwise confidence intervals. The prevalence of tumoured turtles was highest between mid-2002 and the end of 2003 approximately (Figure 3C), a period of time when sample sizes per season (Figure 3C) as well as monthly CPUEs (Figure 1) were quite low; this was the period when the highest water temperatures at the discharge channel were recorded, and it was also the period during which the largest differences between water temperatures at intake and at discharge were recorded (Figure 2A). Around the beginning of 2005, when a significant number of turtles were captured, the prevalence of tumoured turtles was at a relatively low level (Figure 3C), but it should be noted that this prevalence was at that time around 22% on average. Of the 261 tumoured turtles included in the calculations that produced Figure 3, 92 (35.2%) were in class T-TS1, 137 (52.5%) were in class T-TS2 and 32 (12.3%) in class T-TS3.
Upper graphs (panels A and B): graphical summary of the generalized additive model (GAM) analysing the dependence of the prevalence of tumoured turtles on time (seasons along the years) and temperature at the discharge channel (N = 24 seasons, 640 turtles); in each graph, the solid curve indicates the model fit, and the dotted curves indicate pointwise 95% confidence intervals; the vertical scales, produced by the GAM analysis, are zero-centred and are not in prevalence units (that is, percentages); the small vertical bars at the bottom of each graph indicate the distribution of the time and temperature data included in the GAM analysis. Lower graph (panel C): prevalence of tumoured turtles by time (seasons along the years) (N = 24 seasons, 640 turtles); the solid curve is a weighed loess regression (see Material and Methods), and the dotted curves indicate pointwise 95% confidence intervals. The horizontal line indicates the mean prevalence in all seasons (34.4%), and the bottom row of numbers shows the sample size for each season. Austral seasons: W, winter; P, spring; S, summer; A, autumn.

Size-classes and growth rates
For the complete set of captured green turtles, CCL ranged between 25.2 and 77.5 cm (mean = 40.3, median = 39.0, SD = 6.5, quantile 10 = 33.4, quantile 90 = 48.5, N = 640), and all except two turtles had CCL equal to or less than 61.3 cm. Except for one turtle with CCL = 77.5 cm, the captured turtles had CCL below 73.5 cm, the minimum CCL of green turtles nesting in the Atlantic (Hirth, Reference Hirth1997).
For turtles in normal health condition, CCL ranged between 27.4 and 77.5 cm (mean = 39.7, median = 38.0, SD = 7.0, quantile 10 = 32.7, quantile 90 = 49.2, N = 378; Figure 4), and all except two turtles in that class had CCL equal to or less than 61.3 cm. For turtles in that health condition class, the CCL distribution was not significantly different among the years (Kruskal–Wallis test, N = 442, P = 0.0780); the mean annual CCL varied between 38.4 cm (in 2005, N = 130) and 45.4 cm (in 2003, N = 14).
Curved carapace length distribution for green turtles in normal health condition (class NoT-N; N = 378 turtles).

Curved carapace length was significantly different among the five health condition classes (Kruskal–Wallis test, N = 640, P < 0.00001; Figure 5). Pairwise post hoc multiple comparisons indicate that CCL was significantly different for each pair of classes, except for classes T-TS2 and T-TS3; so turtles with tumours had a higher CCL than those without tumours, and turtles in classes T-TS2 and T-TS3 had a higher CCL than those in class T-TS1. For turtles in normal health condition, the CCL–weight relationship is given by the equation Weight = 0.000129430×CCL 2.974555 (N = 364, fraction of variance explained = 0.979; Figure 6); for turtles with tumours, the CCL–weight relationship is given by the equation Weight = 0.000205579×CCL 2.837466 (N = 209 turtles, fraction of variance explained = 0.937; Figure 6). The power of the CCL term in the second equation is significantly smaller than that in the first equation (permutation test, N = 570, P = 0.0484).
Curved carapace length by health condition class. Sample size (number of green turtles) is presented for each class. In each box plot, the extremes of the vertical lines show the maximum and minimum values in the class.

Weight by curved carapace length. Circles, solid curve: turtles in normal health condition (class NoT-N; N = 364 turtles). Crosses, dashed curve: turtles with tumours (N = 209 turtles).

For turtles in normal health condition (CCL range: 27.4–46.9 cm, N = 60), the mean growth rate one year after the initial capture was estimated to be 3.11 cm/year (SE = 0.261, 95% confidence interval = (2.59, 3.62)) by the method of calculating the estimated annual growth for each turtle, and was estimated by the loess method (Figure 7A) to be 2.91 cm/year (SE = 0.354, 95% confidence interval = (2.21, 3.60)). The estimated annual variation in CCL (by the method of calculating the estimated annual growth for each turtle) did not depend on the CCL of the turtle at the first capture, as the mean estimated annual variation in CCL is always within the band formed by the pointwise 95% confidence intervals of the loess regression in Figure 7B.
Variation in curved carapace length (CCL) for turtles in normal health condition (class NoT-N) with interval between first and last captures either equal to or greater than 90 days (N = 60 turtles; CCL at first capture in the range of 27.4–46.9 cm). Left (panel A): variation in CCL by the interval between first and last captures; the dashed vertical line indicates the time period of 365 days. Right (panel B): estimated annual variation in CCL by CCL at the first capture; the horizontal line indicates the mean estimated annual variation in CCL for the data points included in the loess regression (3.11 cm/year). In each of panels A and B, the solid curve is a loess regression, and the dotted curves indicate pointwise 95% confidence intervals.

The estimated annual variation in CCL (by the method of calculating the estimated annual growth for each turtle) was significantly different among the five classes NoT-N, NoT-UE, T-TS1, T-TS2 and T-TS3 (Kruskal–Wallis test, N = 114, P = 0.0015; Figure 8). Pairwise post hoc multiple comparisons indicate that: (1) the estimated annual variation in CCL is not significantly different for each pair of the classes NoT-N, NoT-UE and T-TS1; (2) classes T-TS2 and T-TS3 had an estimated annual variation in CCL significantly smaller than those in classes NoT-N and T-TS1; and (3) class NoT-UE is not significantly different from any other class in regard to the estimated annual variation in CCL. The mean estimated annual variation in CCL (by the method of calculating the estimated annual growth for each turtle) was 2.10 cm/y for turtles in class NoT-UE (SE = 1.01, N = 6), it was 2.92 cm/y for turtles in class T-TS1 (SE = 0.56, N = 15), it was 1.64 cm/y for turtles in class T-TS2 (SE = 0.41, N = 28), and it was 0.93 cm/y for turtles in class T-TS3 (SE = 0.43, N = 5).
Estimated annual variation in curved carapace length by health condition class, for turtles with interval between first and last captures either equal to or greater than 90 days. Sample size (number of green turtles) is presented for each class. In each box plot, the extremes of the vertical lines show the maximum and minimum values in the class.

Residency in the study area and seasonal patterns of occurrence
The time interval between the first and last captures, which gives an indication of the residency period of the turtles in the discharge channel (and/or in the area just around; see Discussion), was not significantly different among the five health condition classes (Kruskal–Wallis test, N = 190 turtles, P = 0.636). The distribution of that time interval (for the five health classes combined) is quite skewed (Figure 9A); 50% of the turtles had a time interval smaller than 136 days (4.5 months), and 90% of the turtles had a time interval smaller than 464 days (1.3 years); the minimum time interval was 2 days, and the maximum was 693 days (1.9 years). For turtles in the five classes combined, the time interval between the first and last captures decreased significantly with the CCL at first capture, according to the loess regression in Figure 9B, where the line that represents the mean value gets outside the band formed by the 95% pointwise confidence intervals.
Left (panel A): distribution of the time interval between first and last captures, for turtles in the five health condition classes combined (N = 190 turtles). The dashed vertical lines indicate the quantiles 0.50 (the median) and 0.90 of the distribution. Right (panel B): time interval between first and last captures by curved carapace length at first capture, for turtles in the five health condition classes combined (N = 190 turtles); the solid curve is a loess regression (N = 187 turtles), the dotted curves indicate 95% pointwise confidence intervals; the leftmost data point and the two rightmost ones were excluded from the loess regression; the horizontal line indicates the mean time interval for the points included in the loess regression (198.8 days).

There was no significant relationship between the time interval between the first and last captures of a turtle and the season in which the initial capture of the turtle occurred (Kruskal–Wallis test, N = 23 seasons, P = 0.082; Figure 10). Two features of Figure 10 should be noted: (1) a period of time of about one and a half years, from mid-2002 to the end of 2003 approximately, in which a relatively small number of turtles were captured (see also Figure 1); and (2) the possible existence of censoring of the recapture intervals at the end of the study period, as some turtles that had been last captured before that moment could have stayed in the discharge channel (and/or in the area just around; see Discussion) past that moment.
Time interval between first and last captures of each turtle, for turtles in the five health condition classes combined (N = 190 turtles). Each horizontal line represents the time interval for one turtle, and is delimited by the dates of the turtle's first capture and last capture; dates are expressed as absolute dates (number of days since 31 July 2000). The calendar years are indicated in the top part of the graph. Austral seasons: W, winter; S, summer (spring and autumn are located in-between). The dashed vertical lines indicate (from left to right) the dates 11 August 2000 (start of fieldwork), 1 May 2002 (the approximate start of a period when a noticeable decrease in capture rates was observed; see Figure 1), 30 November 2003 (the approximate end of that period) and 25 July 2006 (end of fieldwork).

DISCUSSION
Green turtles were relatively abundant in the discharge channel, except in the second half of 2002 and mainly in 2003. A seasonal pattern was observed in the two initial years (2000–2001), with a peak occurrence in the austral winter and spring, but no clear seasonal pattern could be observed in 2004–2006 (Figure 1). In Ubatuba, State of São Paulo, Brazil, green turtles were more abundant around the austral winter and spring (Gallo et al., Reference Gallo, Macedo, Giffoni, Becker and Barata2006). A seasonal pattern in the occurrence of juvenile green turtles in feeding areas was observed in Texas, USA (Shaver, Reference Shaver1994) and Florida, USA (Mendonça & Ehrhart, Reference Mendonça and Ehrhart1982); however, in those instances peak occurrence was in the summer of the northern hemisphere (around July–August), that is, these seasonal patterns were opposite to the one found for green turtles in the two initial years of this study.
The captured green turtles were generally juveniles, with CCL (except for one turtle) well smaller than the minimum CCL of green turtles nesting in the Atlantic. For turtles in normal health condition (N = 378), the CCL distribution was significantly different from the CCL distribution of green turtles free of tumours either stranded or incidentally captured in fishing gear in the State of Espírito Santo (N = 615; TAMAR, unpublished data) (Mann–Whitney test, P=0.036); however, the mean CCL was 39.7 cm in this study and it was 41.1 cm in Espírito Santo, that is, they were relatively close in biological terms. The overall (i.e. for the five health condition classes combined) mean CCL of green turtles in this study (40.3 cm) was quite close to the mean CCL of green turtles found in Ubatuba (either stranded or incidentally captured in fishing gear or captured through free diving), which was 40.6 cm (Gallo et al., Reference Gallo, Macedo, Giffoni, Becker and Barata2006).
Green turtles could be attracted to the discharge channel by the presence of algae there, and their abundance in the channel could depend, at least in part, on the amount of algae. Some sort of relationship seems to have occurred during the study period between the amount of algae in the channel and the number of turtles found there. Generally, when capturing turtles, a relatively large amount of algae was collected by the nets, but a noticeable decrease in the collected amount was observed from mid-2002 to the end of 2003 approximately, a period of time when green turtle CPUEs were quite low (Figure 1); however, no quantitative measurements are available on that matter. Little is known about the diet of juvenile green turtles in eastern Brazil, and how the diet varies among different locations along the coast. Santos (Reference Santos2009) analysed the stomach contents of 15 dead juvenile green turtles in the Bay of Vitória, at a place about 10 km from the study area, and found that 96% of the dry biomass was composed of algae (Chlorophyceae and Rhodophyceae), and about 4% was composed of the seagrass Halodule wrightii. On the north coast of the State of São Paulo, about 600 km south-west of the study area, Sazima & Sazima (Reference Sazima and Sazima1983) found that four dead juvenile green turtles ate exclusively algae (Chlorophyceae, Phaeophyceae and Rhodophyceae). However, Guebert (Reference Guebert2008), studying 80 dead juvenile green turtles in the Bay of Paranaguá, State of Paraná, about 1000 km south-west of the study area, found that, although algae (Chlorophyceae, Phaeophyceae and Rhodophyceae) were a part of their diet, the seagrass Halodule wrightii and mangrove propagules Avicennia schaueriana comprised a substantial part (53% in volume) of that diet.
The presence and relative abundance of green turtles in the discharge channel could also be due to the relatively high water temperature there, when compared with the sea temperature around the study area. The discharge channel could attract turtles for different reasons. It could be a kind of refuge for the turtles, which would get there to avoid colder waters in the region around; behaviour of this kind has been observed in Florida, USA, for manatees, which overwinter in natural warm-water springs and warm-water discharges of power plants (Laist & Reynolds, Reference Laist and Reynolds2005). We consider it unlikely that green turtles use the discharge channel to avoid waters in the region around the study area that would be excessively cold, since the Espírito Santo coast, located in the tropical zone, has mild water temperatures throughout the year; in 2001–2006, the mean monthly sea surface temperature in a 2° × 2° region around the study area was in the range of 23.4–28.3°C (data obtained from the Smith–Reynolds Extended Reconstructed Sea Surface Temperatures Database, National Climatic Data Center, USA; Smith et al., Reference Smith, Reynolds, Peterson and Lawrimore2008); these temperatures are well above the low temperatures that could depress the physiological processes of sea turtles (Milton & Lutz, Reference Milton, Lutz, Lutz, Musick and Wyneken2003). Furthermore, juvenile green turtles can be observed in relatively large numbers throughout the year along the Espírito Santo coast (E. Torezani and C. Baptistotte, personal observations) and also in Ubatuba, State of São Paulo (Gallo et al., Reference Gallo, Macedo, Giffoni, Becker and Barata2006), located about 600 km south-west of the study area, where, due to the higher latitude, sea temperatures are generally lower than those in the study area.
The presence of green turtles in the discharge channel could also be a way to cope with the tumour disease. Turtles (Monagas & Gatten, Reference Monagas and Gatten1983) and other reptiles (lizards, alligators and snakes; Burns et al., Reference Burns, Ramos and Muchlinski1996; Kluger et al., Reference Kluger, Kozak, Conn, Leon and Soszynski1996) have been shown to attain a ‘behavioural fever’ (maintaining a higher body temperature by behavioural means) when experimentally challenged with either live bacteria or bacterial endotoxins and offered a gradient of ambient temperatures to select from; Amaral et al. (Reference Amaral, Marvin and Hutchison2002) showed that the experimental infection of turtles with bacterial endotoxins may generate opposite thermoregulatory responses, depending on the dose of the infectious material. Swimmer (Reference Swimmer2006), on the basis of experiments with juvenile green turtles and taking into account the existence of ‘behavioural fevers’ in reptiles, has proposed that green turtles with FP use basking as a way to attain a febrile state that could boost their immunological response to the tumour disease. In the present study, the relatively high water temperature at the discharge channel could have played, for tumoured turtles, a role similar to basking in Swimmer's (2006) hypothesis. The prevalence of tumoured turtles did not depend significantly on the water temperature (Figure 3B), and there was no significant difference in the time interval between the first and last captures among the five health condition classes, which indicates that tumoured turtles did not stay in or around the study area longer than healthy turtles. However, the prevalence of tumoured turtles did vary significantly with time, as seen in Figure 3C. We cannot advance any explanation for that variation, and neither for the fact that the prevalence was highest when captures, and presumably the abundance of turtles in the discharge channel, were at their lowest levels. No data are available on the prevalence of tumoured green turtles in the sea around the discharge channel, to be compared with the prevalence of tumoured turtles in that channel.
In the present study, a significant negative relationship was found between CPUE and water temperature for turtles in normal health condition (Figure 2B), but CPUE did not vary significantly with water temperature for tumoured turtles (Figure 2C). The water in the discharge channel was on average 8.1°C hotter than that at intake, but the maximum monthly difference was 10.3°C, and the maximum monthly mean water temperature at the discharge channel was 34.6°C. Sea turtles seem generally to prefer warmer waters, but there should be an optimum temperature range for them; at higher temperatures, overheating might be a problem (Mrosovsky, Reference Mrosovsky1980). The months when the lowest CPUEs were found, from mid-2002 to the end of 2003 approximately (Figure 1), were also the months with the highest water temperatures at the discharge channel, with monthly mean temperatures often above 33°C (Figure 2A); the elevated temperatures in these months could be one of the reasons for the near disappearance of turtles from the discharge channel in that period.
The time interval between the first and last captures provides some information on the turtles' residency time in the study area or in the area just around. We cannot rule out the possibility of green turtle movements (diel or other) between the discharge channel and the area around (Lyon et al., Reference Lyon, Seminoff, Eguchi, Dutton, Frick, Panagopoulou, Rees and Williams2006; Seminoff & Jones, Reference Seminoff and Jones2006); a turtle, once captured, could maybe spend some time in the sea outside the channel and return to it later, to be recaptured there. Green turtles seemed to spend a relatively small amount of time in or around the study area: half of the turtles seemed to stay there less than about five months, and 90% seemed to stay less than 1.3 years. It has been suggested that sea turtles may move to higher latitudes around the summer, returning to lower latitudes as the temperature falls around the winter (Epperly et al., Reference Epperly, Braun, Chester, Cross, Merriner and Tester1995). In the present study, the generally short recapture intervals seem to exclude the possibility of green turtle seasonal movements between the study area and other places, and indicate instead some residency in or around the study area for a relatively short time. The available data indicate that the study area (possibly including the area just around) is generally a transient developmental habitat for green turtles, where juveniles feed and grow during some period of time in their life. A similar pattern was found in Ubatuba, Brazil (Gallo et al., Reference Gallo, Macedo, Giffoni, Becker and Barata2006).
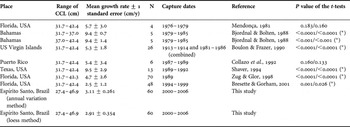
Table 1 presents mean annual growth rates for some juvenile green turtle populations in the Atlantic, all of them from the southern United States or the Caribbean. By means of t-tests, one can see that, out of eight populations, five have mean growth rates significantly higher than those found (by two different methods) in this study, one population has mean growth rate significantly smaller than those found in this study, and two populations have mean growth rates that are not significantly different from those found in this study; estimates of the mean annual growth rates (for the size-classes included in Table 1) range from 2.5 to 9.5 cm/year. Growth of green turtles may be related to diet, rate of ingestion, habitat quality, season, size, genetic composition of the individual, water temperature and the population density of turtles in a given area (Bjorndal & Bolten, Reference Bjorndal and Bolten1988; Boulon & Frazer, Reference Boulon and Frazer1990; Collazo et al., Reference Collazo, Boulon and Tallevast1992; Bjorndal et al., Reference Bjorndal, Bolten and Chaloupka2000). Growth rates may vary by individual and generally decrease with increased size (Mendonça, Reference Mendonça1981; Bjorndal & Bolten, Reference Bjorndal and Bolten1988; Boulon & Frazer, Reference Boulon and Frazer1990; Shaver, Reference Shaver1994), but this was not observed in this study (Figure 7B). However, it should be noted that the range of CCLs among individuals included in the loess regression in Figure 7B was relatively small; the minimum and maximum values of these CCLs were 27.4 and 46.9 cm respectively, and the quantiles 0.10 and 0.90 were 32.1 and 43.4 cm respectively. Small juvenile green turtles in the Pacific can have much lower growth rates than those in the Atlantic, possibly due to density-dependent effects (Bjorndal et al., Reference Bjorndal, Bolten and Chaloupka2000).
Growth rates of some green turtle populations in the Atlantic, together with data from this study (turtles in normal health condition). Growth rates are only provided for turtles with curved carapace length (CCL) in the approximate range of 30–45 cm, in accord with data from this study (see Figure 7B). Straight carapace lengths in the literature have been converted to CCLs (see Materials and Methods). In this study, the growth rate was estimated by two different methods (see Materials and Methods); accordingly, to compare each population in the Atlantic to the Brazilian population, two t-tests were done, each test dealing with one of the results relative to the Brazilian population; P values for both t-tests are presented; an asterisk (*) indicates significant results for both t-tests.

The prevalence of tumours in this study (34.4%) is significantly higher than the one found for green turtles (mostly juveniles) either stranded or incidentally captured by fishing gear on the State of Espírito Santo coast in 2001–2006, which was 21.2% (mean CCL = 42.4 cm, median = 40.0, SD = 9.1, range = 24.1–83.0, quantile 10 = 34.0, quantile 90 = 54.0, N = 780 turtles; TAMAR, unpublished data) (Chi-square test, df = 1, P < 0.00001).
Worldwide, the estimated FP prevalence in green turtles can be as high as 92% (Aguirre, Reference Aguirre1998). In Florida, that prevalence varied in 1975–1981 between 0 and 72.5% (Ehrhart, Reference Ehrhart, Balazs and Pooley1991); in Hawaii, it varied in 1983–1990 between 1% and 92% (Balazs, Reference Balazs, Balazs and Pooley1991); in Australia, in 1998 it varied between 0 and 70% (Aguirre et al., Reference Aguirre, Limpus, Spraker, Balazs, Kalb and Wibbels2000); in Indonesia the mean prevalence in 1994 was 21.5% (Adnyana et al., Reference Adnyana, Ladds and Blair1997). In Brazil, the FP prevalence in green turtles in the State of Espírito Santo in 2001–2006 was 20.9% (N = 790 turtles; TAMAR, unpublished data), and in the States of Ceará, Rio Grande do Norte, Sergipe, Bahia, Rio de Janeiro, São Paulo and Santa Catarina in 2000–2005 it ranged between 3.5 and 36.9% (sample size for each state ranged between 58 and 3456 turtles), while no tumours were observed on the oceanic islands Fernando de Noronha (N = 501 turtles) and Atol das Rocas (N = 486 turtles) (Baptistotte, Reference Baptistotte2007). Turtles inhabiting either waters near the coast or places with a relatively large human concentration nearby, or interior waters like lagoons, have generally a higher FP prevalence than those inhabiting deeper waters off the coast (George, Reference George, Lutz and Musick1997); a higher prevalence of FP in green turtles near areas of dense human population and industry was observed in Indonesia (Adnyana et al., Reference Adnyana, Ladds and Blair1997). A relatively high FP prevalence has been observed in areas with a large degree of marine habitat degradation and pollution; these environmental conditions could act as cofactors in relation to FP occurrence (Foley et al., Reference Foley, Schroeder, Redlow, Fick-Child and Teas2005).
Turtles with tumours had a higher CCL than those without tumours, and turtles in classes T-TS2 and T-TS3 had a higher CCL than those in class T-TS1 (Figure 5), possibly because there was more time for larger, and presumably older, turtles to be exposed to the possible causative agents and/or to develop tumours. Work et al. (Reference Work, Balazs, Wolcott and Morris2003, Reference Work, Balazs, Rameyer and Morris2004) found that green turtles with tumour scores TS3 had SCL significantly larger than turtles with scores TS1 and TS2. Aguirre et al. (Reference Aguirre, Balazs, Zimmerman and Spraker1994) showed that green turtles with FP were larger and heavier than those without FP. Adnyana et al. (Reference Adnyana, Ladds and Blair1997) suggested that the higher FP prevalence in larger turtles inhabiting polluted waters could be due to a possible association between the duration of exposure to pollutants and the development of tumours. Chaloupka & Balazs (Reference Chaloupka and Balazs2005) suggested that larger turtles may have more severe tumours because they are presumably older and so could have had a longer exposure to the factors that cause the disease.
Turtles with tumours tended to weigh less than turtles of the same CCL in normal health condition (Figure 6), and the growth rate of tumoured turtles in classes T-TS2 and T-TS3 was smaller than that of turtles in classes NoT-N and T-TS1 (Figure 8). Balazs et al. (Reference Balazs, Puleloa, Medeiros, Murakawa, Ellis, Epperly and Braun1998, Reference Balazs, Murakawa, Ellis, Aguirre, Abreu-Grobois, Briseño-Dueñas, Márquez and Sarti2000) found a significant difference in growth rate among the different tumour scores for green turtles in Hawaii; turtles with higher tumour scores had smaller growth rates. Chaloupka & Balazs (Reference Chaloupka and Balazs2005) observed that turtles with severe tumour affliction (TS3) exhibited significantly slower growth rates when compared with turtles without tumours.
In the present study, turtles in the T-TS3 class had tumours mainly on or around the eyes, on the flippers and neck and sometimes on the tail and carapace; this caused problems like reduction in vision or blindness and in some cases reduction in the turtles' ability to dive; the outcome was often some difficulty in feeding, which probably negatively affected the growth rate. Adnyana et al. (Reference Adnyana, Ladds and Blair1997) observed a strong negative correlation between the number of tumours on or around the eyes of green turtles and the weight/CCL ratio, an index that was intended to assess the degree of debility of the animals; these authors stated that the impaired vision presumably interfered with the turtles' ability to feed. Fibropapillomatosis can also interfere with the hydrodynamics and swimming ability of sea turtles (Balazs & Pooley, Reference Balazs and Pooley1991).
No tumours were observed in this study in the oral region of the turtles. In Florida, USA, in 1980–2002, among 280 stranded green turtles with FP that were necropsied, one turtle (0.4%) had oral tumours, and, in 1994–2002, among 127 green turtles captured at the water intake channel of a power plant and found to have FP, one turtle (0.8%) had oral tumours (Bresette et al., Reference Bresette, Foley, Singewald, Singel, Herren and Redlow2003). In Hawaii, higher rates of oral tumours were observed: in 1989–1997, for green turtles captured through diving, 40% of the turtles with FP had oral tumours (N = 255 turtles with FP; Balazs et al., Reference Balazs, Murakawa, Ellis, Aguirre, Abreu-Grobois, Briseño-Dueñas, Márquez and Sarti2000); and among 254 green turtles stranded in 1993–2003, 203 (80%) had oral tumours (Work et al., Reference Work, Balazs, Rameyer and Morris2004).
The origin of the green turtles found in the discharge channel is unknown since no genetic analyses have been performed of the captured turtles. Several green turtle rookeries, some of them with a relatively large annual number of nestings, exist in the Atlantic (Hirth, Reference Hirth1997). Naro-Maciel et al. (Reference Naro-Maciel, Becker, Lima, Marcovaldi and DeSalle2007) showed through genetic analyses based on mitochondrial DNA (mtDNA) that juvenile green turtles found in Almofala, State of Ceará, northern Brazil, and in Ubatuba, State of São Paulo, south-eastern Brazil, originate largely from Ascension Island (United Kingdom) but also possibly from several other rookeries in the Atlantic, mainly Tortuguero (Costa Rica), Matapica (Surinam), Aves Island (Venezuela) and Trindade Island (Brazil).
Due to the special ecological conditions in the discharge channel, the results obtained in this study should be extrapolated to green turtles in other areas of the Espírito Santo coast only with caution.
ACKNOWLEDGEMENTS
We would like to thank the ArcelorMittal Tubarão Steel Company for financial and operational support for this research, and also the trainees (university students) and fishermen who helped to capture and handle the turtles. Our thanks also to Dr Ana Paula Valentim Pereira, who identified the kinds of algae found in the effluent discharge channel. We are much indebted to the two anonymous referees, whose thoughtful comments and ideas helped us to improve significantly the manuscript. This article is a modified and extended version of a master's thesis in biological sciences presented by the first author (E.T.) to Universidade Federal do Espírito Santo in 2004; E.T. thanks Coordenação de Aperfeiçoamento de Pessoal de Nível Superior (CAPES) for financial support. Projeto TAMAR, a conservation programme of the Brazilian Ministry of the Environment, is affiliated with ICMBio (the Brazilian Institute for Biodiversity Conservation—Instituto Chico Mendes), is co-managed by Fundação Pró-Tamar and is officially sponsored by Petrobras.