


A long-standing critique of social science experiments is that evidence which supports researcher expectations is an artifact of “experimenter demand effects” (EDEs) (Iyengar Reference Iyengar, Druckman, Green, Kuklinski and Lupa2011; Orne Reference Orne1962; Sears Reference Sears1986; Zizzo Reference Zizzo2010). The concern is that experimental subjects infer the response researchers expect and behave in line with these expectations—and differently than they otherwise would. The result is biased evidence that supports a researcher’s hypotheses only due to the efforts of subjects. Concern over EDEs and related phenomena (e.g., so-called “Hawthorne” effectsFootnote 1) is evidenced by the considerable effort researchers expend guarding against them. These countermeasures range from subtle attempts to disguise experimental treatments and key outcome measures, to deceptive statements aimed at masking a study’s intent.
While the concept of EDEs originated to critique laboratory experiments in psychology (Orne Reference Orne1962), the threat they pose is now highly relevant for political science given the widespread use of survey experiments across the field (see, e.g., Gaines, Kuklinski, and Quirk Reference Gaines, Kuklinski and Quirk2007 and Mutz Reference Mutz2011). A particular concern is that survey experiments frequently utilize online subject pools, such as Amazon’s Mechanical Turk, with a potentially high capacity to produce demand effects. Respondents in these settings often have extensive prior experience participating in social science research and are attentive to researcher expectations to ensure they receive positive assessments of their performance and compensation for their work (Goodman, Cryder, and Cheema Reference Goodman, Cryder and Cheema2013; Krupnikov and Levine Reference Krupnikov and Levine2014). In a highly influential study,Footnote 2 Berinsky, Huber, and Lenz (Reference Berinsky, Huber and Lenz2012, 366) recommend researchers avoid revealing their intentions in online survey experiments due to concerns about EDEs (see also Paolacci and Chandler Reference Paolacci and Chandler2014, 186). They write:
M-Turk respondents…may also exhibit experimental demand characteristics to a greater degree than do respondents in other subject pools, divining the experimenter’s intent and behaving accordingly (Orne Reference Orne1962; Sears Reference Sears1986). To avoid this problem and the resulting internal validity concerns, it may be desirable to avoid signaling to subjects ahead of time the particular aims of the experiment. Demand concerns are relevant to any experimental research, but future work needs to be done to explore if these concerns are especially serious with respect to the M-Turk respondent pool…
If present, EDEs could undermine experimental results in an array of major literatures in political science. Yet there is little evidence demonstrating (1) the existence of EDEs in survey experiments or (2) the degree to which EDEs distort findings from these studies (but see de Quidt, Haushofer, and Roth Reference de Quidt, Haushofer and Roth2018 and White et al. Reference White, Strezhnev, Lucas, Kruszewska and Huff2018).
Replicating five prominent experimental designs that span all empirical subfields of political science, we assess the severity and consequences of demand effects by randomly assigning participants to receive information about the purpose of each experiment before participating. This information takes various forms across the different studies and includes hints about the focus of the experiment, explicit statements that relay the hypothesis advanced in the original study and a directional treatment scheme where different groups are provided with opposing expectations about the anticipated direction of the treatment effect. We conduct these experiments on convenience samples from Amazon’s Mechanical Turk, where the potential for demand effects is thought to be particularly severe, as well as more representative samples from an online survey vendor. Across five surveys that involve more than 12,000 respondents and over 28,000 responses to these experiments, we fail to find evidence for the existence of EDEs in online survey experiments. That is, on average, providing respondents with information about the hypothesis being tested does not affect how they respond to the subsequent experimental stimuli.
To examine a most-likely case for EDEs, we also include conditions where respondents are given both information about experimenter intent and a financial incentive for responding in a manner consistent with researcher expectations. When this added incentive is present, we are sometimes able to detect differences in observed treatment effects that are consistent with the presence of EDEs. But on average, pooling across all our experiments, we still see no detectable differences in treatment effects even when financial incentives are offered.
While we cannot completely rule out the existence of EDEs, we show that conditions which should magnify their presence do not facilitate the confirmation of researcher hypotheses in a typical set of experimental designs. When made aware of the experiment’s goal, respondents did not generally assist researchers. These results have important implications for the design, implementation, and interpretation of survey experiments. For one, they suggest that traditional survey experimental designs are robust to this long-standing concern. In addition, efforts to obfuscate the aim of experimental studies due to concerns about demand effects, including ethically questionable modes of deception, may be unnecessary in a variety of settings.Footnote 3
CONCERNS ABOUT EXPERIMENTER DEMAND EFFECTS
Orne (Reference Orne1962) raises a fundamental concern for the practice of experimental social science research: in an attempt to be “good subjects,” participants draw on study recruitment materials, their interactions with researchers, and the materials included in the experiment to formulate a view of the behavior that researchers expect of them. They then attempt to validate a researcher’s hypothesis by behaving in line with what they perceive as the expected behavior in a study. These “demand effects” represent a serious methodological concern with the potential to undercut supportive evidence from otherwise compelling research designs by offering an artifactual, theoretically uninteresting explanation for nearly any experimental finding (see also Bortolotti and Mameli Reference Bortolotti and Mameli2006; Rosnow and Rosenthal Reference Rosnow and Rosenthal1997; Weber and Cook Reference Weber and Cook1972; Zizzo Reference Zizzo2010).
While rooted in social psychology laboratory studies that involve substantial researcher–subject interaction (e.g., Iyengar Reference Iyengar, Druckman, Green, Kuklinski and Lupa2011), concerns about EDEs extend to other settings. In particular, demand effects also have the potential to influence experimental results in the substantial body of research employing survey experiments to study topics throughout social science. In what follows, we define survey experiments as studies in which research subjects self-administer a survey instrument containing both the relevant experimental treatments and outcome measures. This encompasses a broad class of studies in which participants recruited through online labor markets (Berinsky, Huber, and Lenz Reference Berinsky, Huber and Lenz2012), survey vendors (Mutz Reference Mutz2011), local advertisements (Kam, Wilking, and Zechmeister Reference Kam, Wilking and Zechmeister2007), or undergraduate courses (Druckman and Kam Reference Druckman, Kam, Druckman, Green, Kuklinski and Lupia2011) receive and respond to experimental treatments in a survey context.
This focus serves two purposes. First, these scope conditions guide our theorizing about potential channels through which demand effects may or may not occur by limiting some avenues (e.g., cues from research assistants) credited with conveying demand characteristics to experimental participants in laboratory settings (Orne and Whitehouse Reference Orne, Whitehouse and Kazdin2000). Second, this definition encompasses a substantial body of social science research, making a focused assessment of EDEs relevant for the wide array of studies that employ this methodological approach (see Mutz Reference Mutz2011, Sniderman Reference Sniderman, Druckman, Green, Kuklinski and Lupia2011, Gaines, Kuklinski, and Quirk Reference Gaines, Kuklinski and Quirk2007 for discussions of the growth of survey experiments in political science).
EXPERIMENTER DEMAND EFFECTS IN SURVEY EXPERIMENTS
Concerns over EDEs are not limited to laboratory studies and are often explicitly invoked by researchers when discussing the design and interpretation of survey experiments. In a survey experiment evaluating how seeing Muslim women wearing hijabs affects attitudes related to representation, Butler and Tavits (Reference Butler and Tavits2017) show politicians images of men and women in which either some or none of the women wear hijabs. The authors avoid a treatment in which all the women in the image wear hijabs, “because we wanted to mitigate the possibility of a demand effect” (728). Huber, Hill, and Lenz (Reference Huber, Hill and Lenz2012) employ a multi-round behavioral game meant to assess how citizens evaluate politicians’ performance and take care to address the concern that participants will come to believe their performance in later rounds counts more than in early rounds, thereby inducing “a type of demand effect” (727).
Countermeasures to combat the threat of EDEs in survey experiments stem from a shared assumption that demand effects can be limited by obfuscating an experimenter’s intentions from participants. In one approach, researchers disguise experimental treatments and primary outcome measures. Fowler and Margolis (Reference Fowler and Margolis2014, 103) embed information about the issue positions of political parties in a newspaper’s “letter to the editor” section, rather than provide the information directly to respondents, to minimize the possibility that subjects realize the study’s focus. Hainmueller, Hopkins, and Yamamoto (Reference Hainmueller, Hopkins and Yamamoto2014, 27) advocate the use of “conjoint” experiments, in which respondents typically choose between two alternatives (e.g., political candidates) comprised of several experimentally manipulated attributes, in part because the availability of multiple attributes conceals researcher intent from participants. Druckman and Leeper (Reference Druckman and Leeper2012, 879) examine the persistence of issue framing effects across a survey panel and only ask a key outcome measure in their final survey to counteract a hypothesized EDE in which participants would otherwise feel pressured to hold stable opinions over time.
In a second approach, researchers use cover stories to misdirect participants about experimenter intent (e.g., Bortolotti and Mameli Reference Bortolotti and Mameli2006; Dickson Reference Dickson, Druckman, Green, Kuklinski and Lupia2011; McDermott Reference McDermott2002). Kam (Reference Kam2007, 349) disguises an experiment focused on implicit racial attitudes by telling participants the focus is on “people and places in the news” and asking questions unrelated to the experiment’s primary goal. In studies of the effects of partisan cues, Bullock (Reference Bullock2011, 499) and Arceneaux (Reference Arceneaux2008, 144) conceal their focus by telling participants the studies examine the public’s reaction to “news media in different states” and “how effectively the Internet provides information on current issues.”
POTENTIAL LIMITS ON EDES IN SURVEY EXPERIMENTS
Concerns about EDEs in survey experiments are serious enough to influence aspects of experimental design. However, there is limited empirical evidence underlying these concerns in the survey experimental context. Recent studies have begun to assess the presence and severity of demand effects in some survey settings. White et al. (Reference White, Strezhnev, Lucas, Kruszewska and Huff2018) test whether the characteristics of survey researchers—one potential source of experimenter demand in online settings—alter experimental results. They find that manipulating the race and gender of the researcher in a pre-treatment consent script has no discernible effect on experimental results. de Quidt, Haushofer, and Roth (Reference de Quidt, Haushofer and Roth2018) probe for demand effects in experimental designs common in behavioral economics, including dictator and trust games. They conclude that EDEs are modest in these settings. Despite these new developments, there is still limited evidence for the presence or absence of demand effects in survey experiments with attitudinal outcomes—where respondents face fewer costs for expressive responding than in behavioral games with a monetary incentive—and in situations where experimenter intent is conveyed in a direct manner, rather than indirectly through the inferences respondents make based on researcher demographics.
There are distinctive aspects of survey experiments that cast some doubt on whether the EDE critique generalizes to this setting. One set of potential limitations concerns subjects’ ability to infer experimenter intent in survey experiments. Even absent a cover story, survey experiments typically utilize between-subject designs that provide no information on the experimental cell in which participants have been placed. Treatments in these studies are also embedded inside a broader survey instrument, blurring the line between the experimental sections of the study and non-randomized material that all respondents encounter.
These features create a complicated pathway for participants to infer experimenter intent. Respondents must not only parse the experimental and non-experimental portions of the survey instrument but, having done so, they need to reason out the broader experimental design and determine the behavior that aligns with the experimenter’s intentions, even as they only encounter a single cell in the broader experimental design. If errors occur in this process, even would-be “helpful” subjects will often behave in ways that fail to validate researcher expectations.
Of course, the process through which subjects respond to an experiment’s demand characteristics may not be so heavily cognitive. The primary source of demand effects in laboratory experiments are subtle cues offered by researchers during their direct interactions with experimental participants (Rosnow and Rosenthal Reference Rosnow and Rosenthal1997, 83; see also; Orne and Whitehouse Reference Orne, Whitehouse and Kazdin2000). However, the context in which many survey experiments are conducted blocks this less cognitively taxing path for demand effects to occur. Online survey experiments fit into a class of “automated” experiments featuring depersonalized interactions between researchers and subjects. Theories about the prevalence of demand effects in experimental research consider automated experiments to be a least-likely case for the presence of EDEs (Rosenthal Reference Rosenthal1976, 374–375; Rosnow and Rosenthal Reference Rosnow and Rosenthal1997, 83). In line with these accounts, online experiments were considered a substantial asset for reducing the presence of EDEs at the outset of this type of research (Piper Reference Piper1998; McDermott Reference McDermott2002, 34; Siah Reference Siah2005, 122–3).
A second set of potential limitations is that, even if participants correctly infer experimenter intent and interpret the complexities of the survey instrument, they may not be inclined to assist researchers. While EDEs rely on the presence of “good subjects,” other scholars raise the possibility of “negativistic subjects” who behave contrary to what they perceive to be researcher intentions (Cook et al. Reference Cook, Bean, Calder, Frey, Krovetz and Resiman1970; Weber and Cook Reference Weber and Cook1972) or participants who are simply indifferent to researcher expectations (Frank Reference Frank1998). To the extent these other groups exhibit the on-average inclination of a subject pool, they would defy researcher expectations. While there is limited empirical evidence on the distribution of these groups in various subject pools, prior studies offer suggestive evidence that fails to align with the “good subject” perspective. Comparing findings between experienced experimental participants drawn from online subject pools (who are potentially better at discerning experimenter intentions), and more naive participants, researchers find that treatment effects are smaller among the more experienced subjects (Chandler, Mueller, and Paolacci Reference Chandler, Mueller and Paolacci2014; Chandler et al. Reference Chandler, Paolacci, Peer, Mueller and Ratfliff2015; Krupnikov and Levine Reference Krupnikov and Levine2014). At least for the online samples now common in survey experimental research, this is more in line with a negativistic, or at least indifferent, portrayal of experimental subjects than accounts where they attempt to validate researcher hypotheses.
Despite the widespread concern over EDEs in online survey experiments, our discussion highlights several elements that may limit demand effects in these studies. However, there is limited evidence to test between this account and other perspectives in which EDEs create widespread problems for survey experiments in political science. For this reason, the next section introduces a research design to empirically examine demand effects in political science survey experiments.
RESEARCH DESIGN
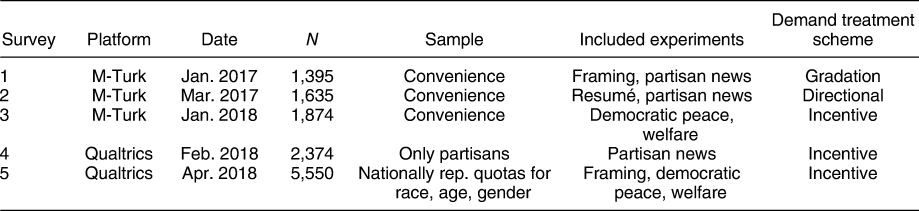
We deploy a series of experiments specifically designed to assess the existence and magnitude of EDEs. We do so by replicating results from well-known experimental designs while also randomizing the degree to which the purpose of the experiment is revealed to participants. Our data come from five surveys fielded on two survey platforms (see Table 1). The first three surveys were conducted on Amazon’s Mechanical Turk, which hosts an experienced pool of survey respondents (see, e.g., Berinsky, Huber, and Lenz Reference Berinsky, Huber and Lenz2012; Hitlin Reference Hitlin2016). The last two samples were purchased from the survey vendor Qualtrics, the second of which was quota sampled to meet nationally representative targets for age, race, and gender. In cases where more than one experiment was embedded within a single survey instrument, all respondents participated in each experiment, though the participation order was randomized.
Survey Samples
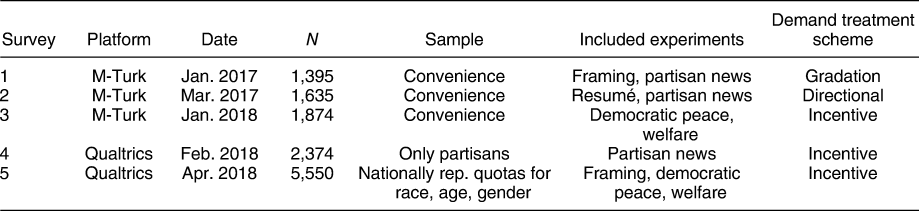
While the convenience sample of respondents from Mechanical Turk used in the first three studies may present disadvantages for many types of research, we view it as an ideal data source in this context. Prior research portrays Mechanical Turk as a particularly likely case for demand effects to occur based on the labor market setting in which subjects are recruited (e.g., Berinsky, Huber, and Lenz Reference Berinsky, Huber and Lenz2012; Paolacci and Chandler Reference Paolacci and Chandler2014). These platforms host experienced survey participants that are especially attentive to researcher expectations due to the concern that they will not be compensated for low-quality work (i.e., the requester may not approve their submission) and their need to maintain a high work approval rate to remain eligible for studies that screen on past approval rates. This attentiveness creates the possibility that, in an attempt to please researchers, respondents will react to any features of an experiment that reveal the response expected of them by the researcher. If we fail to observe EDEs using these samples, we may be unlikely to observe them in other contexts. However, in order to speak to the threat of EDEs in higher-quality respondent pools, we present results from Qualtrics samples as well. In what follows, we first outline the published studies we chose to replicate. We then describe three different experimental schemes that were employed to test for the presence and severity of demand effects.
REPLICATED STUDIES
To test for the presence and severity of EDEs, we replicate five published studies. Two studies come from the American Politics literature. The first is a classic framing study, a substantive area where concerns over demand effects have been expressed in laboratory contexts (e.g., Page Reference Page1970; Sherman Reference Sherman1967). In this experiment, respondents read a hypothetical news article about a white supremacist group attempting to hold a rally in a US city (Mullinix et al. Reference Mullinix, Leeper, Druckman and Freese2015; Nelson, Clawson, and Oxley Reference Nelson, Clawson and Oxley1997). In the control condition, respondents saw an article describing the group’s request to hold the rally. In the treatment condition, respondents saw a version of the article highlighting the group’s first amendment right to hold the rally. Both groups were then asked how willing they would be to allow the rally. The hypothesis, based on prior findings, was that those exposed to the free speech frame would be more likely to support the group’s right to hold the rally.
The second experiment was inspired by Iyengar and Hahn (Reference Iyengar and Hahn2009), which tests whether partisans are more likely to read a news article if it is offered by a news source with a reputation for favoring their political party (i.e., partisan selective exposure). We offered participants two news items displayed in a 2 × 2 table (see Figure A.2 in the Online Appendix), each with randomized headlines and sources, and asked them to state a preference for one or the other. The sources were Fox News (the pro-Republican option), MSNBC (the pro-Democrat option), and USA Today [the neutral option (Mummolo Reference Mummolo2016)]. Responses were analyzed in a conjoint framework (Hainmueller, Hopkins, and Yamamoto Reference Hainmueller, Hopkins and Yamamoto2014), in which each of the two news items offered to each respondent was treated as a separate observation.Footnote 4 The inclusion of a conjoint design—especially one with so few manipulated attributesFootnote 5—offers another avenue for EDEs to surface, as within-subject designs are thought to contain, “the potential danger of a purely cognitive EDE if subjects can glean information about the experimenter’s objectives from the sequence of tasks at hand,” but may offer increased statistical power relative to between-subject experiments (Zizzo Reference Zizzo2010, 84; see also Charness, Gneezy, and Kuhn Reference Charness, Gneezy and Kuhn2012 and Sawyer Reference Sawyer1975).
We replicate one study from International Relations, a highly cited survey experiment by Tomz and Weeks (Reference Tomz and Weeks2013) examining the role of public opinion in the maintenance of the “Democratic Peace”—the tendency of democratic nations not to wage war on one another. In this experiment, respondents assessed a hypothetical scenario in which the United States considers whether to use force against a nation developing nuclear weapons. The experiment supplied respondents with a list of attributes about the unnamed country in question, one of which is whether the country is a democracy (randomly assigned). The outcome is support for the use of force against the unnamed country.
We replicate one study from Comparative Politics concerning attitudes toward social welfare (Aarøe and Petersen Reference Aarøe and Petersen2014). In this experiment, respondents are presented with a hypothetical welfare recipient who is described as either unlucky (“He has always had a regular job, but has now been the victim of a work-related injury.”) or lazy (“He has never had a regular job, but he is fit and healthy. He is not motivated to get a job.”). Following this description, we measure support for restricting access to social welfare.
Finally, we replicate a resumé experiment (Bertrand and Mullainathan Reference Bertrand and Mullainathan2004) in which a job applicant is randomly assigned a stereotypically white or African American name. We hold all other attributes of the resumé constant and ask respondents how willing they would be to call the job applicant for a job interview. Our expectation, based on prior results, was that respondents who saw the job candidate with the stereotypically African American name would be less likely to say they would call the candidate for an interview.
In general, we are able to recover treatment effects in our replications that are highly similar in both direction and magnitude to the previous studies they are based on (see Figures B.3–B.7 in Online Appendix). The one exception is the resumé experiment, where we do not observe evidence of anti-Black bias. We suspect this difference stems from varying context. The original study was a field experiment conducted on actual employers relative to the survey experiment on a convenience sample that is used here [though a recent labor market field experiment (Deming et al. Reference Deming, Yuchtman, Abulafi, Goldin and Katz2016), also failed to find consistent race effects]. Nevertheless, we include results from the resumé experiment below because our interest is primarily in how revealing an experiment’s hypothesis affects respondent behavior, not the effect of the treatment in the original study.
MANIPULATING THE THREAT OF DEMAND EFFECTS
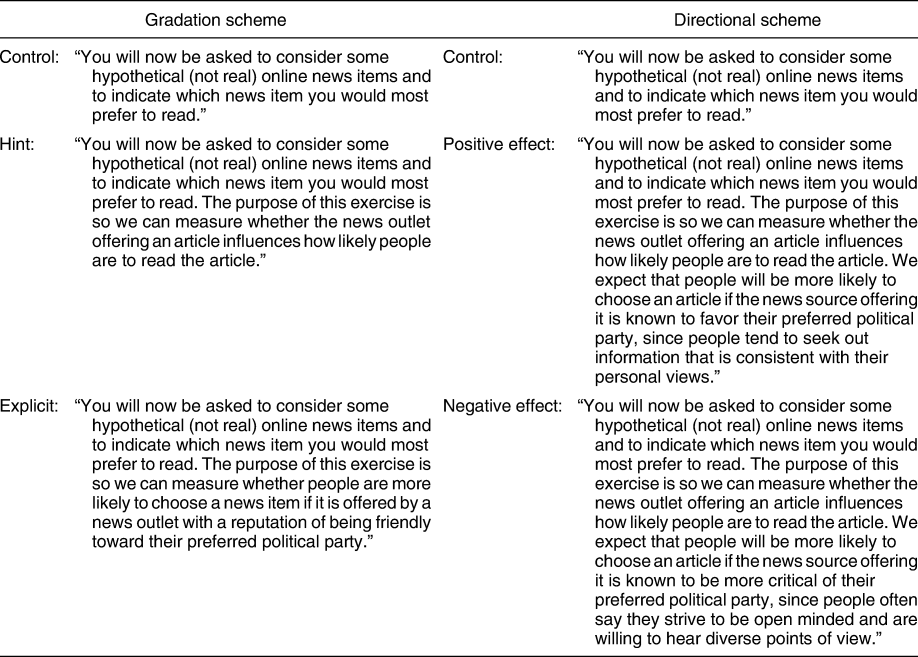
Using these five experimental designs, we manipulate the risk of EDEs with three approaches, all of which involve providing respondents varying degrees of information about experimenter intentions prior to participating in one of the experiments described above. The presence or absence of this additional information was randomized independently of the treatments within each experiment. In the first approach, which we term the “Gradation” scheme, we randomly assign respondents to receive either no additional information, a hint about the researcher’s hypothesis, or an explicit description of the researcher’s hypothesis.
We next employ a “Directional” scheme that manipulates the anticipated direction of the expected treatment effect, assigning respondents to receive either no additional information, an explicit hypothesis stating the treatment will induce a positive shift in the outcome, or an explicit hypothesis stating the treatment will induce a negative shift in the outcome. (To make the expectations presented in the “Directional” scheme plausible, we also add a brief justification for why we hypothesize the given effect.) This directional design eliminates the possibility that we will fail to observe EDEs simply because respondents are predisposed to behave in line with researcher expectations even in the absence of knowledge of a study’s hypothesis. For example, if no EDEs occur in the gradation version of the partisan news experiment, it may be because respondents were already inclined to respond positively to the politically friendly news source, making demand behavior and sincere responses observationally equivalent. The directional design breaks this observational equivalence.
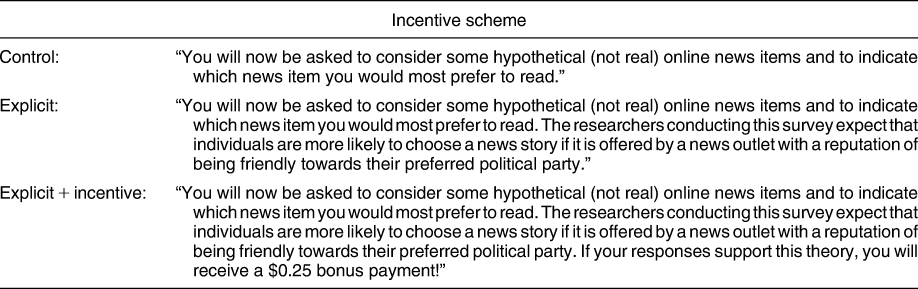
Finally, we use an “Incentive” scheme that offers a financial incentive for assisting the researcher in confirming their hypothesis—an approach that maximizes the likelihood of observing EDEs, helps us adjudicate between different mechanisms that may produce or inhibit EDEs, and sheds light on the external validity of our findings (we discuss this design and its implications in greater detail below). Table 2 displays the wording of the first two EDE treatment schemes in the context of the partisan news experiment (see Online Appendix A for wording used in the other experiments).
Text of EDE Treatments in Partisan News Experiment

The quantity of interest in all these experiments is a difference-in-differences. Specifically, we estimate the difference in an experiment’s treatment effect due to revealing information about its purpose to participants. This quantity is represented by the following expression:
 $$\hskip-77pt\eqalignb{\left( {E[ {{\rm{response}}|{\rm{information,}}\; {\rm{treatment}} \right]}}\right\)\cr {- E\left[ {{\rm{response}}|{\rm{information,}} \;{\rm{control}} \right])}}}}}} \right\)$$
 $$\hskip-53pt\eqalignb{- \left( {E[ {{\rm{response}}|{\rm{no}}\;{\rm{information,}} \;{\rm{treatment}} \right]}}\right\)\cr - E\left[ {{\rm{response}}|{\rm{no}}\;{\rm{information,}} \;{\rm{control}} \right]}\right)}}}.$$
This estimand captures the degree to which demand effects, if present, are consequential for the conclusions produced by survey experimental research. If the traditional EDE critique is valid, offering this information should lead participants to assist in the confirmation of each hypothesis and make treatment effects in the presence of additional information about the experiment’s aim larger (in absolute value) than in the absence of such information. This quantity focuses attention on the key source of concern regarding demand effects: Does their presence alter the treatment effects researchers obtain from survey experiments?
RESULTS
A first-order concern is verifying that respondents grasped the information the demand treatments revealed about the purpose of the experiments. As a manipulation check, we measure respondent knowledge of the purpose of each experiment by asking them to choose from a menu of six or seven (depending on the experiment) possible hypotheses following each experiment.Footnote 6 Across all the studies, the mean rate of correctly guessing the hypothesis among those provided no additional information was 33%. This suggests that the actual hypotheses were not prohibitively obvious, and that it should be possible to manipulate the risk of EDEs by revealing additional information.
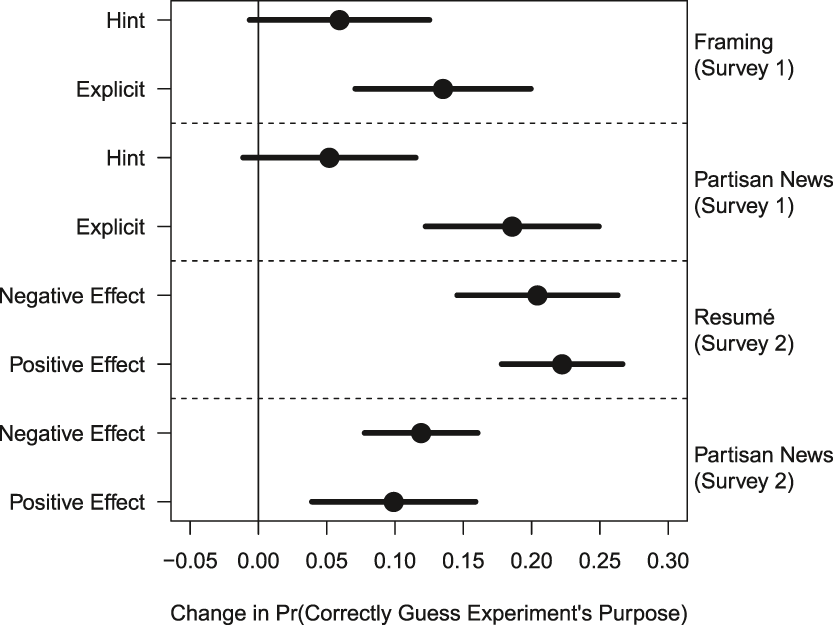
Figure 1 displays the results of OLS regressions of indicators for guessing the purpose of the experiment on indicators for the EDE treatment conditions. Turning first to the “Gradation” treatment scheme in the framing experiment, those in the hint and explicit conditions were six- and 14-percentage-points more likely to correctly guess the researcher’s hypotheses relative to those who were given no information on the experiment’s purpose. We see similar results in the partisan news experiment. Compared to the baseline condition with no demand information, those in the hint and explicit conditions were five- and 19-percentage-points more likely to correctly guess the hypothesis. Even among this M-Turk sample comprised of respondents thought to be particularly attentive, an explicit statement of experimenter intent is necessary to produce large increases in awareness of a study’s focus.
Manipulation Check: Information Treatments Increase Risk of EDEs
Note: The figure displays the effects of revealing information about an experiment's hypothesis on the probability of correctly guessing the experiment's hypothesis from a multiple choice list later in the survey. The results indicate the treatments were effective at increasing the share of respondents aware of the experiment's hypothesis, thereby increasing the theoretical risk of EDEs. Bars represent 95% confidence intervals.
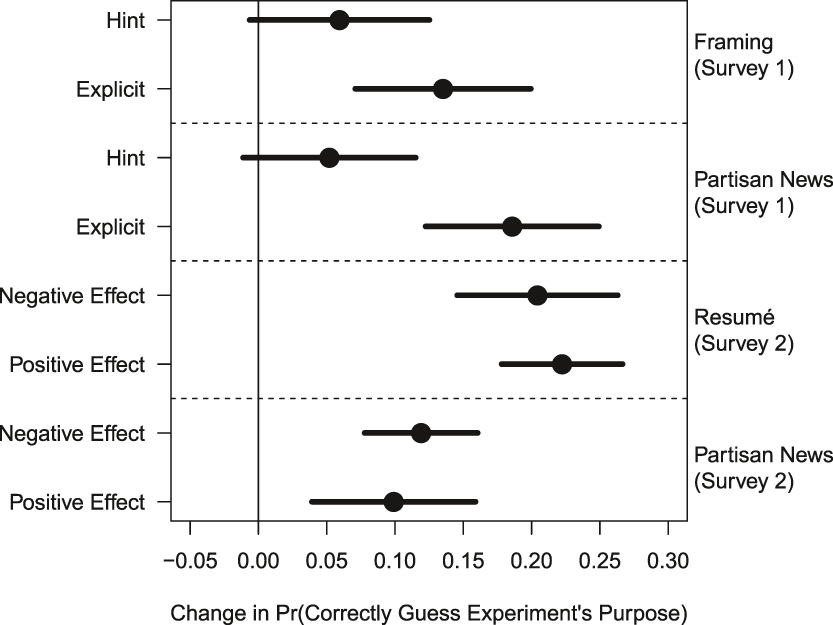
The manipulations also worked as intended in the “Directional” EDE experiments. In this case, respondents in the information conditions were informed we either hypothesized a positive or negative effect, so we define a “correct” guess as a respondent accepting whatever directional justification was offered in the treatment they received. For respondents in the news experiment, for example, this means individuals in the “positive” treatment condition were correct if they guessed the purpose was to show a preference for news from co-partisan sources and individuals in the “negative” treatment condition were correct if they guessed the expectation was to show a preference for news from out-party sources. In these experiments, additional information induced between 10- and 22-percentage-point increases in the probability of guessing the experiment’s purpose later in the survey. This means the additional information successfully changed what participants understood as the purpose of the experiments, moving respondent perceptions in the “positive” conditions in a different direction than their counterparts in the “negative” conditions. Relative to the unidirectional treatments in Survey 1, this alternative scheme drives a wider wedge between the perceptions of the two information conditions, amplifying the potential risk for EDEs to alter the treatment effects estimated in these groups relative to the uninformed control group.
While the increases in the rates of correctly guessing a study’s hypothesis are detectable, there remain sizable shares of respondents who fail to infer the hypothesis even when it is explicitly stated to them. This suggests that many survey respondents are simply inattentive—one mechanism that may diminish the threat of EDEs. If survey respondents are not engaged enough to recall information presented to them minutes earlier, it is unlikely they will successfully navigate the complex task of inducing EDEs.
We now turn to our key test, which measures the differences in treatment effects between conditions where respondents were given additional information about an experiment’s hypothesis, and conditions where they were given no additional information. We again note here that, aside from the previously discussed issues with the resumé experiment included in Survey 2, the treatment effects in the baseline conditions closely align with the effects in the prior studies they replicate (see Online Appendix B). This means these tests examine deviations from familiar baseline estimates of the treatment effects due to the introduction of information about researcher expectations.
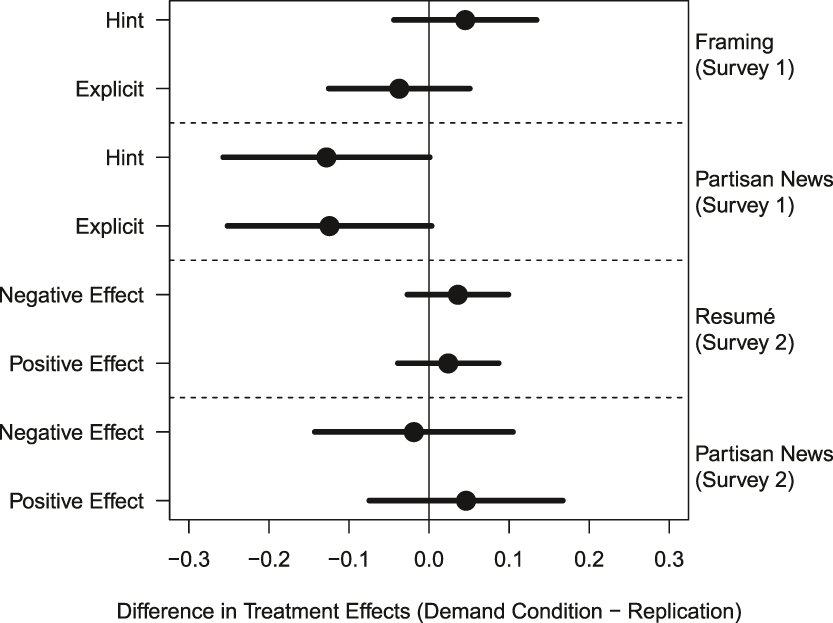
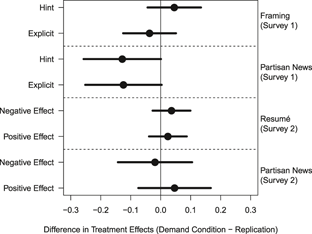
This first set of tests uses two samples from Amazon’s Mechanical Turk. Figure 2 displays the results of the “Gradation” and “Directional” treatments across the framing, partisan news and resumé experiments. We find no evidence that any of the demand treatments changed the substantive treatment effects of primary interest in these studies. In general, these treatment effects are statistically indistinguishable from the ones we observe in the control condition (i.e., the effects produced by replicating the published studies without supplying any additional information). The only borderline statistically significant results come from the first partisan news experiment, where revealing the hypothesis made respondents less likely to respond in ways that would confirm it. However, this attenuation was not replicated in the second partisan news experiment, raising doubts about the robustness of this finding. Overall, we find no support for the key prediction of the demand effects hypothesis. Although we successfully moved respondent perceptions of the purpose of each experiment, revealing this information did not help to confirm the stated hypotheses.
No Evidence of EDEs When Revealing Hypothesis
Note: The figure displays the differences in treatment effects (difference-in-differences) between conditions where respondents were given information on a researcher's hypothesis, and the control condition in which no additional information was given. Positive estimates indicate changes in the treatment effect in the direction of the stated hypothesis. The results show no evidence that knowledge of the researcher's expectations causes respondents to help confirm a hypothesis. Bars represent 95% confidence intervals.
ARE SURVEY RESPONDENTS CAPABLE OF INDUCING DEMAND EFFECTS?
Finding no evidence for demand effects in the initial surveys, we conducted additional surveys designed to parse the mechanism behind these null effects by maximizing the risk of EDEs. As theorized above, there are at least two plausible reasons why EDEs may fail to materialize even when respondents are armed with information about an experimenter’s hypothesis. First, respondents may be unable, perhaps due to cognitive limitations, to respond in ways that produce EDEs. Alternatively, respondents may be capable of inducing demand effects but simply not inclined to do so, as in portrayals of indifferent or negativistic research participants.
To arbitrate between these mechanisms, we implement a third EDE treatment scheme in which respondents encountered no information, an explicit statement of the hypothesis, or an explicit statement paired with the offer of a bonus payment if respondents answered questions in a way that would support the stated hypothesis. Table 3 displays the text of these treatment conditions in the partisan news experiment (see Tables A.1–A.3 in Online Appendix for wording in other experiments). These bonuses were for $0.25. Amounts of similar magnitude have proven sufficient to alter respondent behavior in other contexts. For instance, Bullock et al. (Reference Bullock, Gerber, Hill and Huber2015, 539) find that the opportunity for bonuses of this scale reduced the size of partisan gaps in factual beliefs by 50%.
Text of Incentive Scheme Treatments in Partisan News Experiment

If we make the reasonable assumption that survey respondents would rather earn more money for their time than intentionally defy a request from a researcher, offering additional financial incentives for exhibiting demand effects can shed light on the mechanism behind the lack of EDEs in the first two surveys. If EDEs fail to occur even when an additional financial reward is offered, we can infer that inability likely precludes demand effects. If, on the other hand, financial incentives produce EDEs, we can infer that the previous null results were likely due to a lack of desire from respondents to engage in demand-like behavior.
Determining whether respondents are unwilling, or simply unable, to produce EDEs helps inform the external validity of this study. The experiments replicated here are likely candidates for EDEs as they employ fairly straightforward designs, with only one treatment and one control condition, and make minimal effort to disguise researcher intent (i.e., no deception). If we determine that respondents are unable to produce EDEs even in this environment, it is likely that more complex experimental designs not replicated here are even more robust to EDEs.
To test this, we again conduct the framing and partisan news experiments, and also replicate two additional experiments: Tomz and Weeks (Reference Tomz and Weeks2013)—a study of democratic peace theory—and Aarøe and Petersen (Reference Aarøe and Petersen2014) which hypothesizes that support for social welfare programs will be greater when welfare recipients are described as unlucky rather than lazy. In all experiments, respondents are either told nothing about the hypotheses, told the hypotheses explicitly, or told the hypotheses explicitly and offered a bonus payment for responding in accordance with these expectations.
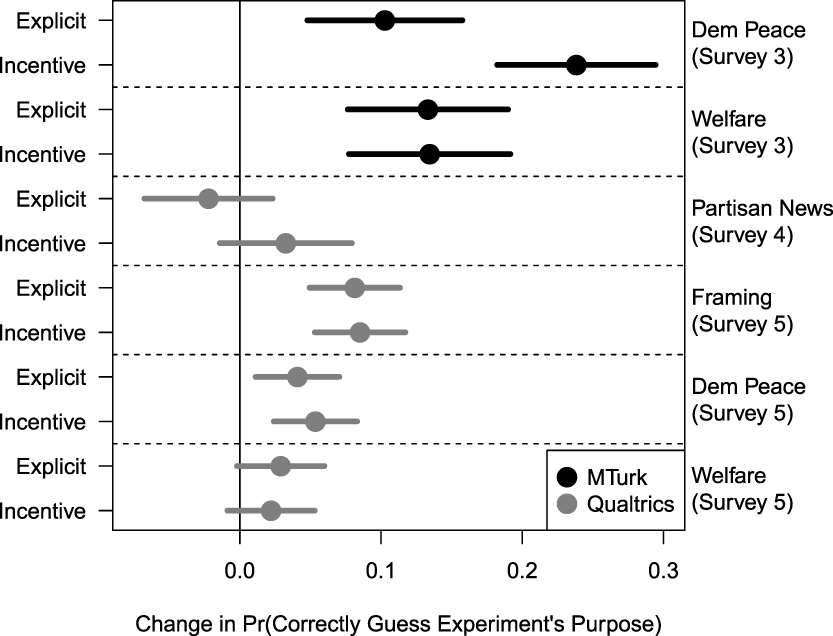
Before discussing the main results, we again reference manipulation checks. Figure 3 displays changes in the probability of correctly guessing each experiment’s hypothesis relative to the control condition where no information on the hypothesis was provided. As the figure shows, the information treatments again increased the share of respondents aware of each hypothesis, though the effects are much larger in the M-Turk samples than in the Qualtrics samples, a point to which we will return below.
Manipulation Check: Information and Incentive Treatments Increase Risk of EDEs
Note: The figure displays the effects of revealing information on an experiment's hypothesis on the probability of correctly guessing the experiment's hypothesis from a multiple choice list later in the survey. The results indicate the treatments were effective at increasing the share of respondents aware of the experiment's hypothesis, thereby increasing the theoretical risk of EDEs. Respondents in the Qualtrics samples appear less attentive. Bars represent 95% confidence intervals.

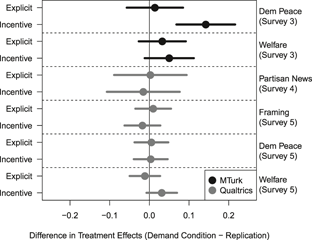
Figure 4 displays the main results of our incentive-based EDE interventions. Once again there is no evidence of demand effects when respondents are explicitly informed of the hypothesis. However, when a bonus payment is offered to the M-Turk samples, the treatment effects increase in the expected direction. In the democratic peace experiment, the effect of describing the hypothetical nation as a democracy increases by 14 percentage points relative to the control condition that did not supply information on the hypothesis. Similarly, in the welfare study the financial incentives induce a borderline statistically significant five-percentage-point increase in the treatment effect compared to the effect in the control condition that received no information about experimenter intent.Footnote 7
Financial Incentives Can Sometimes Induce EDEs
Note: The figure displays the differences in treatment effects (difference-in-differences) between conditions where respondents were given either information on a researcher's hypothesis, a financial incentive for inducing an EDE—or both—and the control condition in which no additional information was given. Bars represent 95% confidence intervals.

However, even with financial incentives, we find no evidence of EDEs in the Qualtrics samples. Since the two survey platforms engage participants that vary on many unobserved dimensions, it is difficult to pinpoint the reasons for these divergent results. However, the manipulation checks in the Qualtrics studies, displayed in Figure 3, suggest that respondents in this more representative pool are less attentive than M-Turkers. This pattern is in line with the intuition in Berinsky, Huber, and Lenz (Reference Berinsky, Huber and Lenz2012), which warns that the risk of EDEs may be especially pronounced among the experienced survey takers on the M-Turk labor market. The inattentiveness indicated by the small shares of respondents that could be prompted to correctly guess the experiment’s hypothesis even when additional financial incentives are offered again highlights an obstacle to EDEs, and also suggests treatment effects recovered in survey experiments are more akin to intention-to-treat effects (ITTs) than average treatment effects (ATEs), since many respondents assigned to treatment remained, in effect, untreated.
While these additional incentive conditions demonstrate modest evidence that M-Turkers are capable of inducing EDEs in the unusual case where they are offered extra money for doing so, they also show no evidence of EDEs among M-Turkers in the typical scenario where no such incentive is offered. In typical survey experimental settings, we again fail to recover evidence of the presence of EDEs.
ARE EDES PRESENT AT BASELINE?
The previous results demonstrate what happens to treatment effects in survey experiments when conditions that are theoretically conducive to EDEs are exacerbated. Contrary to common characterizations of demand effects, we find that providing survey respondents information on the purpose of an experiment generally has no impact on the estimated treatment effects. Even the presence of additional monetary incentives has an inconsistent effect on these results. Still, this evidence cannot rule out EDEs completely. The reason is that some respondents may have inferred the purpose of the experiment even without the additional information. If they then reacted differently due to this knowledge, it is possible that, even in the control condition where no extra information is provided, treatment effect estimates are inflated by the presence of “clever” respondents acting in line with researcher expectations. The directional manipulations included in Study 2 help in this regard as they move respondent’s perceived expectations away from the most prevalent expectations offered by prior studies in those research areas. This section includes an additional test.
To evaluate this possibility, we leverage respondents’ participation in multiple experiments in surveys 1–3 and 5 (see Table 1). In these surveys, we identify the respondents most likely to have inferred the experiments’ hypotheses on their own: those who correctly guessed the hypothesis of the first experiment they encountered. Conversely, we label respondents as not likely to infer hypotheses on their own if they were unable to correctly guess the hypothesis of the first experiment they encountered.Footnote 8 We then compare the treatment effects estimated for these two groups of respondents in the second experiment they encountered in the survey. If “clever” respondents inflate treatment effects due to demand-like behavior, we should observe larger effects among them compared to respondents who are less likely to infer an experiment’s purpose.Footnote 9
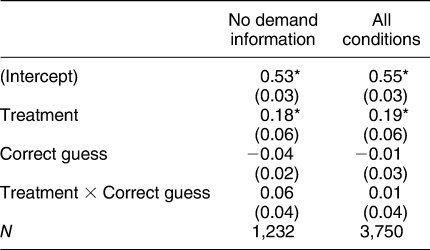
Table 4 displays the results of models comparing treatment effects among those who did and did not correctly guess the first experiment’s purpose pooled across all surveys in which multiple experiments were included. The first column is generated using only the sample of respondents who did not receive information about the hypothesis of the first experiment they encountered (those in the baseline, “no information” condition). The second column is generated from data on all respondents who correctly guessed the hypothesis in their first experiment, whether they received additional information or not.Footnote 10 In both sets of results, we find no evidence that “clever” respondents exhibit differentially large treatment effects. While the interaction terms in these models—which represent the difference in treatment effects between “clever” respondents and their counterparts—are positive, neither is statistically distinguishable from zero. We reach the same conclusions when breaking out the experiments one by one rather than pooling all the data, but in those cases we suspect our tests are severely underpowered.
Pooled Estimates of Treatment Effect Variation by Correct Guess of Hypothesis in Previous Experiment
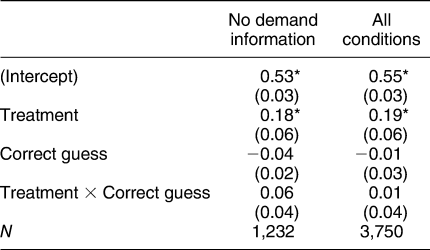
Models include study fixed effects, continuous outcomes rescaled between 0 and 1.
Robust standard errors, clustered by study, in parentheses
* Indicates significance at p < 0.05.
Some might wonder whether the positive point estimate on the interaction term in Table 4, Column 1 indicates the presence of EDEs, the large standard error notwithstanding. Suppose we take this estimate of 0.06 (six-percentage-points) to be true, and make the further conservative assumption that this entire effect is due to EDEs, and not due to other sources of differential response between correct and incorrect guessers. Given that correct guessers make up roughly 38% of the sample used to estimate Column 1 in Table 4, this means that we would expect EDEs to inflate an estimated average treatment effect by roughly two- to three-percentage-points, from about 0.18 to 0.21.
How often would this degree of bias alter the inference in a typical political science survey experiment? To gauge this, we reproduced an analysis from Mullinix et al. (Reference Mullinix, Leeper, Druckman and Freese2015), which replicated 20 survey experimental designs that received funding through Time Sharing Experiments for the Social Sciences (TESS) on both convenience samples from Amazon’s Mechanical Turk and nationally representative samples from Knowledge Networks. These experiments, “address diverse phenomena such as perceptions of mortgage foreclosures, how policy venue impacts public opinion, and how the presentation of school accountability data impacts public satisfaction…” (Mullinix et al. Reference Mullinix, Leeper, Druckman and Freese2015, 118). We transformed all 40 treatment effects which appeared in Figure 2 in Mullinix et al. (Reference Mullinix, Leeper, Druckman and Freese2015) into absolute value percentage-point shifts on each study’s outcome scale. We then diluted each treatment effect toward zero by three percentage points to mimic the largest EDE our paper suggests is likely to be realized (see Appendix Figure B.8 for results). Doing so changed the sign of four out of 40 effects, though all of those results were not statistically significant to begin with, so there would be no change in inference. Two additional effects lost statistical significance using two-standard-error confidence intervals, and the vast bulk of substantive conclusions remained unchanged. Taken together, Table 4, Column 1, under the most conservative assumptions, suggests some risk of EDEs among a subset of respondents, but the effects are not large enough to refute our general claim that EDEs are unlikely to meaningfully bias a survey experimental result except in studies attempting to detect very small treatment effects.
DISCUSSION AND CONCLUSION
Survey experiments have become a main staple of behavioral research across the social sciences, a trend aided by the increased availability of inexpensive online participant pools. With the expansion of this type of study, scholars have rightly identified a set of concerns related to the validity of survey experimental results. One common concern is that survey respondents—especially ones who frequently take part in social science experiments—have both the means and the incentives to provide responses that artificially confirm a researcher’s hypothesis and deviate from their sincere response to an experimental setting. In this study, we provide some of the first empirical evidence regarding the existence and severity of this theoretical vulnerability.
Our results consistently defy the expectations set out by the EDE critique. Rather than assisting researchers in confirming their hypotheses, we find that revealing the purpose of experiments to survey respondents leads to highly similar treatment effects relative to those generated when the purpose of the experiment is not provided. We also provide evidence as to the mechanism that produces these null results. By offering additional financial incentives to survey participants for responding in a way that confirms the stated hypotheses, we show that, with rare exceptions, respondents appear largely unable to engage in demand-like behavior. This suggests that in typical research settings, where such incentives are unavailable, respondents are unlikely to aid researchers in confirming their hypotheses.
These results have important implications for the design and interpretation of survey experiments. While there may be other reasons to obfuscate a study’s purpose or misdirect respondents, such as fostering engagementFootnote 11 or avoiding social desirability bias, our evidence suggests that the substantial effort and resources researchers expend obfuscating hypotheses to prevent demand-like behavior may be misguided. These tactics include ethically questionable attempts to deceive participants in order to preserve the scientific validity of results. Even in the event that a hypothesis is explicitly stated to the participant, there appears to be little risk it will inflate the observed treatment effects.
In light of our findings, there are several additional questions worthy of pursuit. There may be substantial variation in how respondents react to knowledge of an experiment’s hypothesis across substantive areas. Though we have attempted to test for the presence of EDEs across a range of topics by covering all empirical subfields in political science, it remains possible that certain topics may be especially vulnerable to EDEs. There may also be heterogeneity among respondents. Subject pools with varying levels of experience participating in survey experiments may respond differently to the stimuli examined here.
In spite of these limitations, our consistent inability to uncover evidence of hypothesis-confirming behavior across multiple samples, survey platforms, research questions and experimental designs suggests that long-standing concerns over demand effects in survey experiments may be largely exaggerated. In general, knowledge of a researcher’s expectations does not alter the behavior of survey participants.
SUPPLEMENTARY MATERIAL
To view supplementary material for this article, please visit https://doi.org/10.1017/S0003055418000837.
Replication materials can be found on Dataverse at: https://doi.org/10.7910/DVN/HUKSID.




Comments
No Comments have been published for this article.