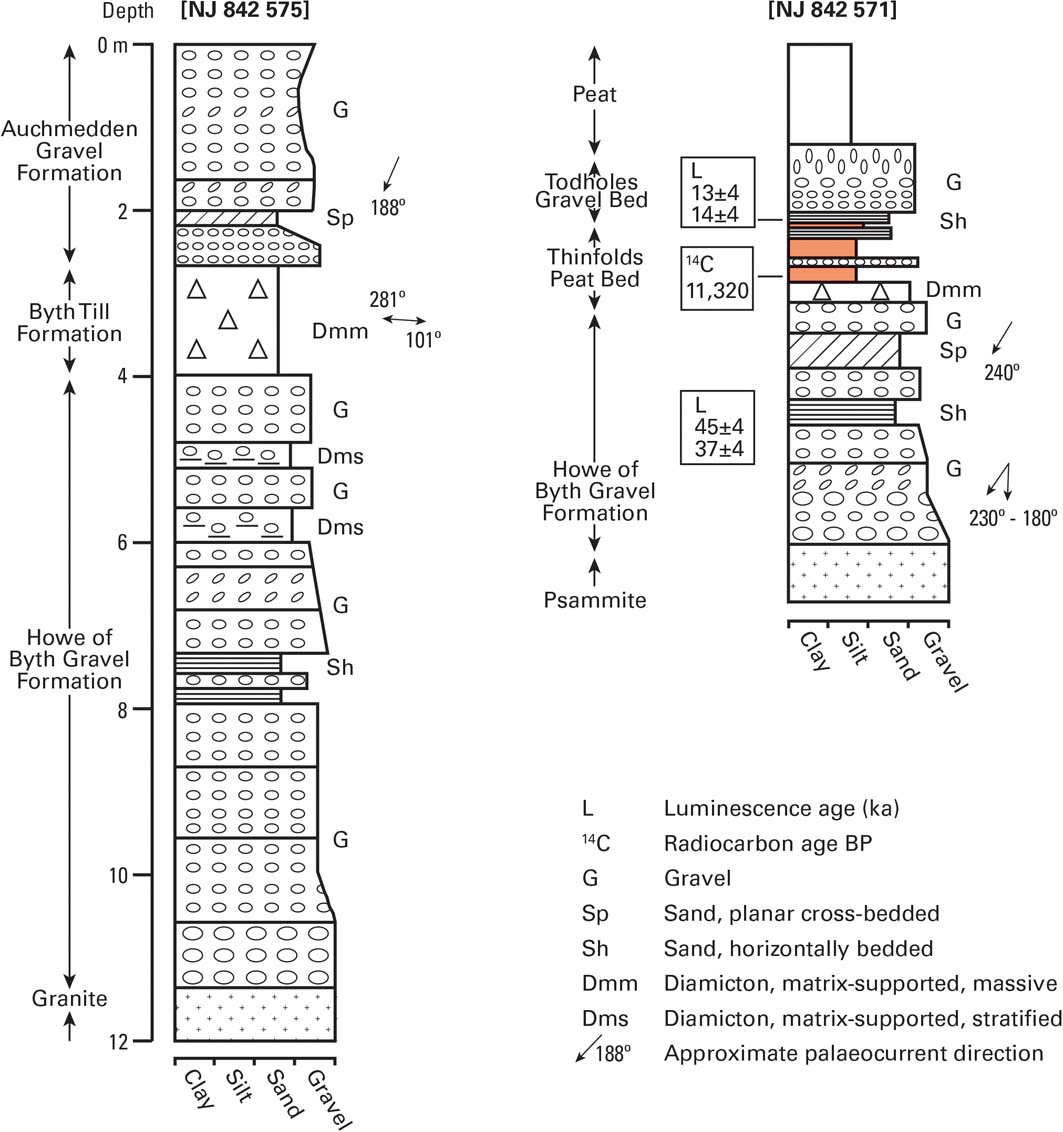
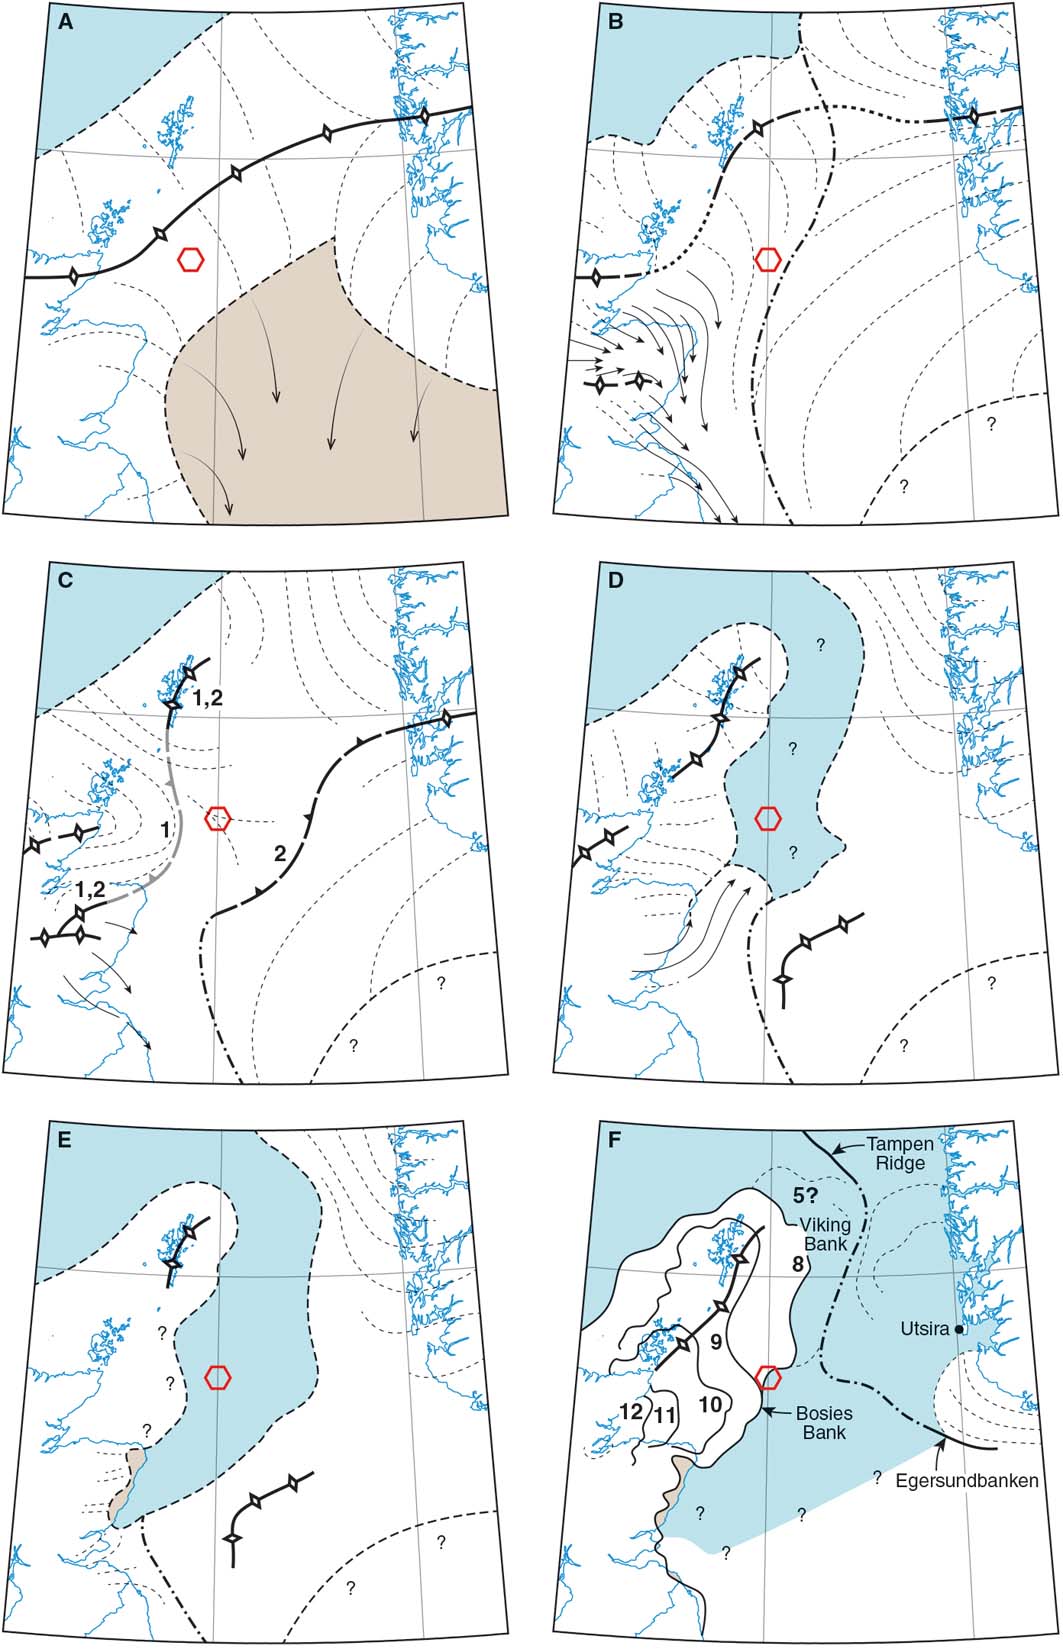
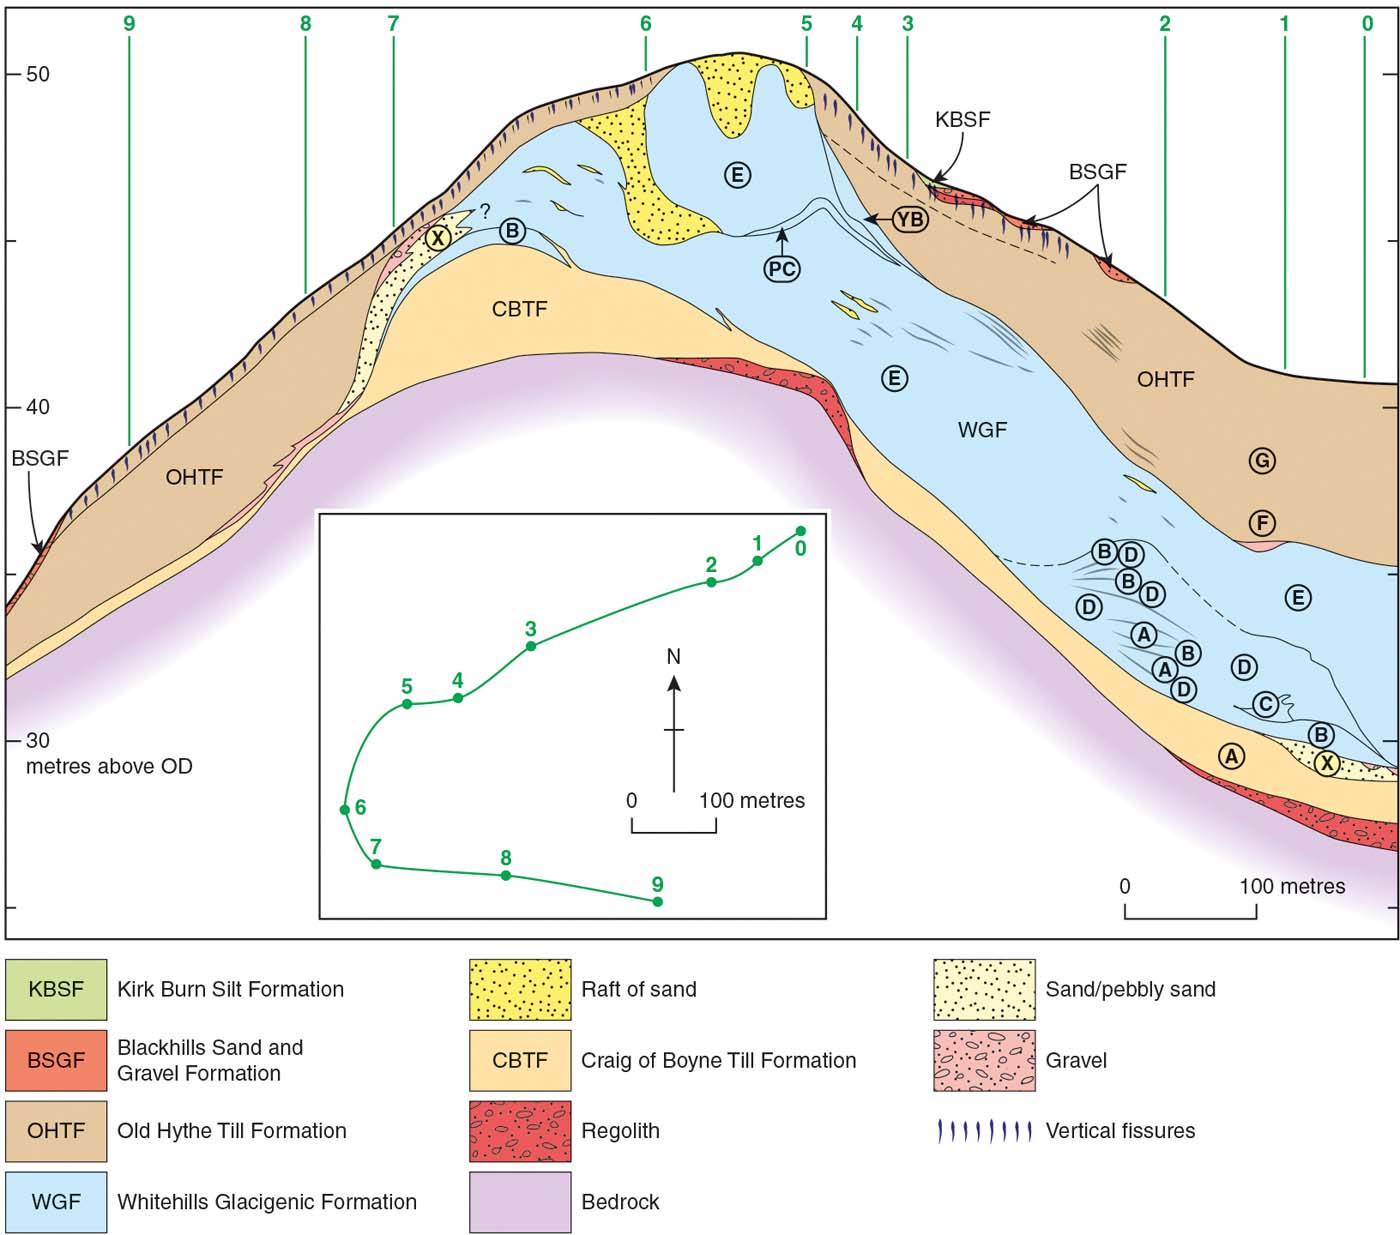
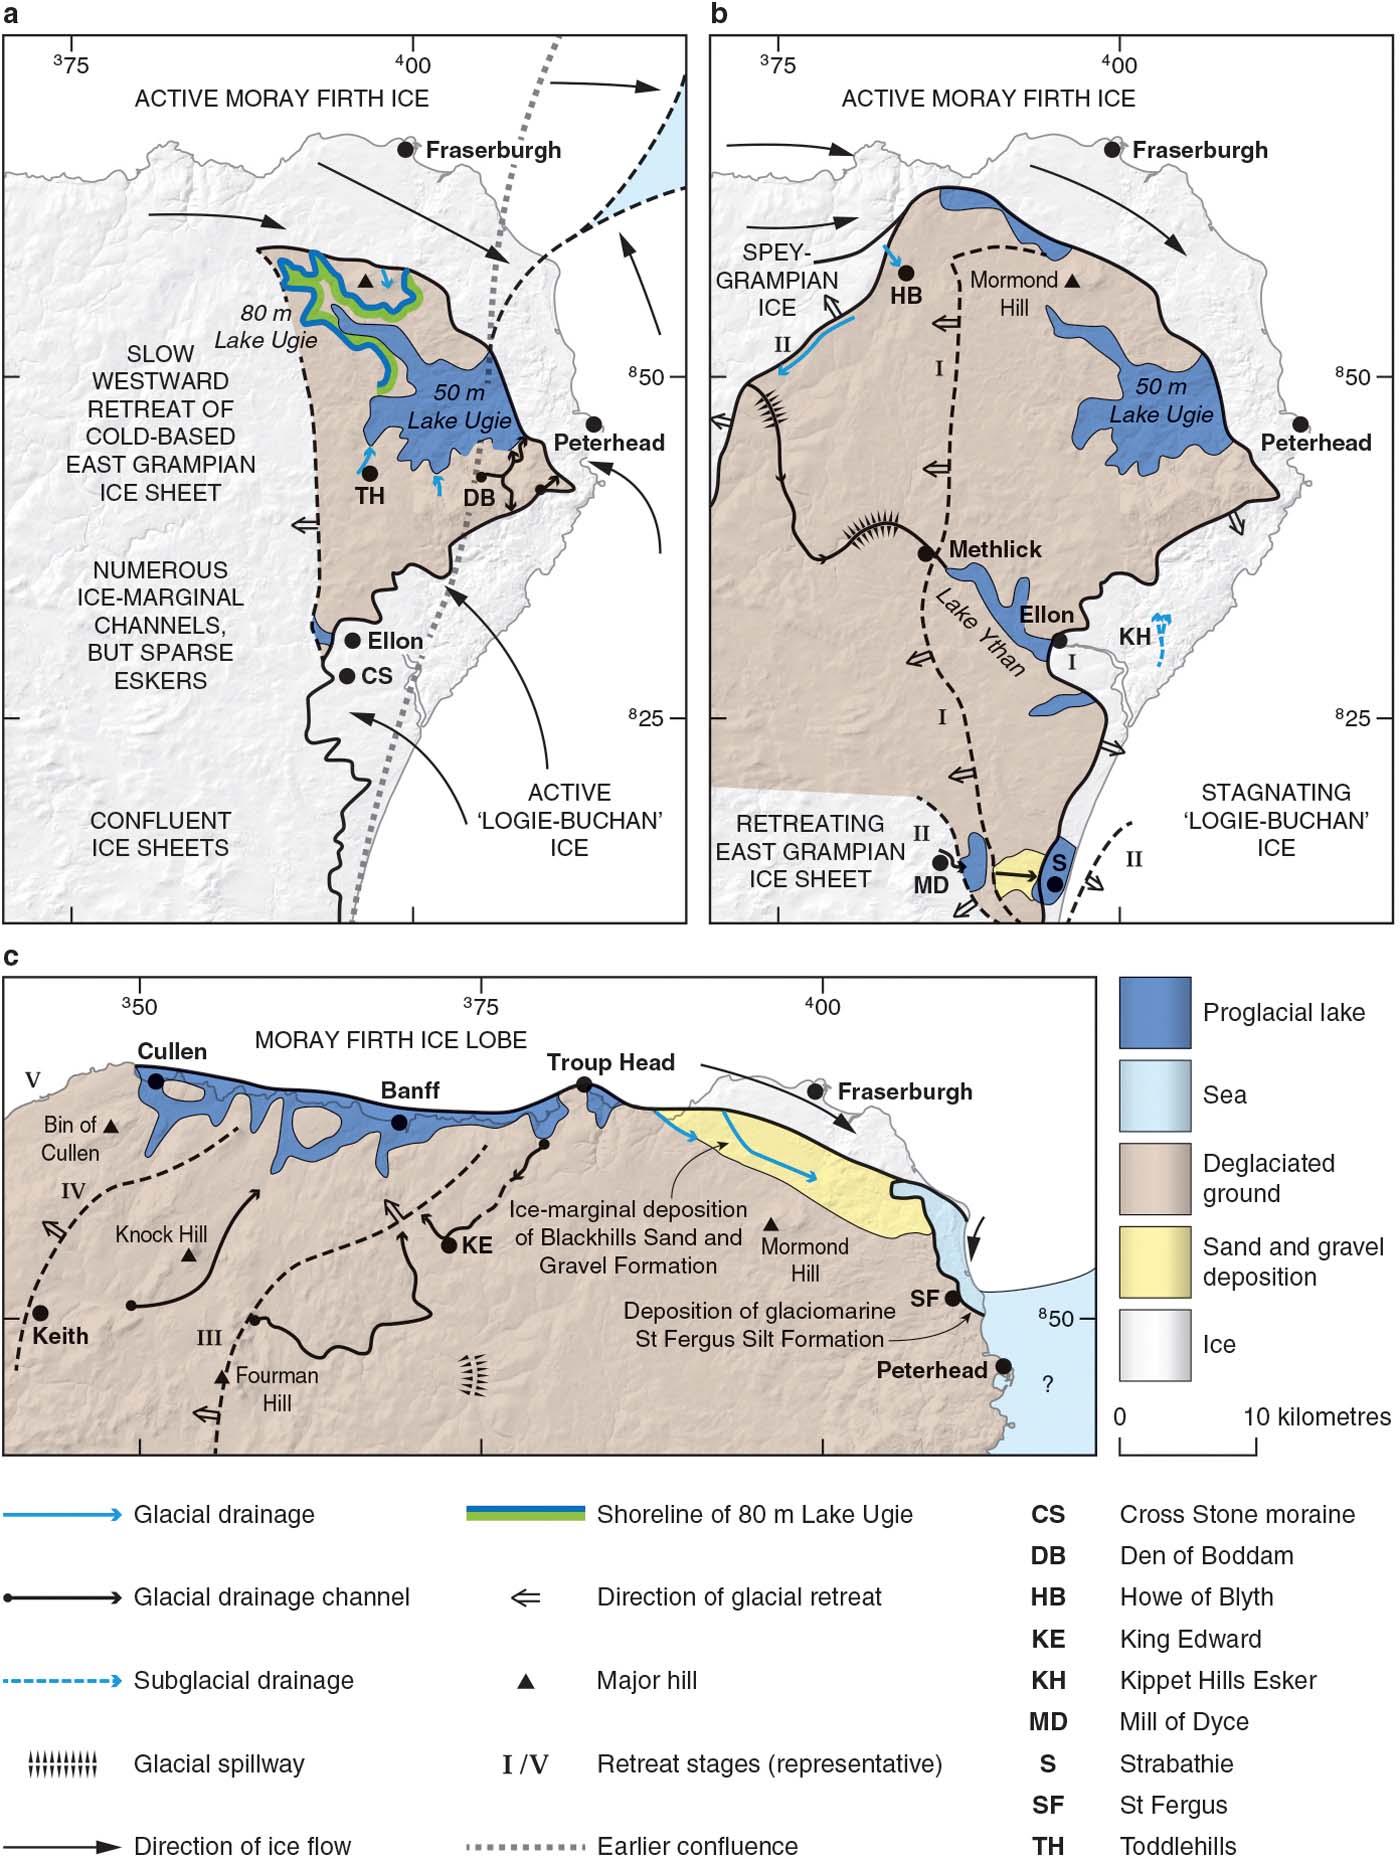
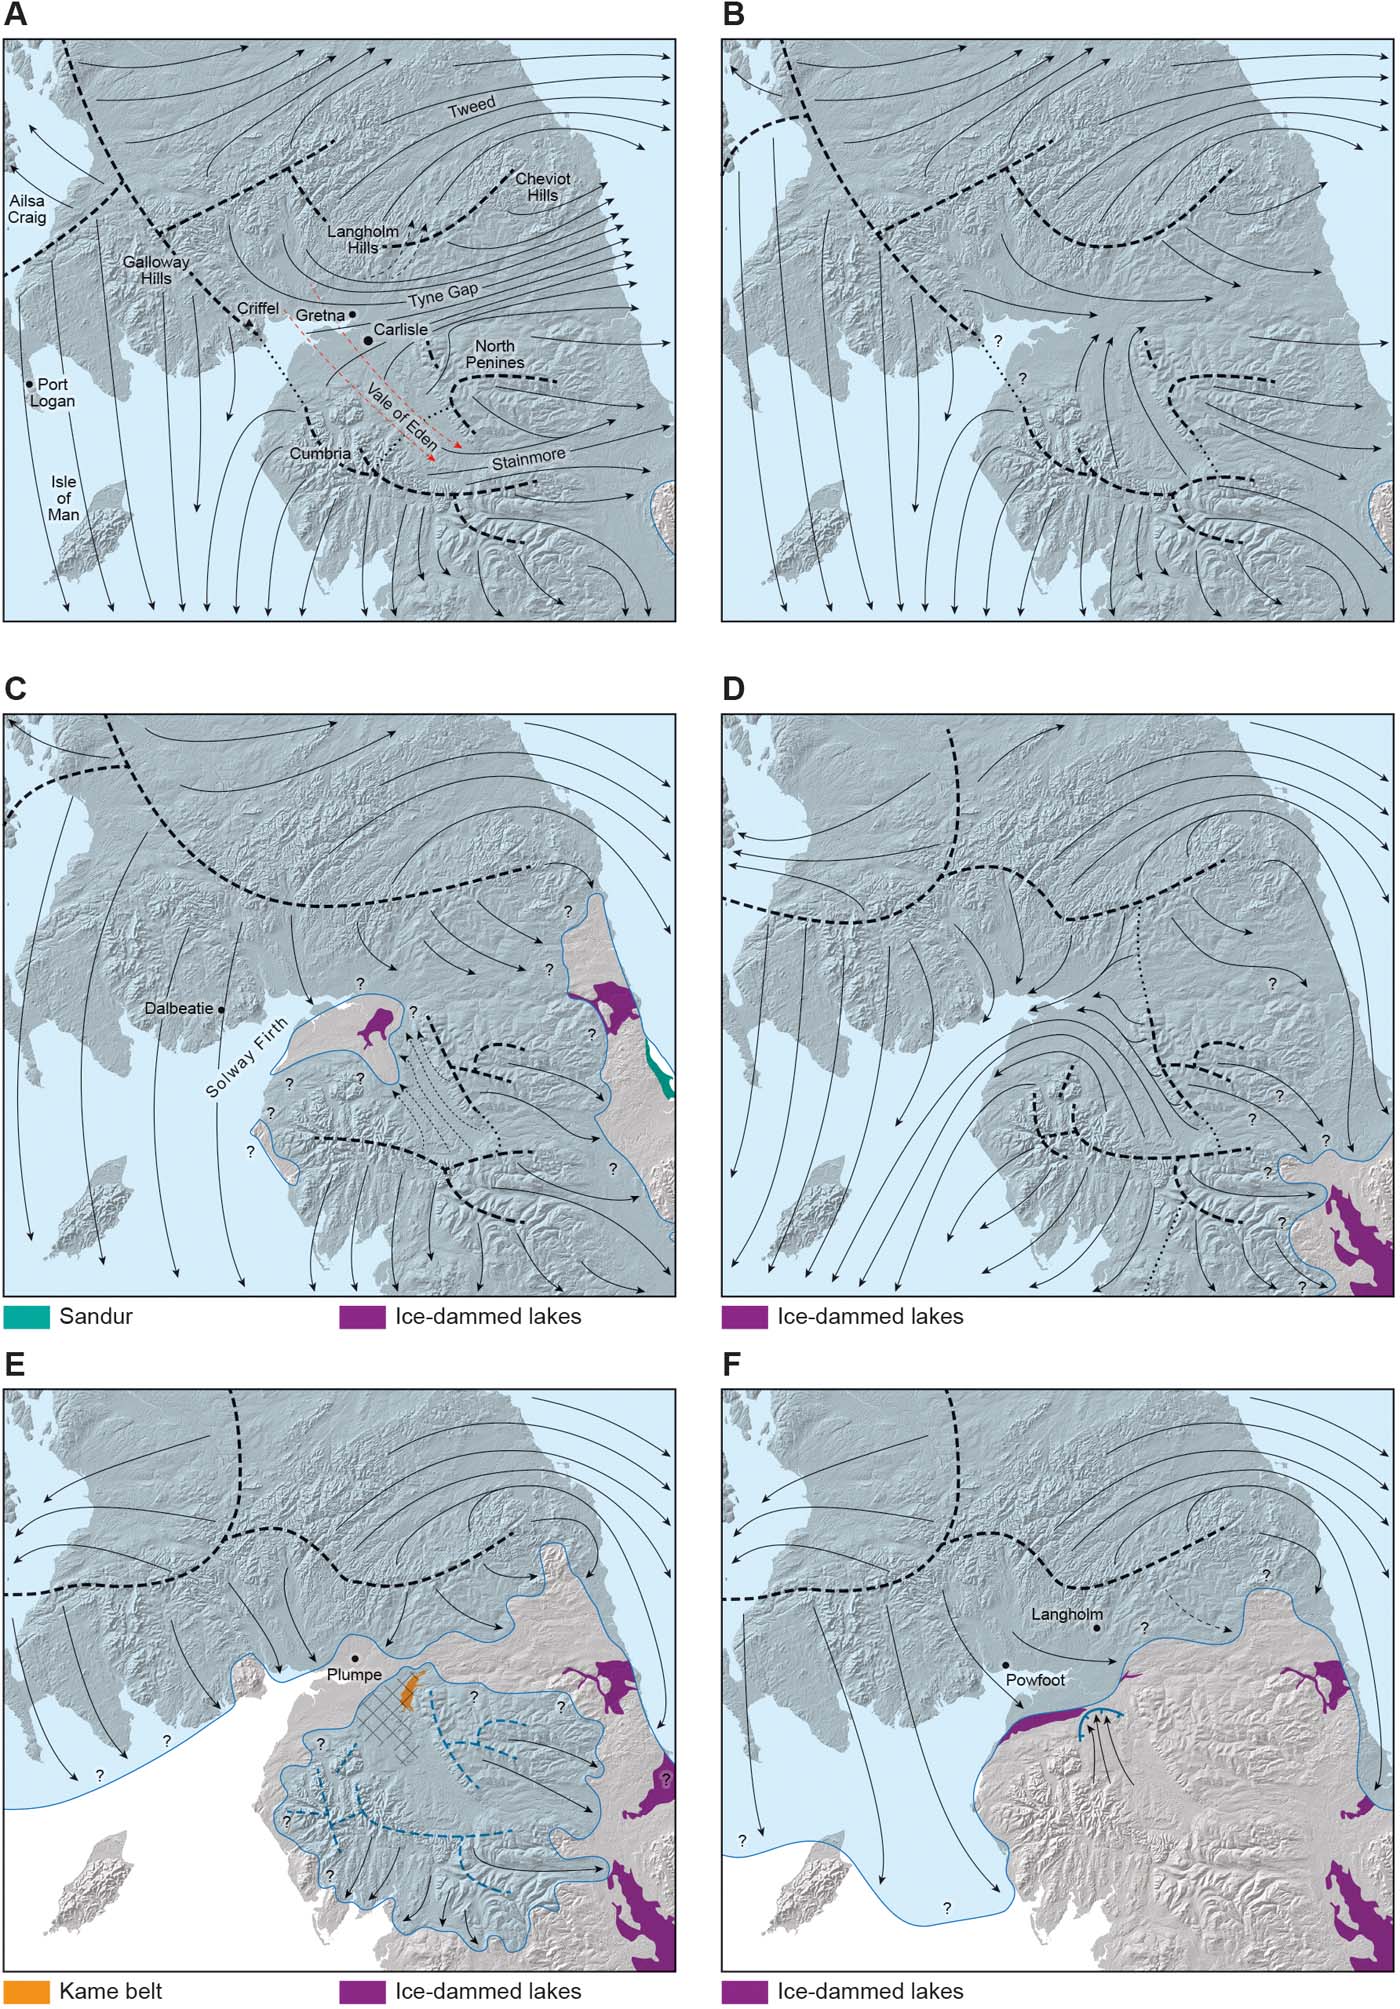
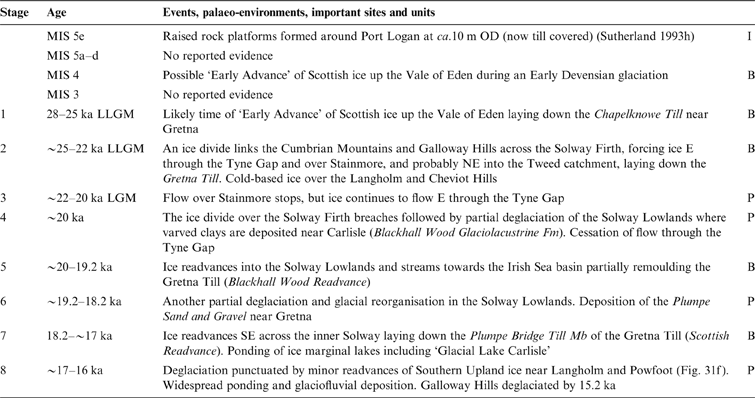
The Pleistocene covers the greater part of the Quaternary period, from 2.58Ma to 11.7ka (Gibbard & Lewin Reference Gibbard and Lewin2016). Its defining characteristic is a series of climatic cycles resulting in repeated glaciations that had a profound but variable effect in shaping the modern landscape of Scotland, adding cumulatively to the effects of longer-term landscape evolution (Hall et al. Reference Hall, Merritt, Connell and Hubbard2018). During the glacial stages, mountain glaciers developed in the uplands and ice sheets extended periodically out across the continental shelf and into the North Sea basin (Stewart et al. Reference Stewart, Carter, Dove, Stewart, Green, Cooper, Cotterill and Gafeira2019, and references therein). During the intervening interglacial stages, temperate climatic conditions prevailed, leading to more equable environments. The record of these climatic and environmental changes is documented in the terrestrial sedimentary record, typically by a variety of glacial and periglacial deposits, organic deposits and palaeosols. However, because much of Scotland lay close to ice accumulation centres, successive glaciations have generally removed traces of earlier events. Hence, there is dominance of the last glacial cycle and, especially, its final deglaciation, in the terrestrial stratigraphic record. Exceptionally, in some areas, the former presence of cold-based ice appears to have allowed the local preservation of relatively long sedimentary sequences, as, for example, in NE Scotland (Hall et al. Reference Hall, Merritt, Connell and Hubbard2018). The preservation of earlier events is fragmentary, both in space and time. Nevertheless, the terrestrial evidence represents a significant and accessible record.
The glacial landform and sedimentary archives, including the BRITICE database of landforms and features related to the last British–Irish Ice Sheet (BIIS) (Clark et al. Reference Clark, Evans, Khatwa, Bradwell, Jordan, Marsh, Mitchell and Bateman2004, Reference Clark, Ely, Greenwood, Hughes, Meehan, Barr, Bateman, Bradwell, Doole, Evans, Jordan, Monteys, Pellicer and Sheehy2018; Evans et al. Reference Evans, Clark and Mitchell2005), provide good opportunities to elucidate the history of Quaternary glaciation in Britain, and particularly for understanding the dynamics of the last BIIS, its response to the changing climate and the links between ocean circulation and climate change. The BIIS was largely marine-based (Stewart et al. Reference Stewart, Carter, Dove, Stewart, Green, Cooper, Cotterill and Gafeira2019), and because of the extreme maritime location of the British Isles, it is considered to have been highly sensitive to climate changes (Hibbert et al. Reference Hibbert, Austin, Leng and Gatliffe2010; Thierens et al. Reference Thierens, Pirlet, Colin, Latruwe, Vanhaecke, Lee, Stuut, Titschack, Huvenne, Dorschel, Wheeler and Henriet2012).
The aim of this paper is to review the Late Pleistocene terrestrial stratigraphy of Scotland over the time period 130–14.7ka and spanning the last glacial–interglacial cycle (Lisiecki & Raymo Reference Lisiecki and Raymo2005). We first summarise recent advances in understanding the lithostratigraphic and chronostratigraphic framework for Scotland over the last 25 years since the publication of the Quaternary of Scotland Geological Conservation Review volume (Gordon & Sutherland Reference Gordon, Gordon and Sutherland1993a), then review the evidence from a number of critical regions. Finally, we consider outstanding questions, new directions and challenges. The focus of the paper on Late Pleistocene terrestrial stratigraphy complements the accompanying review of the terrestrial record of Early and Middle Pleistocene environments, landforms and sediments in Scotland (Hall et al. Reference Hall, Merritt, Connell and Hubbard2018), offshore stratigraphy (Stewart et al. Reference Stewart, Carter, Dove, Stewart, Green, Cooper, Cotterill and Gafeira2019) and the geomorphological evidence for the last Scottish Ice Sheet and its deglaciation (Ballantyne & Small Reference Ballantyne2018). Lateglacial landforms and landscape evolution, including evidence relating to the glaciation of Scotland during the Loch Lomond Stadial (Younger Dryas), are reviewed by Ballantyne (Reference Ballantyne2018), whereas evidence for sea level change is reviewed by Smith et al. (Reference Smith, Barlow, Bradley, Firth, Hall, Jordan and Long2018).
Radiocarbon ages are given as ‘14C ka BP' (thousands of years before present). Calibrated ages are quoted as ‘cal 14C ka BP'.
1. The Quaternary stratigraphic framework
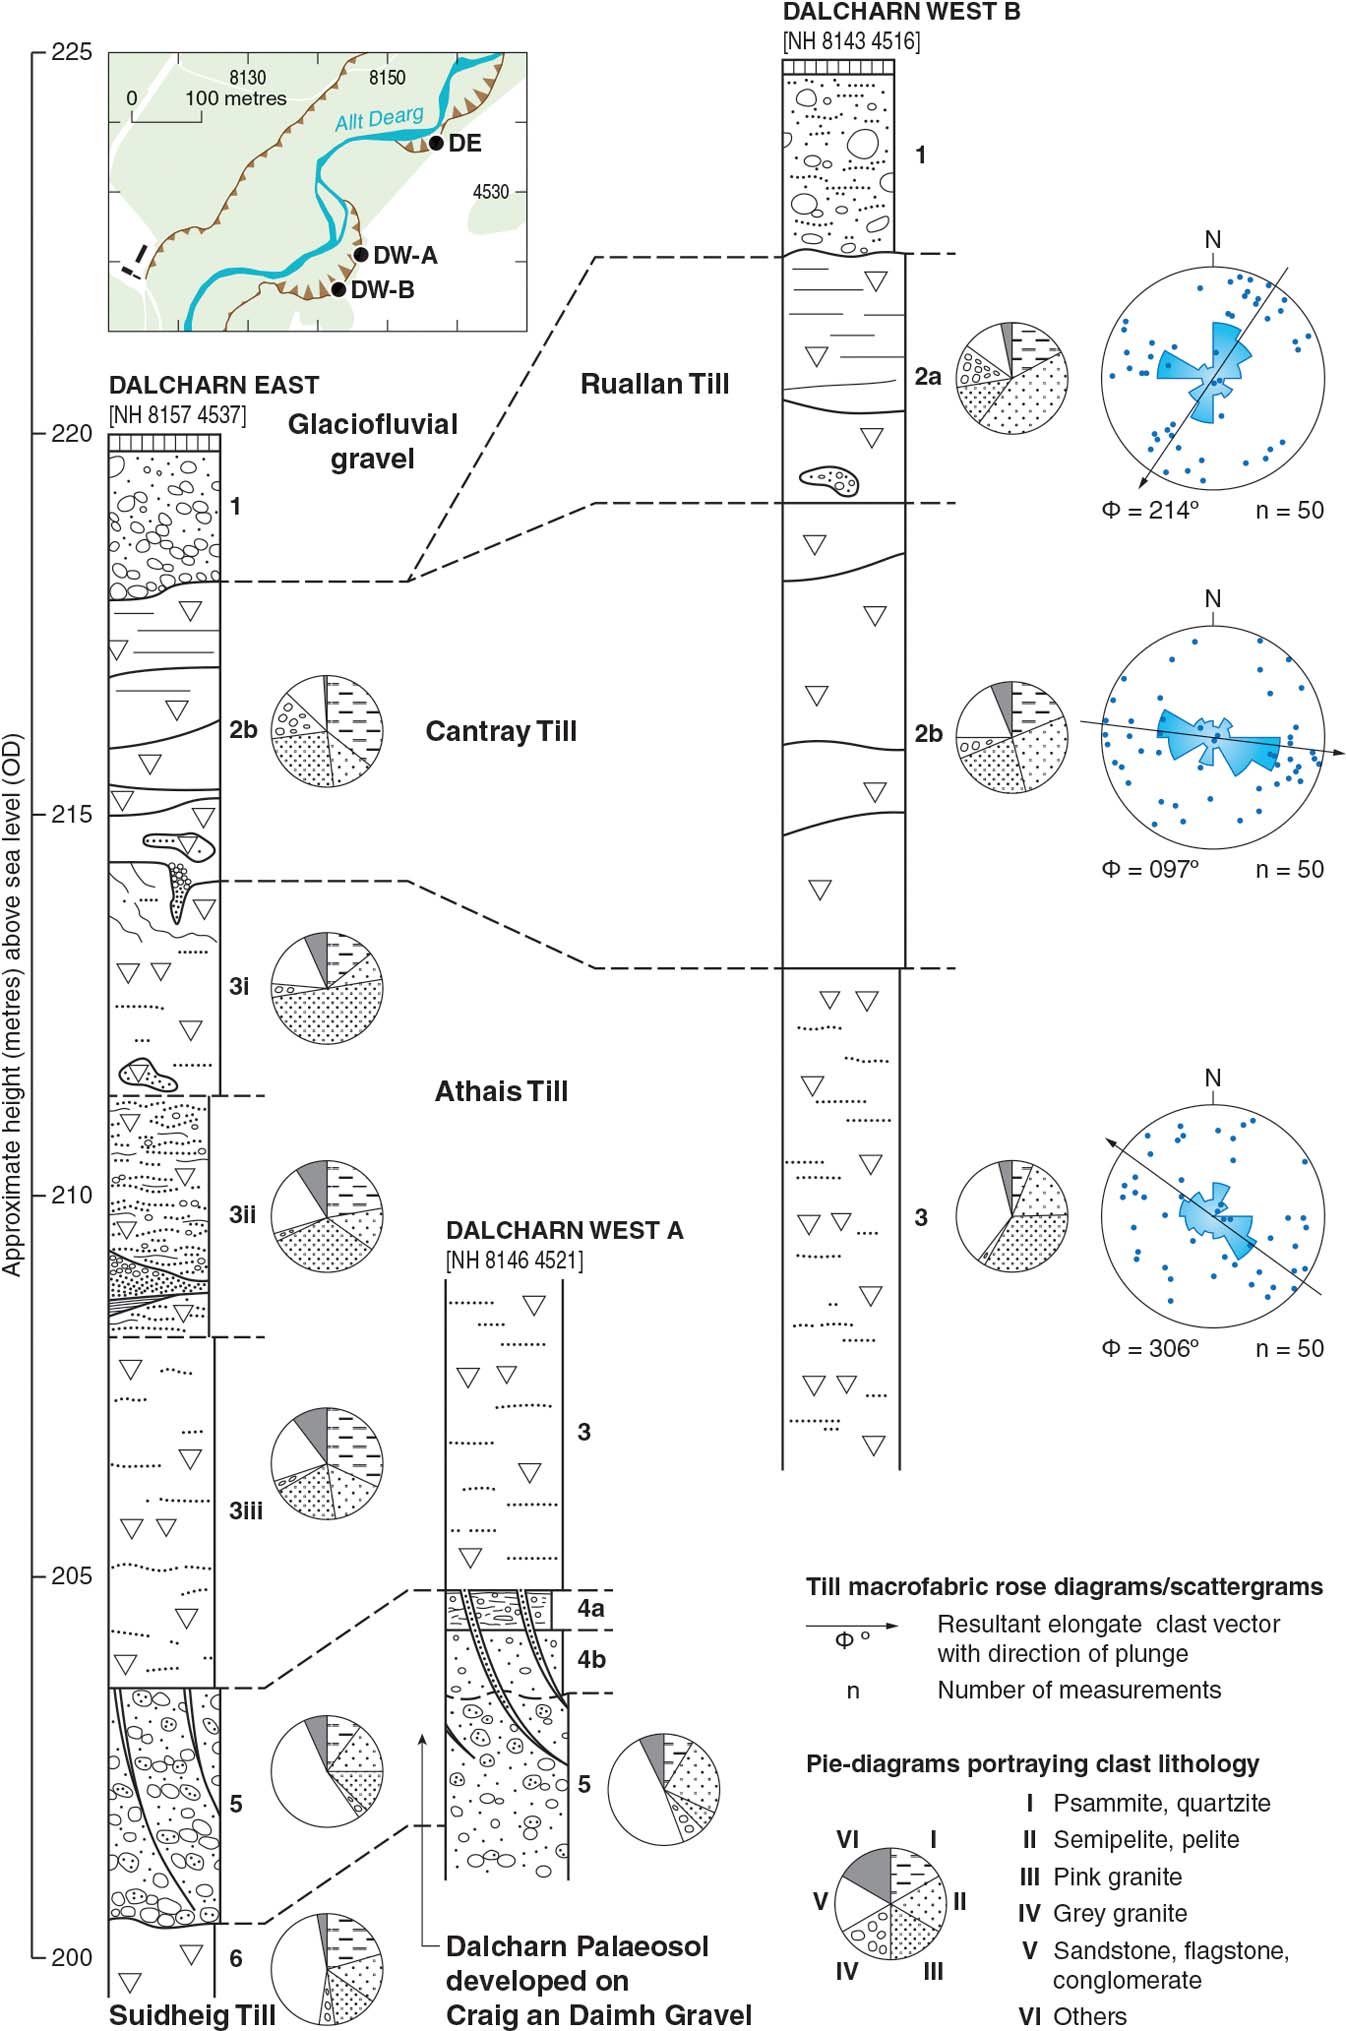
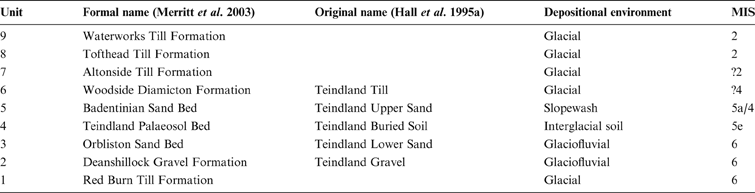
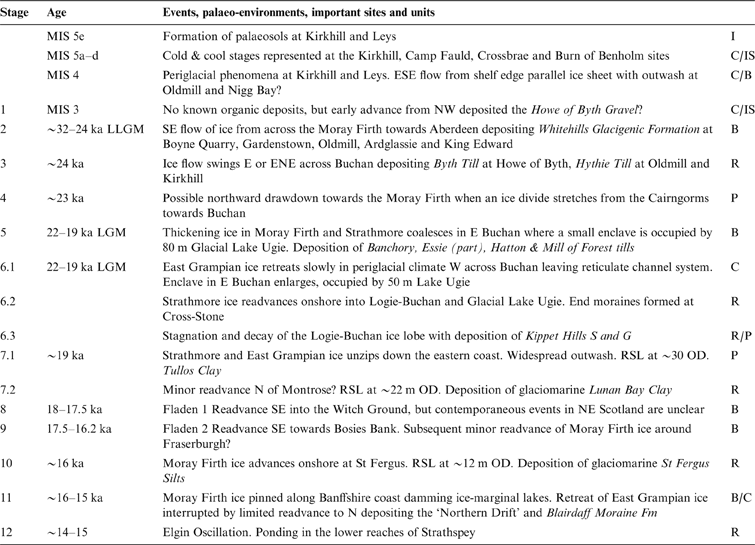
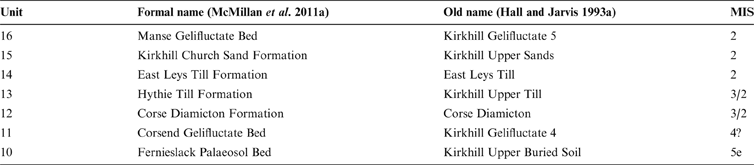
Onshore Quaternary deposits are classified and correlated principally using lithostratigraphy, chronostratigraphy and geochronometry. The first is based on the observable physical characteristics of the sediments and their relative stratigraphic positions; the second requires establishing the time relationships between different sedimentary units in relative terms and through numerical dating methods (geochronometry). Climatostratigraphy is also used where climatic changes are represented in the deposits. In some cases, deposits may also be classified according to their biostratigraphy, or microfossil content; while in others, geomorphological subdivision may be possible using morphostratigraphy, which incorporates the landform record. Periglacial and organic sediments are rarely preserved within the Pleistocene sequence, but are particularly important stratigraphical markers providing evidence of ice-free episodes. A key element in stratigraphical analysis is the designation of type sections and type localities establishing named stratigraphic units, which provide a common standard of reference for their identification (Bowen Reference Bowen1999; McMillan & Merritt Reference McMillan and Merritt2012). Details of all units referred to in the following are fully documented by McMillan et al. (Reference McMillan, Hamblin and Merritt2011a).
1.1. Climatostratigraphy and chronostratigraphy
Quaternary stratigraphy was revolutionised during the latter part of the 20th Century by the recovery of deep-sea cores, which provided continuous sedimentary records for the whole of the Quaternary. A series of Marine Isotope Stages (MIS), based on the oxygen isotope composition of the microfaunas contained in the cores (Bowen Reference Bowen1978; Lisiecki & Raymo Reference Lisiecki and Raymo2005; Thierens et al. Reference Thierens, Pirlet, Colin, Latruwe, Vanhaecke, Lee, Stuut, Titschack, Huvenne, Dorschel, Wheeler and Henriet2012; Railsback et al. Reference Railsback, Gibbard, Head, Voarintsoa and Toucanne2015), now provides a reference climatostratigraphic framework for the correlation of Pleistocene terrestrial sediments and events in Scotland (Hall et al. Reference Hall, Merritt, Connell and Hubbard2018, fig. 1). In the conventional British chronostratigraphic scheme, the Late Pleistocene spans the Ipswichian (∼130–116ka) and Devensian (∼116–11.7ka) stages (Fig. 1), corresponding to MIS 5e and MIS 5d-2, respectively (Lisiecki & Raymo Reference Lisiecki and Raymo2005). The Devensian is subdivided into Early Devensian (∼109–57ka) (MIS 5d-4), Middle Devensian (∼57–31ka) (∼MIS 3) and Late Devensian (∼31–11.7ka) (∼MIS 2). The Late Devensian includes the Dimlington Stadial (∼31–14.7ka) (Rose Reference Rose, Rose and Schlüchter1989), the Lateglacial or Windermere Interstadial (14.7–12.9ka) and the Loch Lomond Stadial (12.9–11.7ka). The Lateglacial period, or Last Glacial Transition, is generally acknowledged to have occurred between ca.21ka and 11.7ka (Lowe & Walker Reference Lowe and Walker2015).
Summary of Late Quaternary chronostratigraphic stages (Great Britain) and their correlation with MIS (after Lisiecki & Raymo Reference Lisiecki and Raymo2005; Bradwell et al. Reference Bradwell, Stoker, Golledge, Wilson, Merritt, Long, Everest, Hestvik, Stevenson, Hubbard, Finlayson and Mathers2008a; Otvos Reference Otvos2015). The approximate timings of the LLGM (ca.30–27ka) (Ballantyne & Small Reference Ballantyne2018) and global LGM (23–21ka) (Hughes et al. Reference Hughes, Clark and Jordan2016) are shown. Note that some terrestrial stage boundaries are not coincident with MIS boundaries. Abbreviations: DS = Dimlington Stadial; WI = Windermere Interstadial; LLS = Loch Lomond Stadial.
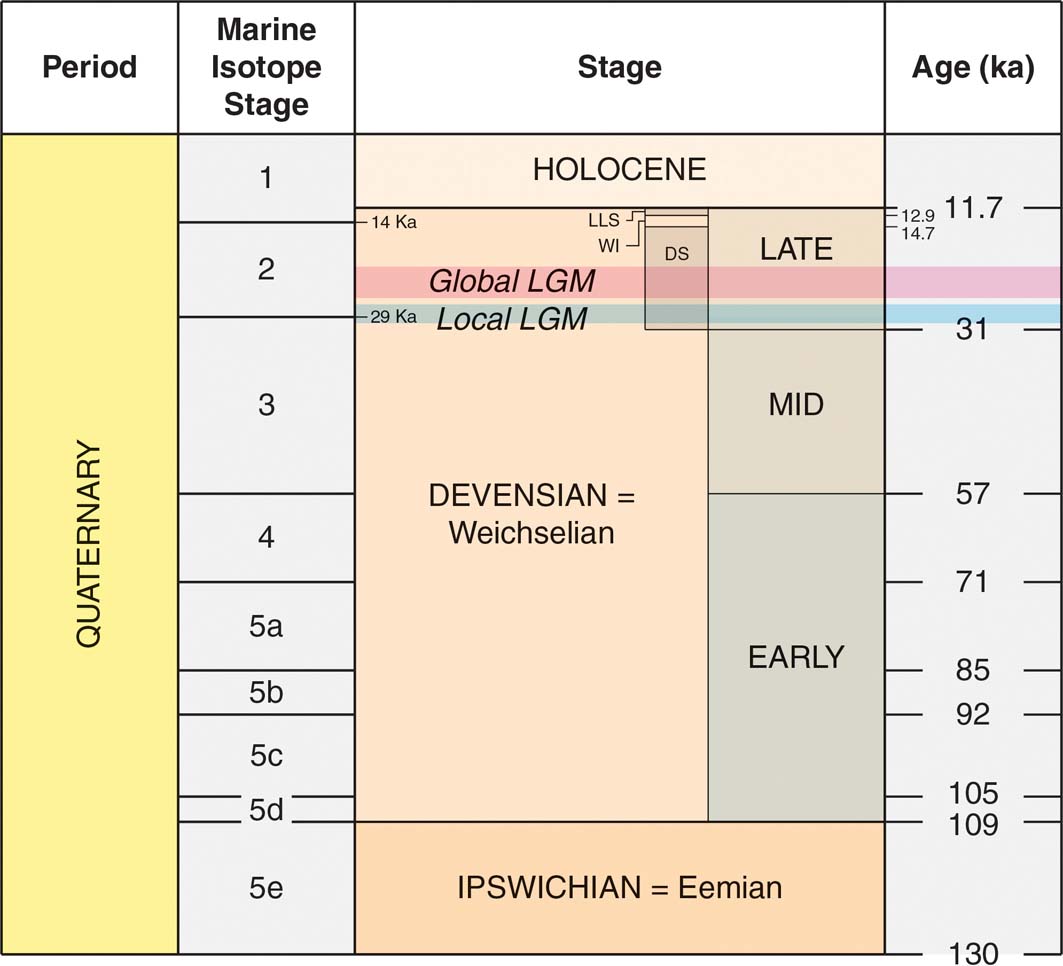
There are different interpretations of the timing of the Last Glacial Maximum (LGM) globally, regionally and locally, according to different indicators – the timing of global sea level minimum, the oxygen isotope signal in marine records and terrestrial records (Clark et al. Reference Clark, Dyke, Shakun, Carlson, Clark, Wohlfarth, Mitrovica, Hostetler and McCabe2009; Hughes et al. Reference Hughes, Clark and Jordan2013; Lambeck et al. Reference Lambeck, Rouby, Purcell, Sun and Sambridge2014; Hughes & Gibbard Reference Hughes and Gibbard2015). Different sectors of the last BIIS apparently reached their maximum extent asynchronously (Ballantyne & Small Reference Ballantyne2018). The estimate of ∼30–27ka for ice reaching the Atlantic Shelf (Ballantyne & Small Reference Ballantyne2018) is earlier than the timing of some estimates of 26–21ka (Clark et al. Reference Clark, Dyke, Shakun, Carlson, Clark, Wohlfarth, Mitrovica, Hostetler and McCabe2009), but is in line with the time-slice reconstruction of 27–26ka for this sector from Hughes et al. (Reference Hughes, Gyllencreutz, Lohne, Mangerud and Svendsen2016) (see also Section 3.2). In line with Ballantyne & Small (Reference Ballantyne2018), we use the abbreviation ‘LGM' to denote the last global glacial maximum of 26.5–19ka (Clark et al. Reference Clark, Dyke, Shakun, Carlson, Clark, Wohlfarth, Mitrovica, Hostetler and McCabe2009) and ‘LLGM' (Local Last Glacial Maximum) to refer to the maximum extent of different sectors of the last BIIS (Fig. 1), some of which apparently reached their outermost limits millennia before others.
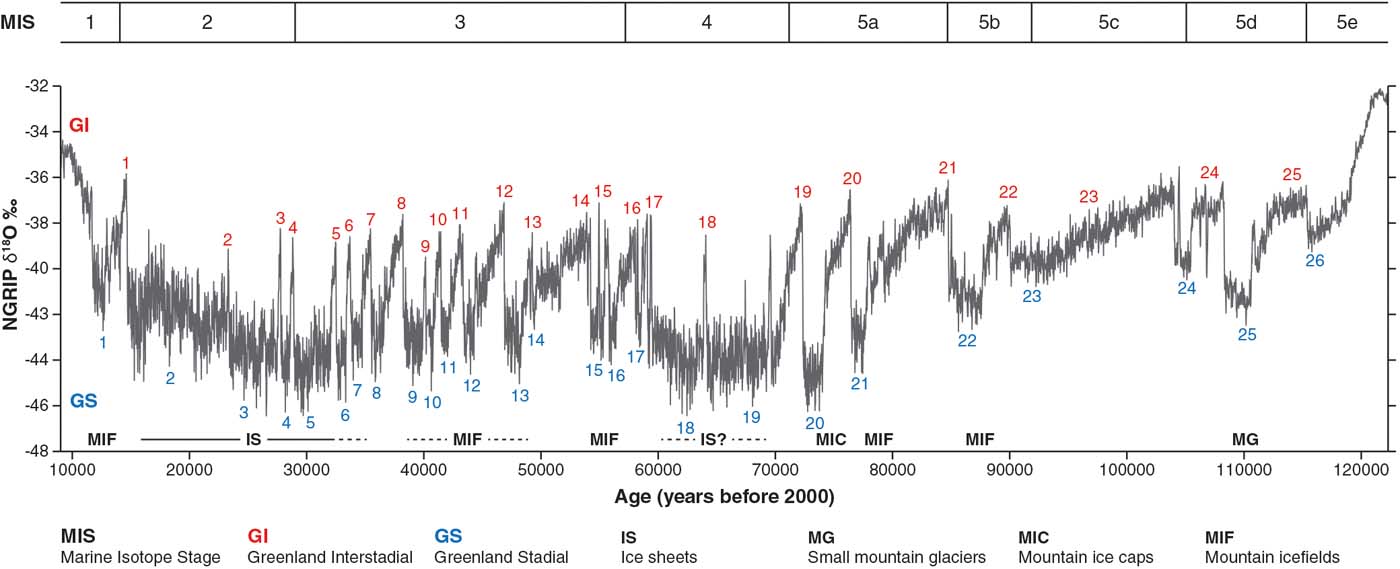
In a second major development, analyses of the stable-oxygen isotope signals in cores drilled through the Greenland Ice Sheet have enabled the interpretation of continuous records of climate change, defining a series of stadials and interstadials extending back to the last (Ipswichian) interglacial (Lowe & Walker Reference Lowe and Walker2015). Because of the high stratigraphic and temporal resolution, these records form the basis for an event stratigraphy and a framework for the whole of the last glacial–interglacial cycle for the North Atlantic region (Fig. 2) (Rasmussen et al. Reference Rasmussen, Bigler, Blockley, Blunier, Buchardt, Clausen, Cvijanovic, Dahl-Jensen, Johnsen, Fischer, Gkinis, Guillevic, Hoek, Lowe, Pedro, Popp, Seierstad, Steffensen, Svensson, Vallelonga, Vinther, Walker, Wheatley and Winstrup2014; see Section 2).
Greenland oxygen isotope record from the North Greenland Ice Core Project (NGRIP) ice core (NGRIP Members 2004) and the main event stratigraphy (Rasmussen et al. Reference Rasmussen, Bigler, Blockley, Blunier, Buchardt, Clausen, Cvijanovic, Dahl-Jensen, Johnsen, Fischer, Gkinis, Guillevic, Hoek, Lowe, Pedro, Popp, Seierstad, Steffensen, Svensson, Vallelonga, Vinther, Walker, Wheatley and Winstrup2014). The age scale is based on the GIC05 age model as plotted by Abbott et al. (Reference Abbott, Davies, Steffensen, Pearce, Bigler, Johnsen, Seierstad, Svensson and Wastegård2012). (Reprinted from Quaternary Science Reviews, 36, 59–77, P. M. Abbott et al. ‘A detailed framework of marine Isotope Stages 4 and 5 volcanic events recorded in two Greenland ice-cores', Copyright (2012), with permission from Elsevier.) MIS boundaries are based on Lisiecki & Raymo (Reference Lisiecki and Raymo2005), Railsback et al. (Reference Railsback, Gibbard, Head, Voarintsoa and Toucanne2015) and Otvos (Reference Otvos2015). The indicative presence of glaciers in Scotland is adapted from Clapperton (Reference Clapperton and Gordon1997). Abbreviations: MIS: Marine Isotope Stage; GI = Greenland Interstadials; GS = Greenland Stadials; MIF = mountain icefields; IS = ice sheets; MIC = mountain ice caps; MG = small mountain glaciers.

The development and application of new dating techniques applied to terrestrial materials has also significantly improved the temporal resolution of onshore Quaternary stratigraphy and the identification of events (Lowe & Walker Reference Lowe and Walker2015). In particular, surface exposure dating using terrestrial cosmogenic nuclides (cosmogenic dating) has greatly enhanced the understanding and timing of the pattern of growth and decay of the last ice sheet (e.g., Ballantyne Reference Ballantyne2010; Ballantyne & Small Reference Ballantyne and Small2018). Nevertheless, it is clear that only a fragmentary record of the Quaternary is preserved in terrestrial deposits.
1.2. Lithostratigraphy
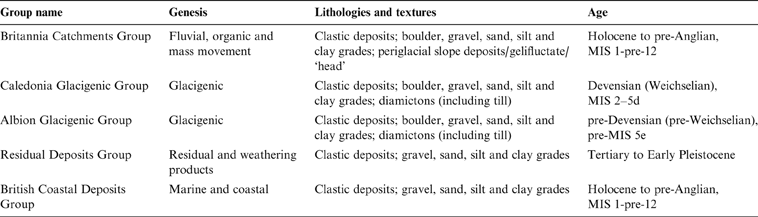
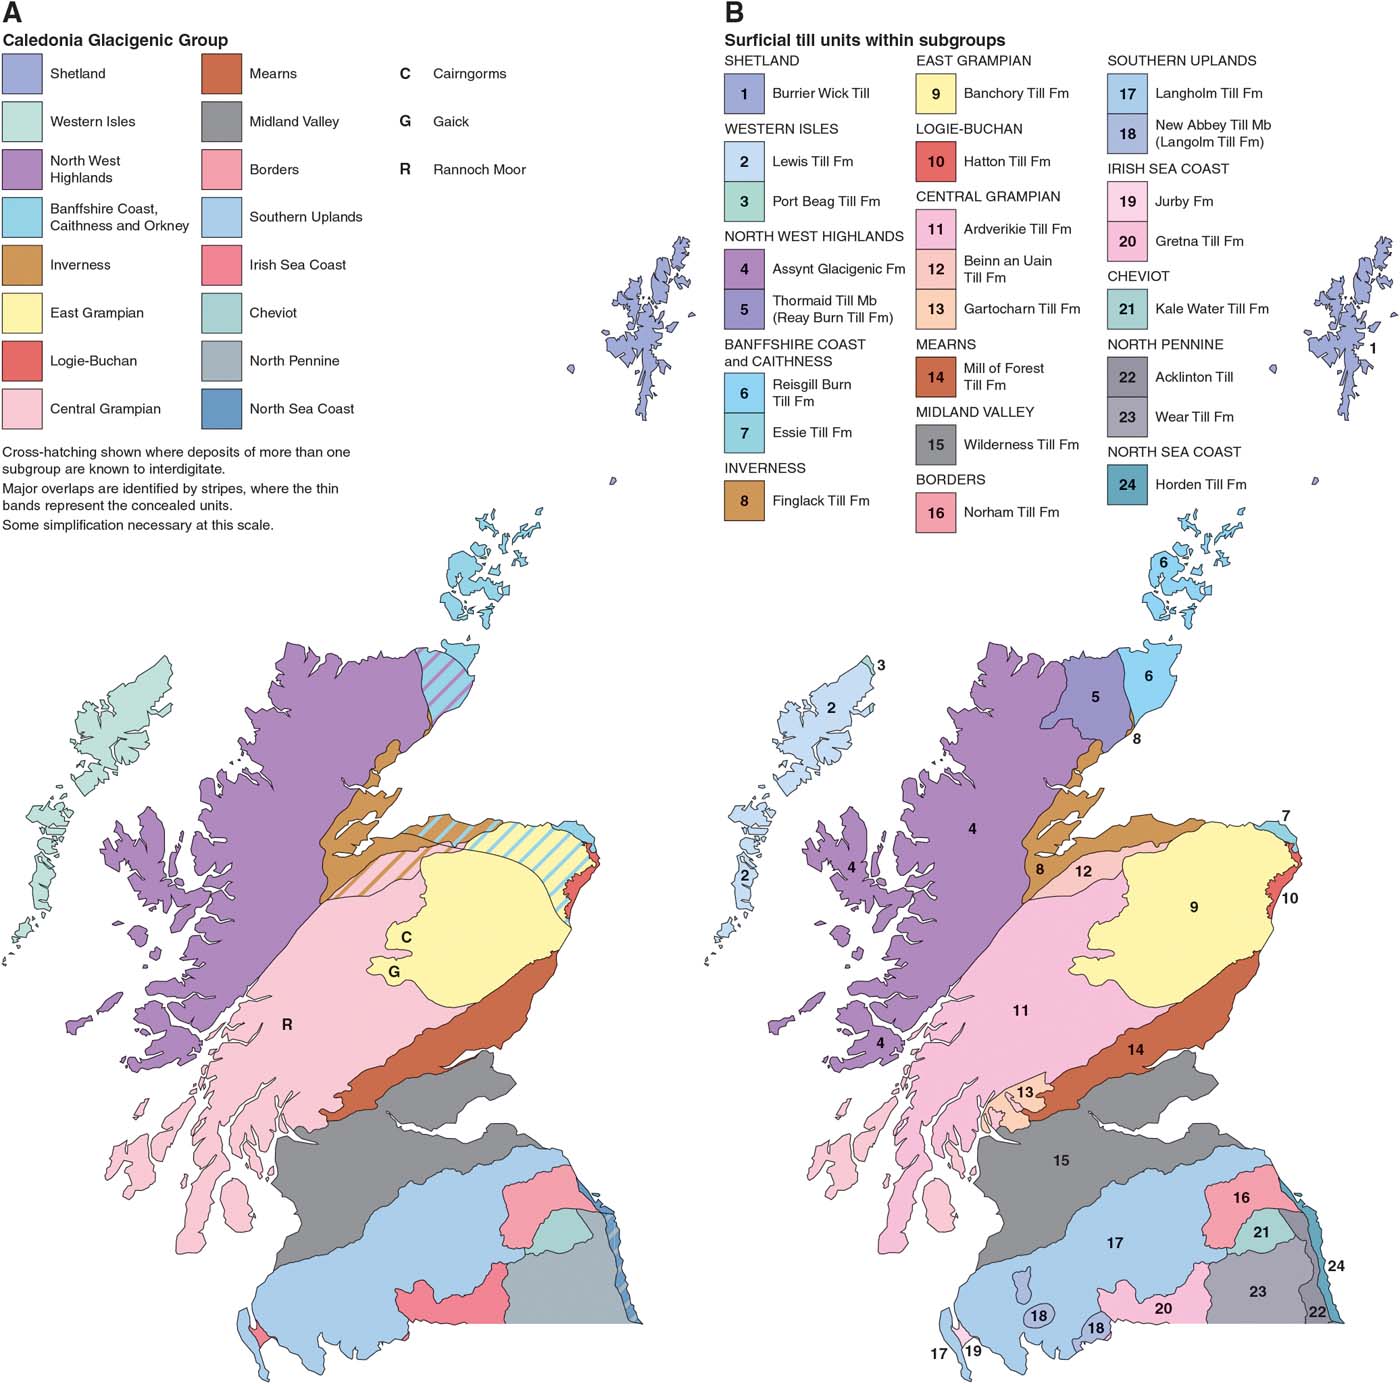
The traditional approach of establishing contact relationships, sedimentology and lithostratigraphical correlations of named units has helped to decipher the sequence of events and glacial interactions that have occurred in Scotland. The formal ‘top-down' lithostratigraphical framework of McMillan et al. (Reference McMillan, Merritt, Auton and Golledge2011a) is followed here. In this scheme, the Great Britain Superficial Deposits Supergroup includes seven named groups, including (in Scotland) the British Coastal Deposits Group embracing raised marine and coastal deposits, the Britannia Catchments Group, comprising predominantly fluvial deposits, and a Residual Deposits Group, including mainly remanié deposits and other units that have undergone prolonged dissolution (Table 1). Two groups are assigned for glacigenic deposits, namely the Caledonia Glacigenic Group, of MIS 5e-2 age, and the Albion Glacigenic Group, representing older glaciations. Deposits of these groups in Scotland are included in a series of subgroups that have been divided geographically, some by natural boundaries, such as the Great Glen, but mostly on the basis of overall lithology and provenance of the constituent formations (Fig. 3a). The concept of subdivision is not new; for example, in NE Scotland three ‘series' of glacigenic deposits have been recognised traditionally relating to distinct bodies of ice that existed in the region during past glaciations (Merritt et al. Reference Merritt, Auton, Connell, Hall and Peacock2003, Reference Merritt, Connell and Hall2017a). The glacigenic sequences include some non-glacial, terrestrial sediments, periglacial deposits and soils that provide important biostratigraphical and geochronometric evidence and stratigraphical markers. These units are included in the Britannia Catchments Group.
Summary details of the groups within the Great Britain Superficial Deposits Supergroup represented in Scotland (from McMillan et al. Reference McMillan, Hamblin and Merritt2011a). Abbreviation: MIS=Marine Isotope Stage.

Distribution of glacigenic subgroups (A) and superficial till units (B) (modified from McMillan et al. Reference McMillan, Hamblin and Merritt2011a). Abbreviations: C=Cairngorms; G=Gaick; R=Rannoch Moor.

A first step towards a systematic geographical delineation of surficial till units in Britain was undertaken in 2009 (Entwisle & Wildman Reference Entwisle and Wildman2010), utilising the British Geological Survey (BGS) Superficial and Bedrock Geology themes draped on hill-shaded digital elevation models (DEMs; http://www.bgs.ac.uk/data/maps/home.html) (Fig. 3b). Archive BGS mapping, digital air photos and other relevant data were used in that exercise, including the BRITICE database (Clark et al. Reference Clark, Evans, Khatwa, Bradwell, Jordan, Marsh, Mitchell and Bateman2004; Evans et al. Reference Evans, Clark and Mitchell2005). Similar protocols were followed as for the delineation of glacigenic subgroups, using literature review and prior knowledge of general ice-flow trajectories, glacial history and simplified bedrock geology. As the matrices of tills are known to bear a strong relationship with underlying bedrock (Benn & Evans Reference Benn and Evans2010), many boundaries are positioned a short distance ‘down ice' of significant changes in bedrock geology. The use of descriptive qualifiers (such as ‘till') and other issues of protocol are discussed by McMillan & Merritt (Reference McMillan and Merritt2012).
2. The Late Pleistocene record
The climate records inferred from offshore sediment cores and Greenland Ice Sheet cores highlight the variability of Late Pleistocene climate (Fig. 2). For example, they reveal 26 clearly defined stadials and interstadials, with numerous sub-events (Rasmussen et al. Reference Rasmussen, Bigler, Blockley, Blunier, Buchardt, Clausen, Cvijanovic, Dahl-Jensen, Johnsen, Fischer, Gkinis, Guillevic, Hoek, Lowe, Pedro, Popp, Seierstad, Steffensen, Svensson, Vallelonga, Vinther, Walker, Wheatley and Winstrup2014). However, events in Scotland, and particularly the timing and pattern of glacier and ice sheet development, remain uncertain because of the absence of unambiguous local stratigraphic evidence and dating. Nevertheless, a broad picture may be inferred from the Greenland event stratigraphy (Lowe et al. Reference Lowe, Rasmussen, Björk, Hoek, Steffensen, Walker and Yu2008b; Rasmussen et al. Reference Rasmussen, Bigler, Blockley, Blunier, Buchardt, Clausen, Cvijanovic, Dahl-Jensen, Johnsen, Fischer, Gkinis, Guillevic, Hoek, Lowe, Pedro, Popp, Seierstad, Steffensen, Svensson, Vallelonga, Vinther, Walker, Wheatley and Winstrup2014), offshore evidence from the Atlantic Shelf adjacent to Scotland (e.g., Hibbert et al. Reference Hibbert, Austin, Leng and Gatliffe2010), the speleothem record from caves in Northern England (Latham & Ford Reference Latham, Ford, Waltham and Lowe2013) and comparison with the fluctuations of the Fennoscandian Ice Sheet (FIS) (Hughes et al. Reference Hughes, Gyllencreutz, Lohne, Mangerud and Svendsen2016; Patton et al. Reference Patton, Hubbard, Andreassen, Auriac, Whitehouse, Stroeven, Shackleton, Winsbarrow, Heyman and Hall2017), particularly regarding evidence of its presence in the North Sea basin (Phillips et al. Reference Phillips, Hodgson and Emery2017; Stewart et al. Reference Stewart, Carter, Dove, Stewart, Green, Cooper, Cotterill and Gafeira2019).
Clapperton (Reference Clapperton and Gordon1997) used the Greenland Ice Core Project (GRIP) Summit ice core δ18O record to infer time intervals during the Devensian when climate conditions in Scotland could have supported different types of ice mass, including ice sheets, mountain ice caps and corrie glaciers (Fig. 2). Although such extrapolation is over-simplified, it nevertheless suggests that glaciers in one form or another are likely to have existed in Scotland for extended parts of the Devensian.
Core MD04-2822 from the Rockall Trough, beneath the Atlantic Ocean 300km W of Scotland, provides lithological evidence for the build-up and expansion of the BIIS across the Hebridean Shelf during the Early Devensian (MIS 4), fed by ice sources in Scotland and Northern Ireland. Pulses of ice-rafted debris (IRD) occurred at 70.2 and 61.7ka (Hibbert et al. Reference Hibbert, Austin, Leng and Gatliffe2010). The same core, and core MD95-2006 from the Barra-Donegal Fan, some 200km W of the Scottish mainland (Hall et al. Reference Hall, Merritt, Connell and Hubbard2018, fig. 2), demonstrate limited delivery of IRD diagnostic of British Palaeogene Igneous Province sources in Scotland and Northern Ireland to these sites during the early part of MIS 3. However, pulses followed at 41 and 38.5ka and a steep increase occurred at 27.4ka (Knutz et al. Reference Knutz, Austin and Jones2001; Peters et al. Reference Peters, Walden and Austin2008; Hibbert et al. Reference Hibbert, Austin, Leng and Gatliffe2010). This pattern of IRD delivery is consistent with the periods of cooling in the North Atlantic region revealed in the Greenland ice cores, and indicates BIIS growth during the Early Devensian of sufficient size and extent to deliver IRD to the coring sites, followed by dynamic and fluctuating glacial responses to climate change. It also supports previous indications of Early Devensian ice sheet glaciation (Sutherland Reference Sutherland1981; Sissons Reference Sissons1983; Bowen & Sykes Reference Bowen and Sykes1988; Bowen et al. Reference Bowen, Philips, McCabe, Knutz and Sykes2002).
Comparison with SW Norway also lends support to dynamic glacial responses following MIS 5e. For example, extensive ice-free conditions are indicated during the warm phases of MIS 5c and 5a (Helle et al. Reference Helle, Sonstegaard, Coope and Rye1981; Hughes et al. Reference Hughes, Gyllencreutz, Lohne, Mangerud and Svendsen2016), whereas during the MIS 5b and 5d cold intervals, glaciers extended to the present coast at limits similar to, or just outside those of glaciers in the Younger Dryas (Mangerud Reference Mangerud, Ehlers and Gibbard2004). During MIS 4 and early MIS 3, all of southern Norway was ice covered, with the ice sheet extending into Denmark at 65–60 and 55–50ka (Larsen et al. Reference Larsen, Knudsen, Krohn, Kronborg, Murray and Nielsen2009) and onto the bed of the northern North Sea (Carr et al. Reference Carr, Holmes, van der Meer and Rose2006). Later in MIS 3, the timing of glacial-interstadial phases is constrained by sediments in coastal caves in western Norway (Larsen & Mangerud Reference Larsen and Mangerud1989; Valen et al. Reference Valen, Larsen and Mangerud1995, Reference Valen, Mangerud, Larsen and Hufthammer1996). Ice advanced beyond the present coastline at ∼41ka, with withdrawal by 38ka. During Greenland Interstadials GI 8–GI 7, at 38.2–34.5ka, coastal areas were free of glacier ice during the Ålesund Interstadial, with sufficient vegetation cover for reindeer to graze (Mangerud et al. Reference Mangerud, Gyllencreutz, Lohne, Svendsen, Ehlers, Gibbard and Hughes2011). Expansion of the last FIS may have occurred later than in Scotland, with ice first reaching limits in northern Denmark after 29ka. Radiocarbon dates for marine shells indicate that the Witch Ground Basin beneath the central North Sea remained ice free until after 34.7–32.4ka (Sejrup et al. Reference Sejrup, Hjelstuen, Nygård, Haflidason and Mardal2015) or 36.1–33.7ka (Graham et al. Reference Graham, Lonergan and Stoker2010). Ice withdrew from northern Denmark at 27–23ka before advance to maximum limits at 23–21ka (Larsen et al. Reference Larsen, Knudsen, Krohn, Kronborg, Murray and Nielsen2009)
Most of the glacigenic deposits in Scotland were laid down during the Late Devensian. The last Scottish Ice Sheet, which dominated the BIIS, appears to have expanded sometime after ∼35–32ka based on radiocarbon dates from sediments underlying glacial deposits in the Central Lowlands (Section 5.4). It reached its maximum extent on the Atlantic Shelf at ∼30–27ka, although this is now thought to have been neither synchronous across different parts of the ice sheet (Ballantyne & Small Reference Ballantyne and Small2018), nor in tandem with the FIS (Section 3.2). Numerical modelling indicates that the ice sheet was highly dynamic with rapid changes in extent (Boulton & Hagdorn Reference Boulton and Hagdorn2006; Hubbard et al. Reference Hubbard, Bradwell, Golledge, Hall, Patton, Sugden, Cooper and Stoker2009). The terrestrial stratigraphy of Scotland, therefore, needs to be viewed in the context of a highly dynamic and climate-sensitive ice sheet that may have existed throughout much of the Devensian (Ballantyne & Small Reference Ballantyne and Small2018).
There have been significant advances in understanding of the lithostratigraphic and chronostratigraphic framework for Scotland since the publication of the Quaternary of Scotland (Gordon & Sutherland Reference Gordon, Gordon and Sutherland1993a). These are reviewed below for a number of critical regions that are grouped broadly into three categories with reference to former ice accumulation areas:
A. Peripheral areas: Shetland, Orkney, Caithness and the Outer Hebrides (Western Isles). These are significant because they include deposits that have been preserved locally beneath cold-based ice and provide key information on the timing of ice sheet advance and retreat.
B. Core areas: the North-West Highlands and Central Highlands. These are significant because they were the main centres of ice accumulation beneath which older deposits have been preserved locally due to relatively little subglacial erosion.
C. Lowland depocentres: Inverness and the Great Glen, NE Scotland, Southern Argyll and Arran, the West Central Lowlands and the Solway Lowlands. These are significant for thick sequences of multiple tills and intercalated sediments.
3. Peripheral areas
Scottish ice reached its maximum limits during the Middle and Late Devensian, marked by a series of moraine ridges close to the NW Atlantic shelf edge (Bradwell et al. Reference Bradwell, Stoker, Golledge, Wilson, Merritt, Long, Everest, Hestvik, Stevenson, Hubbard, Finlayson and Mathers2008a; Clark et al. Reference Clark, Hughes, Greenwood, Jordan and Sejrup2012a). At this time the BIIS is believed to have been confluent with the FIS in the North Sea (Graham et al. Reference Graham, Stoker, Lonergan, Bradwell and Stewart2011; Ballantyne & Small Reference Ballantyne and Small2018). Earlier claims that ice-free areas existed at the LGM at low elevations in peripheral parts of Scotland (Sutherland Reference Sutherland1984), particularly in Lewis (Sutherland & Walker Reference Sutherland and Walker1984), Caithness and Orkney (Bowen & Sykes Reference Bowen and Sykes1988) and in Buchan (Synge Reference Synge1956, Reference Synge1963), have been shown to be inconsistent with new stratigraphic and dating evidence for LGM ice cover in these areas (Hall & Whittington Reference Hall and Whittington1989; Hall Reference Hall and Jarvis1995; Whittington et al. Reference Whittington, Connell, Coope, Edwards, Hall, Hulme and Jarvis1998; Ballantyne & Hall Reference Ballantyne and Hall2008; Hall & Riding Reference Hall and Riding2016). Nonetheless, the stratigraphic record in these peripheral areas remains of high importance for understanding the timing, sequence and pattern of the last ice sheet glaciation and associated environmental changes.
3.1. Shetland
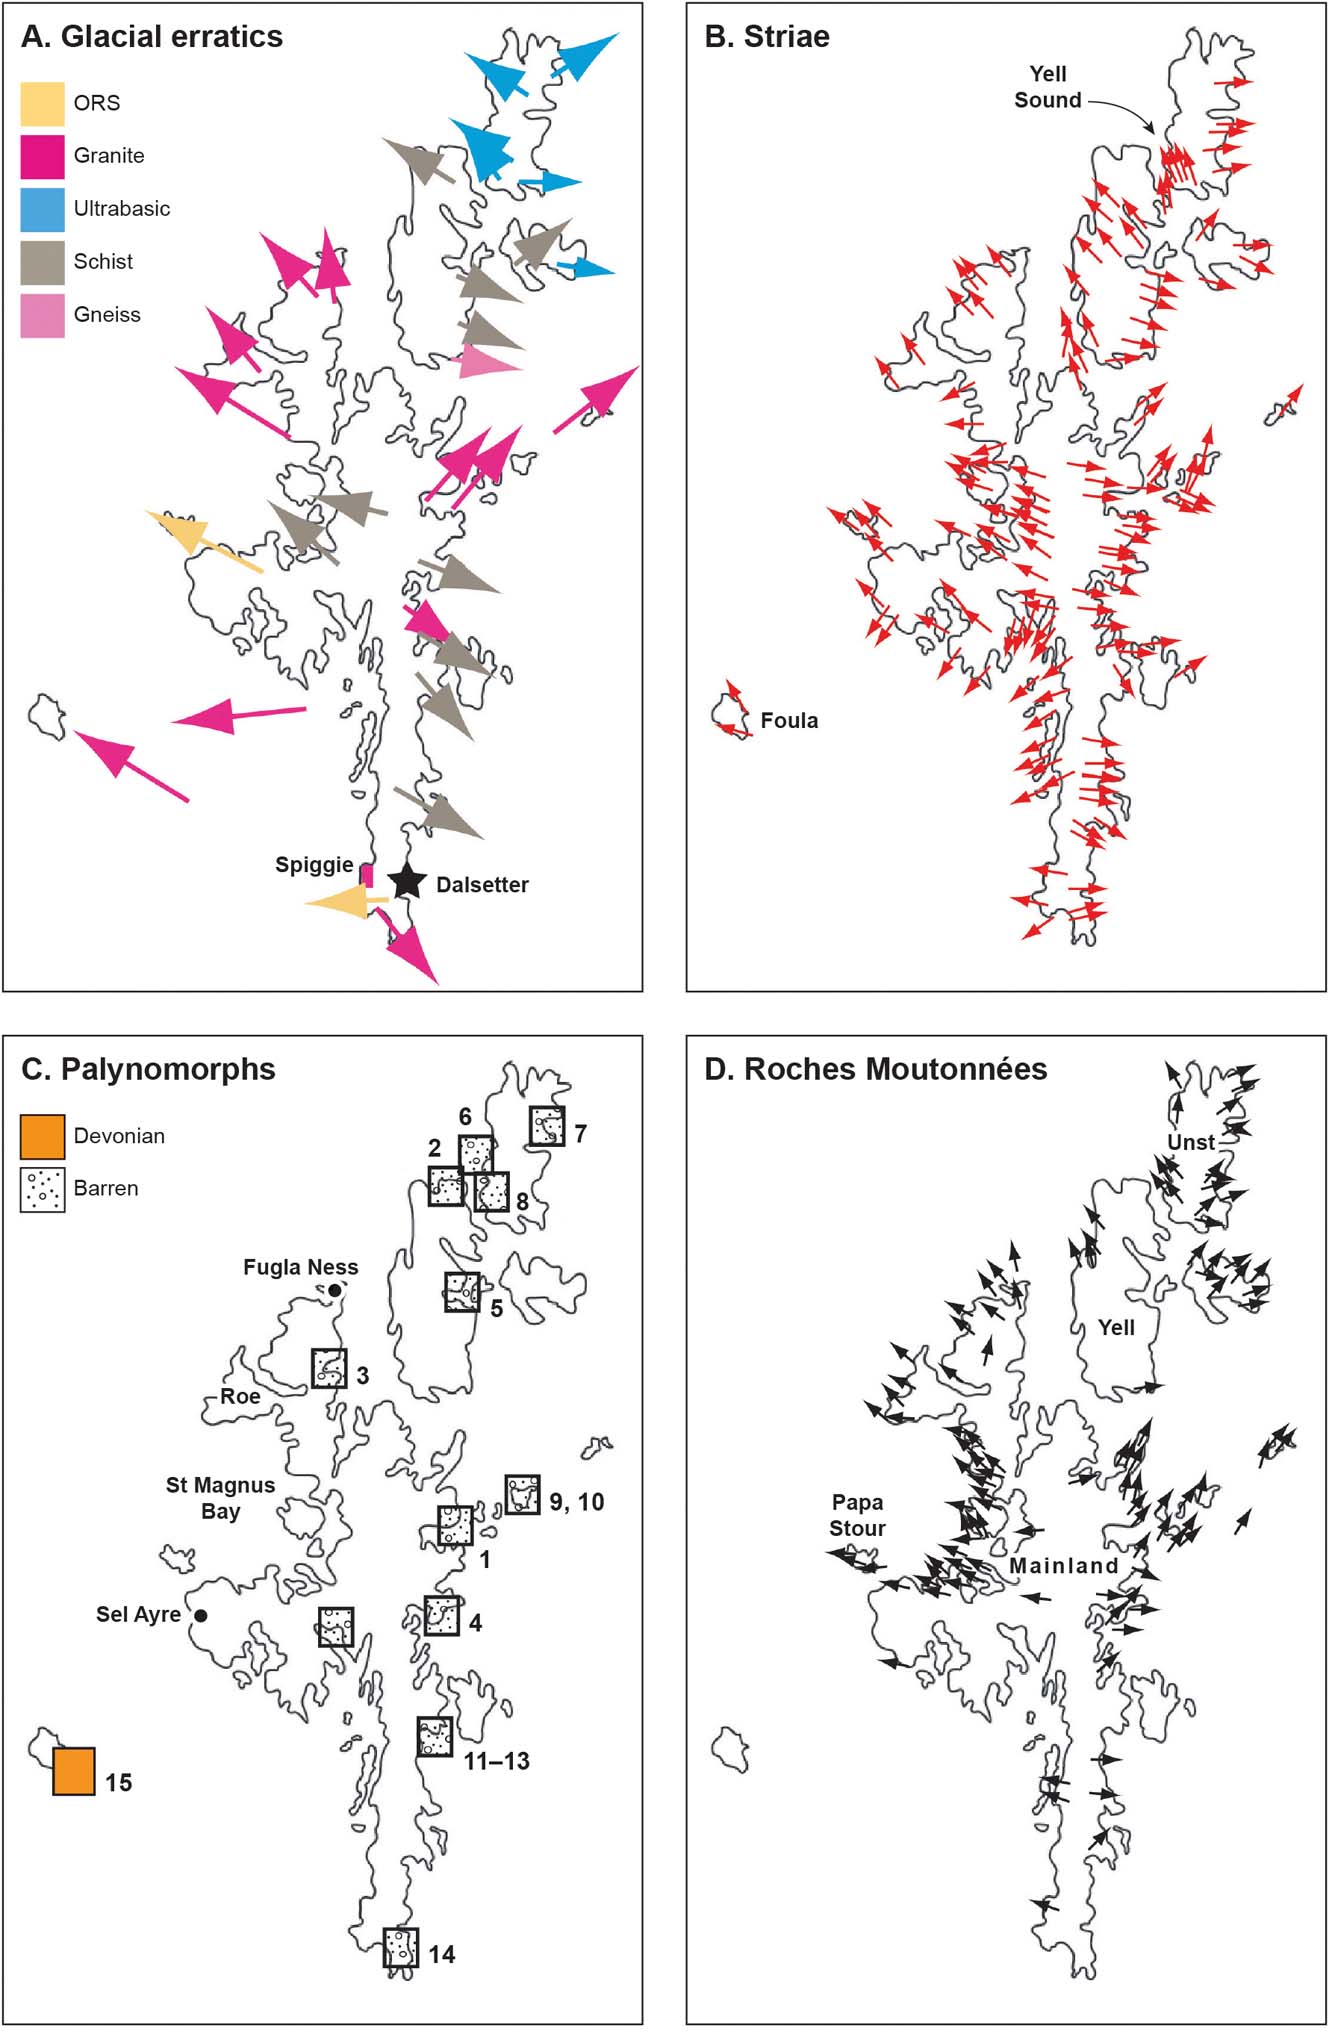
Shetland, Orkney and Caithness together form a topographic divide between the NE Atlantic and the North Sea (Hall et al. Reference Hall, Merritt, Connell and Hubbard2018, fig. 2). On Shetland, there has been debate since the 19th Century as to whether the islands supported a local ice cap (Milne-Home Reference Milne-Home1881; Flinn Reference Flinn1978) or if they were overwhelmed by the FIS during the last glaciation (Peach & Horne Reference Peach and Horne1879; Sutherland & Gordon Reference Sutherland, Gordon, Gordon and Sutherland1993b). That debate continues (Ross Reference Ross1996; Golledge et al. Reference Golledge, Finlayson, Bradwell and Everest2008; Flinn Reference Flinn2009; Carr & Hiemstra Reference Carr and Hiemstra2013). The identification of only one Scandinavian erratic on the islands (Finlay Reference Finlay1926), the absence of Permian to Neogene palynomorphs in tills derived from the bed of the North Sea and evidence of radial ice-flow patterns from erratics, glacial bedforms and striae (Fig. 4) provides little support for former flow of ice across Shetland (Hall Reference Hall2013). There is no evidence from erratics that Scottish ice reached Shetland (Hall Reference Hall2013), except Fair Isle, midway between Shetland and Orkney (Hall & Fraser Reference Hall and Fraser2014). Consequently, the balance of evidence strongly supports the existence of an independent Shetland ice cap (SIC) during the Late Devensian (Hall Reference Hall2013).
Evidence for the pattern of ice flow on Shetland (modified from Hall Reference Hall2013). (A) Directions of glacial erratic carry. (B) Measurements of striae, excluding disputed early records (from Peach & Horne Reference Peach and Horne1879). (C) Palynomorph records for till matrix at key sites (J. B. Riding, pers. comm. 2016). Sample sites: 1. Vidlin Voe; 2. Sand Voe; 3. Colla Firth; 4. South Nesting; 5. Salt Wick; 6. Wick of Collaster; 7. Norwick; 8. Westing; 9. The Bugg; 10. Sand Wick; 11–13. Breiwick; 14. Little Bixter; 15. Sand of Hayes; 16. Da Ristie Nessies. (D) Ice-flow directions from rôches moutonnées.

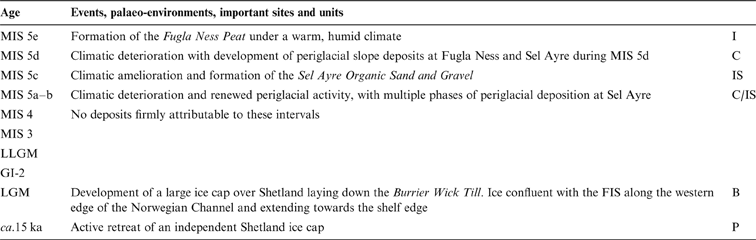
The oldest Quaternary sediment recognised on Shetland is from Fugla Ness (Fig. 4; Table 2), on the island of North Roe, where coastal erosion has exposed a shallow basin developed in bedrock within glacially scoured ‘cnoc-and-lochain' terrain (Chapelhowe Reference Chapelhowe1965; Fig. 5). Resting above ‘rock-face breccia' (gelifractate?) on the striated floor of the depression is the Fugla Ness Lower Till, with a fabric indicating ice flow to the W or NW (Hall et al. Reference Hall, Whittington, Gordon, Birnie, Gordon, Bennett and Hall1993b, Reference Hall, Gordon, Whittington, Duller and Heijnis2002). The overlying, compacted organic deposits of the Fugla Ness Peat Bed thicken towards the centre of the basin, comprising a thick lower unit containing some wood fragments and thinner layers above with more wood, small pine stumps and pine cones (Birks Reference Birks, Gordon and Sutherland1993a). The presence of thermophilous pollen and macrofossils indicates that the peat formed during an interglacial (Birks & Ransom Reference Birks and Ransom1969). The pollen record indicates that Pinus and possibly Ilex grew locally in sheltered areas in a mild, oceanic climate, possibly with wind speeds lower than today (Hall et al. Reference Hall, Gordon, Whittington, Duller and Heijnis2002). The maritime heath flora has been compared to that of the Gortian Interglacial in Ireland (Birks & Ransom Reference Birks and Ransom1969), but it is also consistent with existing environmental reconstructions for the Ipswichian/Eemian interglacial in maritime NW Europe (Hall et al. Reference Hall, Gordon, Whittington, Duller and Heijnis2002). A uranium-series age of 110+40/−35ka supports the case that the Fugla Ness Peat was formed during the last interglacial (MIS 5e) (Hall et al. Reference Hall, Gordon, Whittington, Duller and Heijnis2002). The later change in vegetation indicated by the pollen record suggests a drop in annual temperature and an increased frequency of frosts (Birks & Ransom Reference Birks and Ransom1969). The high representation of grasses in the pollen reworked into the overlying Fugla Ness Breccia may reflect a climatic deterioration to periglacial conditions, which resulted in granular and blocky disintegration of the local bedrock accompanied by wash and solifluction of the debris into the basin (Hall et al. Reference Hall, Gordon, Whittington, Duller and Heijnis2002). The apparent continuity of deposition has been used to suggest that the breccia formed during MIS 5d, when periglacial conditions prevailed throughout NW Europe (Aalbersberg & Litt Reference Aalbersberg and Litt1998).
Summary of events in the Shetland Islands. Abbreviations: B=glacial ‘binge'; C=cold-periglacial; I=Interglacial; IS=Interstadial; P=glacial ‘purge'.

The stratigraphy at Fugla Ness, Shetland (modified from Hall et al. Reference Hall, Gordon, Whittington, Duller and Heijnis2002).

Organic sediments and peat are also found beneath till and periglacial deposits at Sel Ayre, on the Sandness peninsula of Mainland Shetland (Birks & Peglar Reference Birks and Peglar1979; Birks Reference Birks, Gordon and Sutherland1993b; Hall et al. Reference Hall, Gordon, Whittington, Birnie, Gordon, Bennett and Hall1993a; Figs 4, 6). The Sel Ayre Lower Breccia records periglacial conditions. These coarse sediments retain no record of any vegetation cover, but are tentatively assigned to MIS 5d (Hall et al. Reference Hall, Gordon, Whittington, Duller and Heijnis2002). The overlying Sel Ayre Organic Sands and Gravels are attributed to MIS 5c on the basis of pollen stratigraphy and luminescence ages of ca.105–98ka from intercalated sands (Duller et al. Reference Duller, Wintle and Hall1995). The pollen record indicates that an earlier grassland environment was followed by ericaceous heath with associated changes in soil type, with a brown earth of the grassland being replaced by the bleached sand of a more podzolic soil (Birks Reference Birks, Gordon and Sutherland1993b). This was followed by open, grass-dominated vegetation with a variety of herbs characteristic of skeletal mineral soils. The Sel Ayre sequence appears to record major environmental changes through the MIS 5c interstadial on Shetland (Hall et al. Reference Hall, Gordon, Whittington, Duller and Heijnis2002). The overlying Sel Ayre Upper Breccia is devoid of organic material, but apparent continuity of deposition suggests that it may date from the succeeding cold interval, MIS 5b, when periglacial conditions returned to the lowlands of NW Europe (Aalbersberg & Litt Reference Aalbersberg and Litt1998).
The stratigraphy at Sel Ayre, Shetland (modified from Hall et al. Reference Hall, Gordon, Whittington, Birnie, Gordon, Bennett and Hall1993a).

Till fabric data from the Fugla Ness Upper Till (Fig. 5) and Sel Ayre Till (Fig. 6) are consistent with the patterns of ice flow during the local ice cap phase of glaciation (Hall et al. Reference Hall, Gordon, Whittington, Duller and Heijnis2002). This phase is usually attributed to the Late Devensian, although firm dating evidence is lacking (Gordon et al. Reference Gordon, Hall, Ross, Birnie, Gordon, Bennett and Hall1993; Ross et al. Reference Ross, Hall, Gordon, Birnie, Gordon, Bennett and Hall1993; Ross Reference Ross1996). Despite suggestions on geomorphological criteria that ice-free areas existed during the LGM on northern Unst and Yell (Flinn Reference Auton, Merritt, Auton and Phillips1983; Long & Skinner Reference Long and Skinner1985), and also Ross (Reference Ross1996), offshore data indicate that the SIC extended well beyond the current landmass to the E and N, and close to the edge of the continental shelf W of Shetland (Johnson et al. Reference Johnson, Richards, Long and Graham1993; Stoker et al. Reference Stoker, Hitchen and Graham1993; Ross Reference Ross1996). Sets of moraines on the West Shetland Shelf have been interpreted to represent multiple phases of expansion of the SIC during the Middle and Late Devensian (Davison Reference Davison2004). Stacked till sequences have not been widely recognised on Shetland (Ross Reference Ross1996), where till is generally thinly developed (Hall Reference Hall2013). Only single till units are recognised above the MIS 5 organic sediments at Fugla Ness and Sel Ayre (Hall et al. Reference Hall, Gordon, Whittington, Duller and Heijnis2002), these units having been re-assigned to the Burrier Wick Till Formation (McMillan et al. Reference McMillan, Hamblin and Merritt2011a; Fig. 3b). However, marked differences in erratic content and lithology present within the till units on, for example, North Roe (Chapelhowe Reference Chapelhowe1965) and on Unst (Golledge et al. Reference Golledge, Finlayson, Bradwell and Everest2008; Fig. 4), suggest that a more complex glacial stratigraphy awaits elucidation.
The flow of ice from SW Norway across Shetland is a recurrent feature of both classic 19th Century (Croll Reference Croll1870; Peach & Horne Reference Peach and Horne1879, Reference Peach and Horne1880) and modern ice sheet reconstructions (Bradwell et al. Reference Bradwell, Stoker, Golledge, Wilson, Merritt, Long, Everest, Hestvik, Stevenson, Hubbard, Finlayson and Mathers2008a; Graham et al. Reference Graham, Lonergan and Stoker2010; Sejrup et al. Reference Sejrup, Clark and Hjelstuen2016). Yet, firm evidence for the former presence of the FIS (or BIIS) on Shetland is absent. In western Shetland, flow sets interpreted from DEMs (Golledge et al. Reference Golledge, Finlayson, Bradwell and Everest2008) generally conform to patterns of westward ice flow recognised from the dispersal of erratics, striae and rôches moutonnées (Mykura & Phemister Reference Mykura and Phemister1976; Flinn Reference Flinn1978; Hall Reference Hall2013). Conflicting evidence has been reported from eastern Shetland, however, for the interpretation of mega-scale glacial lineations (MSGLs) (Golledge et al. Reference Golledge, Finlayson, Bradwell and Everest2008), and kinematics derived from glacitectonic structures (Carr & Hiemstra Reference Carr and Hiemstra2013) suggests westward ice flow, whereas erratic dispersal, striae and rôches moutonnées indicate eastward ice flow (Flinn Reference Flinn2009; Hall Reference Hall2013; Fig. 4a).
The last glaciation of Shetland likely involved the development of an extensive ice cap that interacted with the Norwegian Channel Ice Stream (NCIS) between Shetland and Norway, and with ice flowing between Orkney and Shetland. Early build-up, but limited extension of the SIC, are features of recent mathematical models (Hubbard et al. Reference Hubbard, Bradwell, Golledge, Hall, Patton, Sugden, Cooper and Stoker2009). Earlier suggestions that an initial phase of FIS glaciation on Shetland was followed by the build-up of a local ice sheet (Hoppe Reference Hoppe1974; Mykura & Phemister Reference Mykura and Phemister1976) lack support on account of: (i) the scarcity of Scandinavian erratics; (ii) the absence of glacial transport of Permo-Triassic debris across the islands from basins located to the E; and (iii) the apparent absence of glacial deposits from the FIS, especially in zones of lower glacial erosion in the ice shed zone of the SIC and in western areas of the archipelago where MIS 5 deposits are preserved (Hall Reference Hall2013). Furthermore, the tills on Shetland also appear to lack palynomorphs derived from sedimentary rocks and sediments in the northern North Sea basin (Fig. 4c). MSGLs along the margins of Yell Sound, between Yell and Mainland, and Bluemull Sound, between Unst and Yell (Fig. 4; Golledge et al. Reference Golledge, Finlayson, Bradwell and Everest2008) are associated with distinctive mud-rich, grey tills (Chapelhowe Reference Chapelhowe1965; Ross Reference Ross1996) and probably record fast flow within SIC-sourced ice from the heads of both sounds. Patterns of erratic dispersal and glacial lineaments at the northern and southern extremities of Shetland can be attributed to ice sheds off the present eastern coast (Ross Reference Ross1996). Striae (Peach & Horne Reference Peach and Horne1879) and glacitectonic structures (Carr & Hiemstra Reference Carr and Hiemstra2013), previously interpreted as indicating widespread onshore movement of ice in eastern Shetland, are both considered by Hall (Reference Hall2013) to have been interpreted incorrectly.
The pattern of deglaciation around Shetland has become much clearer in recent years with the advent of detailed imagery of bedforms on the adjacent sea bed (Bradwell et al. Reference Bradwell, Stoker, Golledge, Wilson, Merritt, Long, Everest, Hestvik, Stevenson, Hubbard, Finlayson and Mathers2008a). The SIC retreated back towards the spine of the islands from both the W and E, with moraines on Papa Stour marking a late stage of ice retreat into St Magnus Bay (Fig. 4; Mykura & Phemister Reference Mykura and Phemister1976). Rogen moraines on the floor of the Pobie Basin, to the E of Unst, indicate ice retreat towards the S (Bradwell et al. Reference Bradwell, Stoker, Golledge, Wilson, Merritt, Long, Everest, Hestvik, Stevenson, Hubbard, Finlayson and Mathers2008a), with moraines on Unst (Golledge et al. Reference Golledge, Finlayson, Bradwell and Everest2008) marking positions of the western flank of this retreating ice lobe.
3.2. Orkney and Caithness
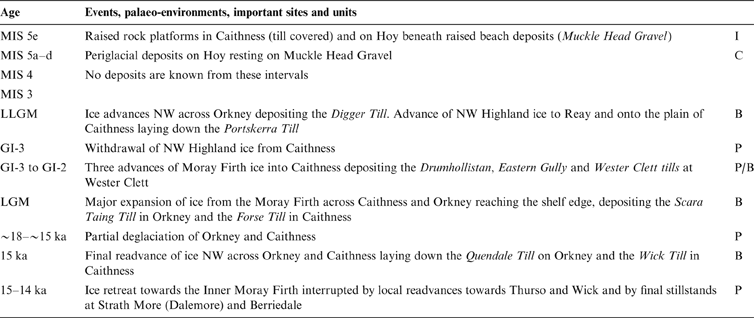
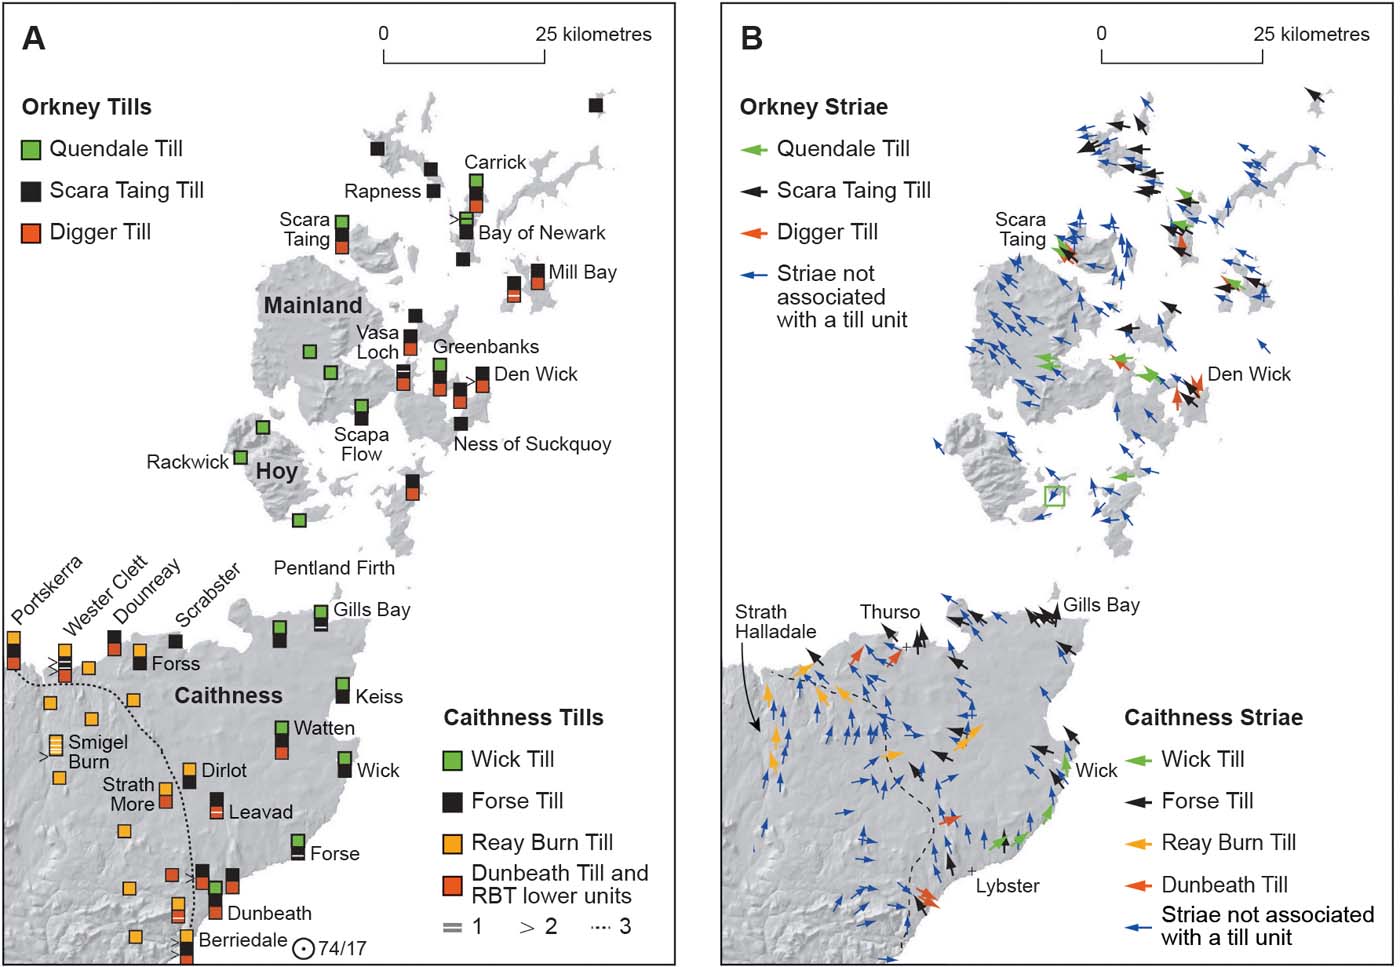
More complex glacial sequences occur in Orkney and Caithness (Hall & Whittington Reference Hall and Jarvis1989; Gordon Reference Gordon, Gordon and Sutherland1993a; Hall et al. Reference Hall, Auton, Michie, Pearson and Riding2011), from which a three-stage glaciation has been proposed recently for the last glacial cycle, based on the preservation of stacked till sequences (Hall & Riding Reference Hall and Riding2016; Hall et al. Reference Hall, Riding and Brown2016a; Fig. 7a; Table 3) (Section 3.2.2).
Summary of events in Caithness and on the islands of Orkney. Abbreviations: B=glacial ‘binge'; C=cold-periglacial; I=Interglacial; P=glacial ‘purge'.

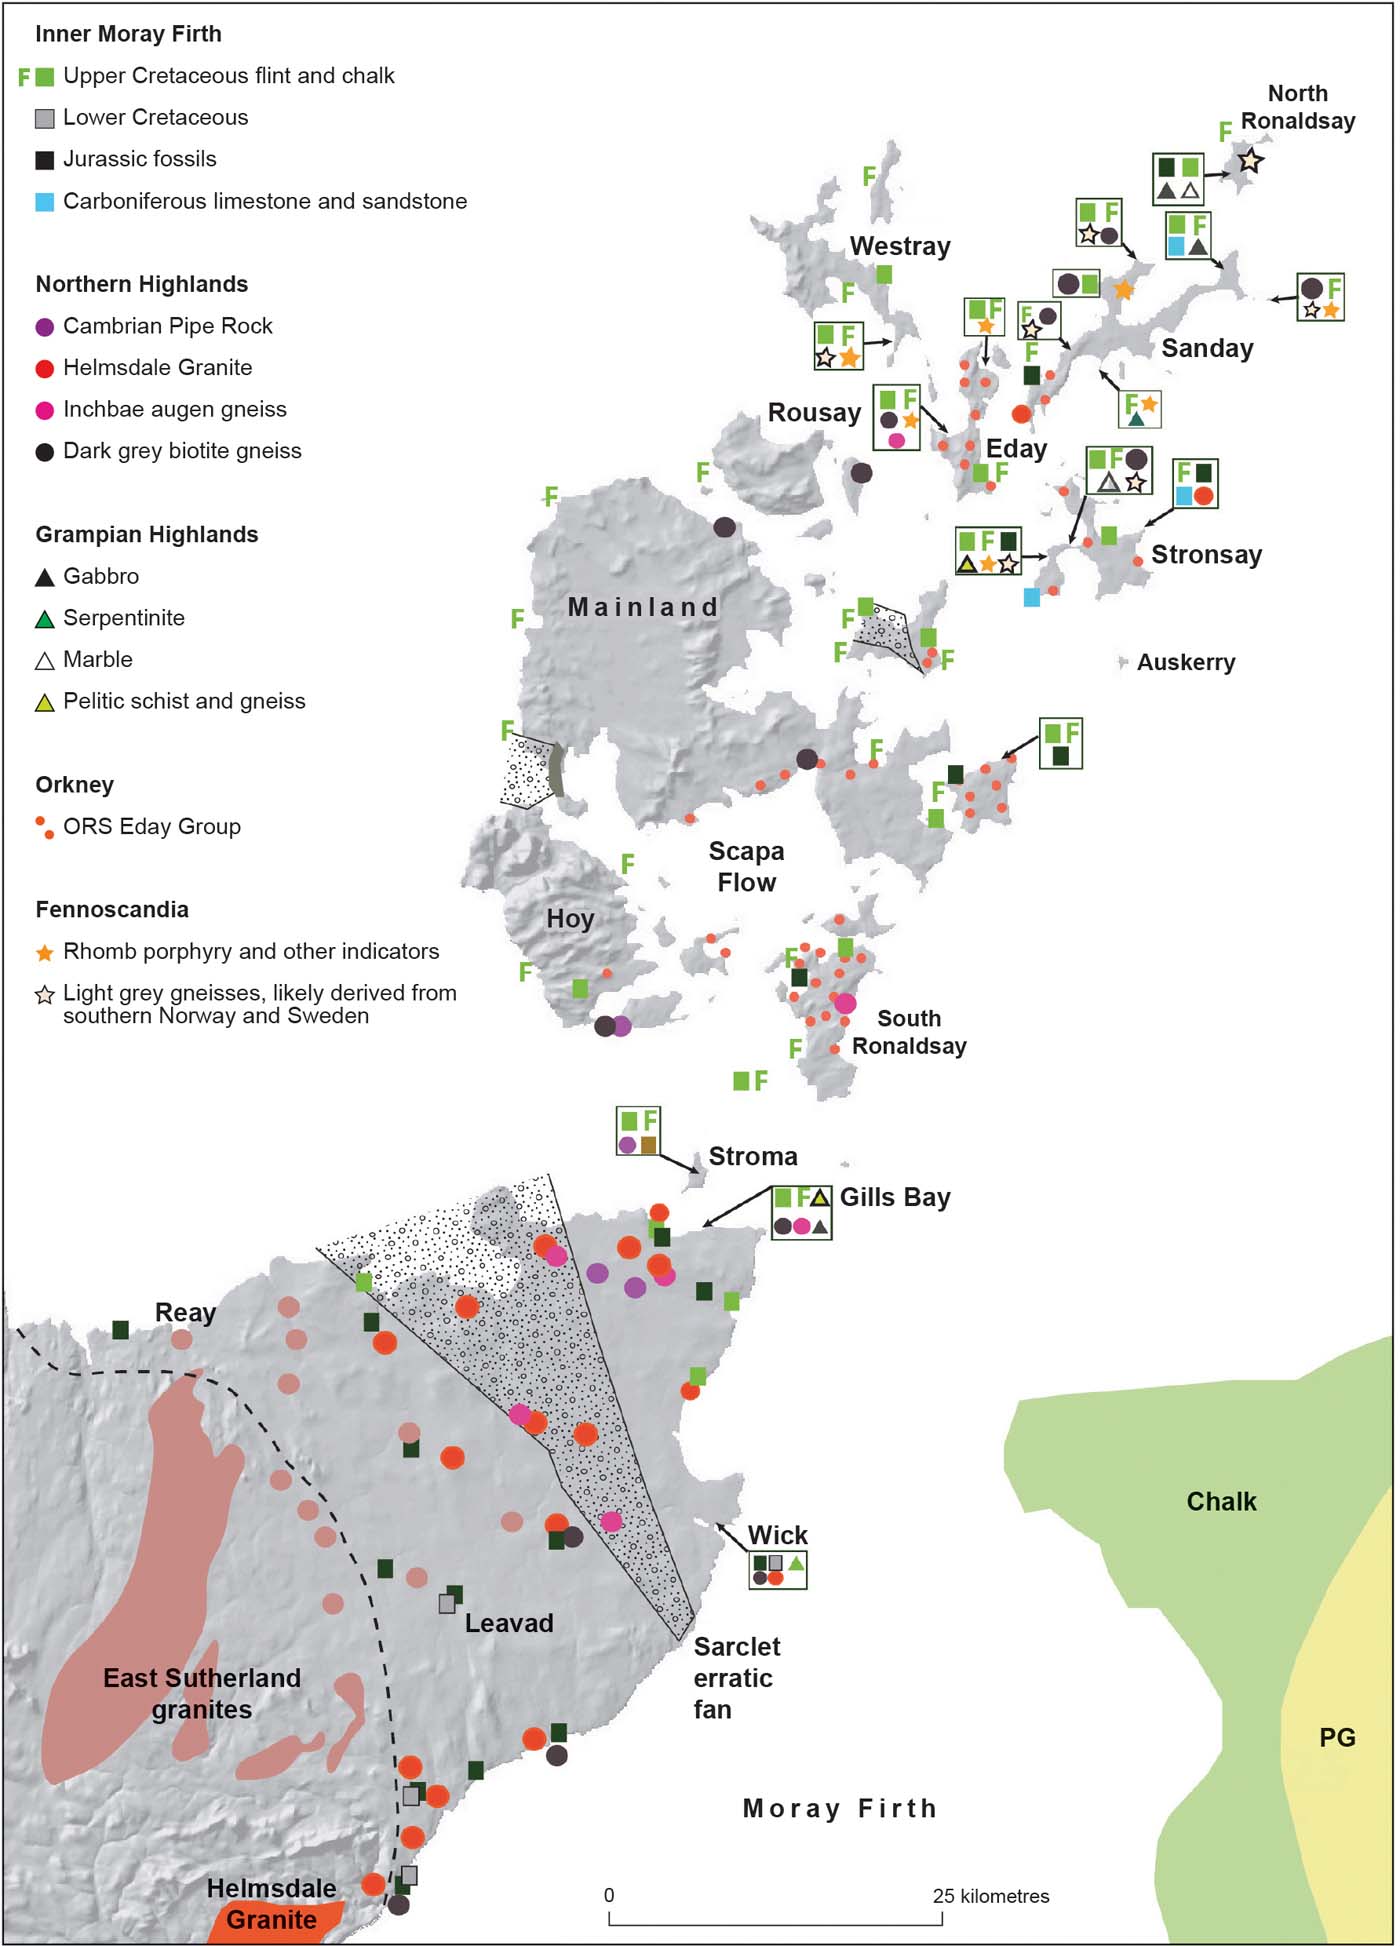
The oldest features recognised in Caithness and Orkney are raised and intertidal rock platforms and associated rock cliffs buried by till (Crampton & Carruthers Reference Crampton and Carruthers1914; Smith et al. Reference Smith, Barlow, Bradley, Firth, Hall, Jordan and Long2018). On NW Hoy (Fig. 7a), raised beach gravels of the Muckle Head Gravel rest on a raised shore platform at 6–12m OD and are overlain by periglacial slope deposits and a thin, brown, unnamed till (Wilson et al. Reference Wilson, Edwards, Knox, Jones and Stephens1935; Sutherland Reference Sutherland, Gordon, Gordon and Sutherland1993a). From Orkney Mainland northwards a mainly brown diamicton with few far-travelled clasts is found locally (Rae Reference Rae1976). This Digger Till contains Carboniferous and Permian palynomorphs (Fig. 7a), which, taken together with the evidence of striae (Fig. 7b), indicates deposition by ice that flowed to the NW from the platform E of Orkney. The overlying Scara Taing Till (Figs 7a, 8) is a red to brown diamicton with locally high contents of marine shell fragments and a far-travelled clast component derived mainly from around the Moray Firth basin, but also including rock types typical of the Forth approaches (Carboniferous limestone and sandstone) and southern Fennoscandia (Fig. 9).
Till stratigraphy (A) and striae (B) in Caithness and Orkney (modified from Hall & Riding Reference Hall and Riding2016 and Hall et al. Reference Hall, Riding and Brown2016a). 1=unconformity or disconformity within a till unit; 2=sand or gravel layer; 3=western limit of the Forse Till derived from the inner Moray Firth in Caithness and Sutherland.

Sections of stacked tills on Orkney (modified from Hall et al. Reference Hall, Riding and Brown2016a).

Records of glacial erratics in Caithness and Orkney (modified from Hall & Riding Reference Hall and Riding2016 and Hall et al. Reference Hall, Riding and Brown2016a).

The uppermost Quendale Till (Figs 7a, 8) is a locally derived diamicton that records a final period of ice flow N and W across the low ground of the Orkney archipelago and offshore to the adjacent Atlantic shelf (Phillips et al. Reference Phillips and Merritt2008; Hall et al. Reference Hall, Riding and Brown2016a; Fig. 7b). This event may correlate with an ice sheet readvance to the Reay Ridge, a sea-bed moraine lying 10–20km W of Orkney Mainland (Bradwell & Stoker Reference Bradwell and Stoker2015). The final retreat of ice is marked by moraine systems on the Atlantic shelf, on W Rousay (Fig. 9) and central Orkney Mainland, as well as by moraines and glaciolacustrine sediments in the valleys of western Hoy (Wilson et al. Reference Wilson, Edwards, Knox, Jones and Stephens1935; Hall Reference Hall and Hall1996b; Bradwell & Stoker Reference Bradwell and Stoker2015; Hall et al. Reference Hall, Riding and Brown2016a). The pattern of retreat indicated by moraine ridges was SE across Orkney, into Scapa Flow (Fig. 9) and SSE towards the Moray Firth. This evidence clearly shows that an independent Orkney ice cap did not exist at this time (Hall et al. Reference Hall, Riding and Brown2016a). Recalibrated cosmogenic exposure ages indicate that low ground on W Mainland became ice-free by ca.16ka (Phillips et al. Reference Phillips and Merritt2008; Ballantyne & Small Reference Ballantyne and Small2018.
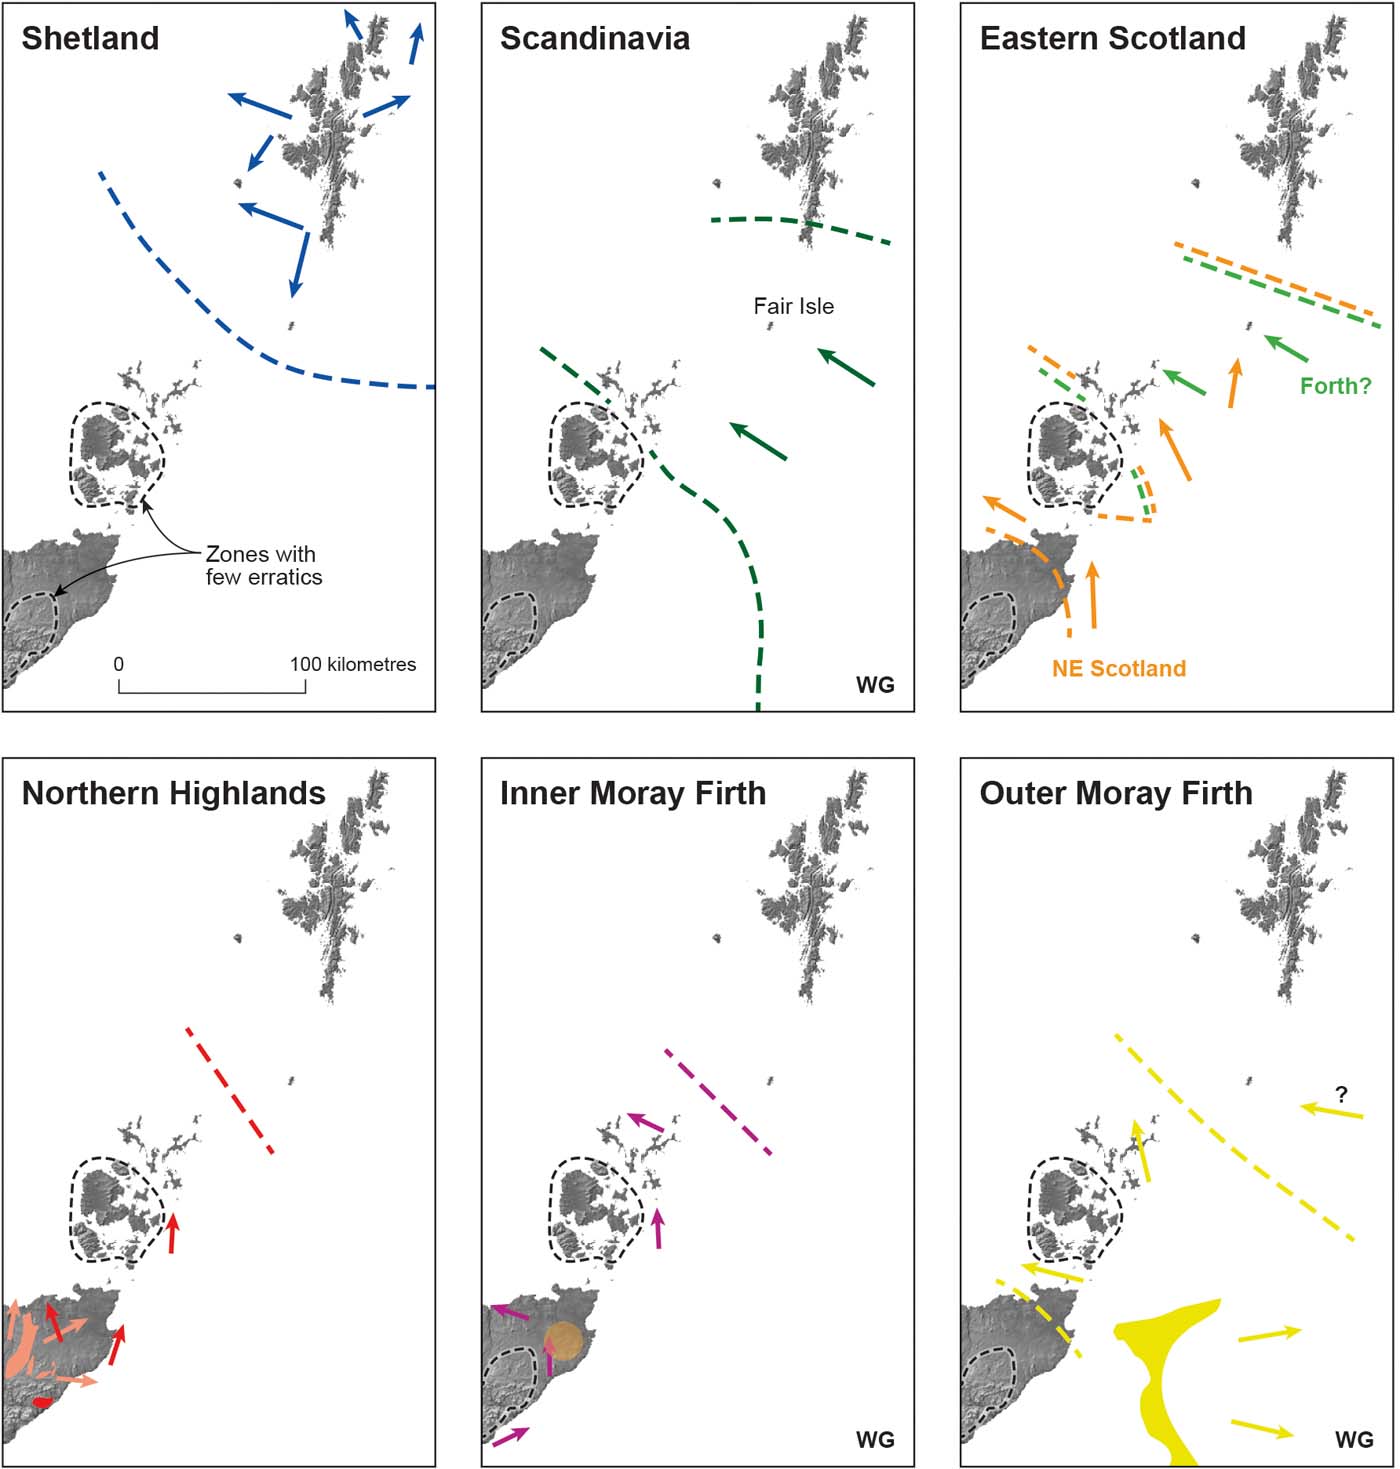
The orientations of striae (Fig. 7b) together with the origin and distribution of glacial erratics (Figs 9, 10) suggest that ice flowed across Caithness and Orkney from the S and E, out of the Moray Firth (Peach & Horne Reference Peach and Horne1880, Reference Peach and Horne1881). The ice laid down mud-rich, shelly diamictons assigned to the Banffshire Coast, Caithness and Orkney Glacigenic Subgroup (Hall & Riding Reference Hall and Riding2016; Fig. 3a). The occurrence of sparse Scandinavian erratics noted by Peach & Horne (Reference Peach and Horne1880, Reference Peach and Horne1893) on the northern isles of Orkney has been confirmed by Hall et al. (Reference Hall, Riding and Brown2016a) and on Fair Isle (Hall & Fraser Reference Hall and Fraser2014; Fig. 10). However, the palynomorph content of till matrices suggests that these indicator erratics are likely to have been reworked into Scottish tills from older sediments in the Outer Moray Firth and the Witch Ground basin of the central North Sea (Hall et al. Reference Hall, Riding and Brown2016a; Fig. 10). Hence, there is no firm evidence that the FIS flowed over northern Orkney during the last glaciation. Instead, episodic development of fast ice flow between Orkney and Shetland is likely, sourced from an ice saddle that developed across the northern North Sea at the LGM (Sejrup et al. Reference Sejrup, Clark and Hjelstuen2016). The Scandinavian erratics may also derive from one or more earlier incursions of Fennoscandian ice into the western part of the northern North Sea (Flinn Reference Flinn1978).
Domains and transport directions for glacial erratics recorded on Caithness, Orkney and Shetland. Shetland rocks (blue arrows) are confined to Shetland, including Fair Isle, and the surrounding shelf. Scandinavian erratics (dark-green arrows) occur on N Orkney, Fair Isle and at one location in southernmost Shetland. Carboniferous limestone, sandstone and volcanic clasts from the Firth of Forth and eastern Scotland (pale-green arrows) are recorded only from Fair Isle and N Orkney. Igneous and metamorphic erratics from NE Scotland (orange arrows) occur along the shores of the Pentland Firth, in N Orkney and on Fair Isle. Erratics from the Northern Highlands (red arrows) are recorded as far north as N Ronaldsay. Jurassic and Lower Cretaceous rocks and fossils from the inner Moray Firth (purple arrows) occur in Caithness (Gordon Reference Gordon, Gordon and Sutherland1993d) and N Orkney. Erratics of Late Cretaceous chalk and flint (yellow arrows and outcrop) are found N of Wick and along the Pentland Firth, locally in high concentrations, and in N Orkney. Flint is found in tills on Fair Isle, but may be derived originally from sources in the Danish sector of the North Sea. Abbreviation: WG = Witch Ground.

Recent numerical models (Hubbard et al. Reference Hubbard, Bradwell, Golledge, Hall, Patton, Sugden, Cooper and Stoker2009) and ice sheet reconstructions (Clark et al. Reference Clark, Hughes, Greenwood, Jordan and Sejrup2012a) suggest the former existence of a local ice cap on Orkney, a possibility that was rejected in earlier stratigraphic studies (Wilson et al. Reference Wilson, Edwards, Knox, Jones and Stephens1935; Rae Reference Rae1976). The very limited presence of far-travelled erratics, including marine shells, in Hoy and W Mainland and the absence or weak development of subglacial bedforms on the hills of Hoy is consistent with the build-up of a dome of cold-based ice of sufficient thickness to prevent incursion of Moray Firth ice into this part of Orkney for long periods. However, no till, striae or erratics have been reported that might relate to radial flow from an Orkney ice cap (Hall et al. Reference Hall, Riding and Brown2016a). Instead, the ice-flow indicators all point to ice flow across Orkney from an ice shed that lay to the E or SE, laying down the Quendale Till (Figs 7b, 9, 10) (see Section 5.2).
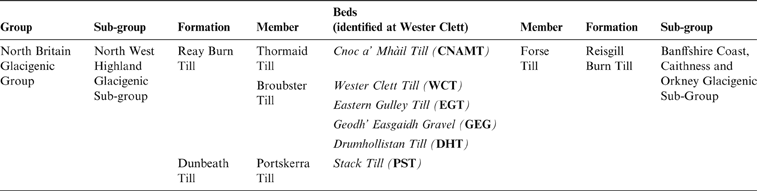
In Caithness, aside from older glacial deposits found at depth (Tait Reference Tait1912; Hall & Whittington Reference Hall and Jarvis1989; Hall et al. Reference Hall, Merritt, Connell and Hubbard2018), the oldest till units attributed to the Late Devensian are the Ballantrath Till around Dunbeath (Gordon Reference Gordon, Gordon and Sutherland1993b) and the Portskerra Till around Melvich (Hall et al. Reference Hall, Auton, Michie, Pearson and Riding2011; Fig. 7a; Table 3). The latter unit includes igneous and metamorphic clasts derived from the Sutherland–Caithness border, along with abundant Devonian sandstone and conglomerate debris, and records an early expansion of the NW Highland ice at least as far E as Watten (Omand Reference Omand1973). At Wester Clett (also known as Drum Hollistan) (Gordon Reference Gordon, Gordon and Sutherland1993c; Fig. 7a) the Portskerra Till is overlain by cryoturbated gravel and by the lowermost of three calcareous, mud-rich till units of the Reisgill Burn Till Formation (Figs 3b, 7a, 11; Table 4) derived mainly from Devonian sedimentary rocks, but including shells, fossils and palynomorphs derived from the Moray Firth (Hall et al. Reference Hall, Auton, Michie, Pearson and Riding2011). This Drumhollistan Till Bed is overlain by a fan gravel and by the Eastern Gulley Till derived from the SE; it is also overlain by the Wester Clett Till derived from the S. Late advances of inland ice deposited younger till units and formed moraines on the surface of the Reisgill Burn Till in N and W Caithness. These were probably contemporaneous with a final advance of Moray Firth ice, which deposited the Wick Till (Fig. 7a) and moraine ridges on low ground bordering the Pentland Firth. MSGLs in Caithness (Hughes et al. Reference Hughes, Clark and Jordan2010, Reference Hughes, Clark and Jordan2014) conform to the main flow paths for the glaciers that laid down the Reay Burn Till (inland ice) and Reisgill Burn Till (Moray Firth ice) (Peach & Horne Reference Peach and Horne1881; Fig. 3b), but the multiple events identified from units in both formations demonstrate that these subglacial landforms are composite products of multiple ice-flow events following similar paths (Hall & Riding Reference Hall and Riding2016; Hall et al. Reference Hall, Gilbertson, Kent and Grattan2016a).
Stratigraphy at Wester Clett, Caithness (after Hall et al. Reference Hall, Auton, Michie, Pearson and Riding2011).

The stratigraphy at Wester Clett, Caithness (from Hall et al. Reference Hall, Auton, Michie, Pearson and Riding2011). Abbreviations: CNAMT = Cnoc a' Mhàil Till; WCT = Wester Clett Till; EGT = Eastern Gulley Till; GEG = Geodh' Easgaidh Gravel; DHT = Drumhollistan Till; PST = Stack Till.

3.2.1. Correlation of events on the Atlantic–North Sea divide
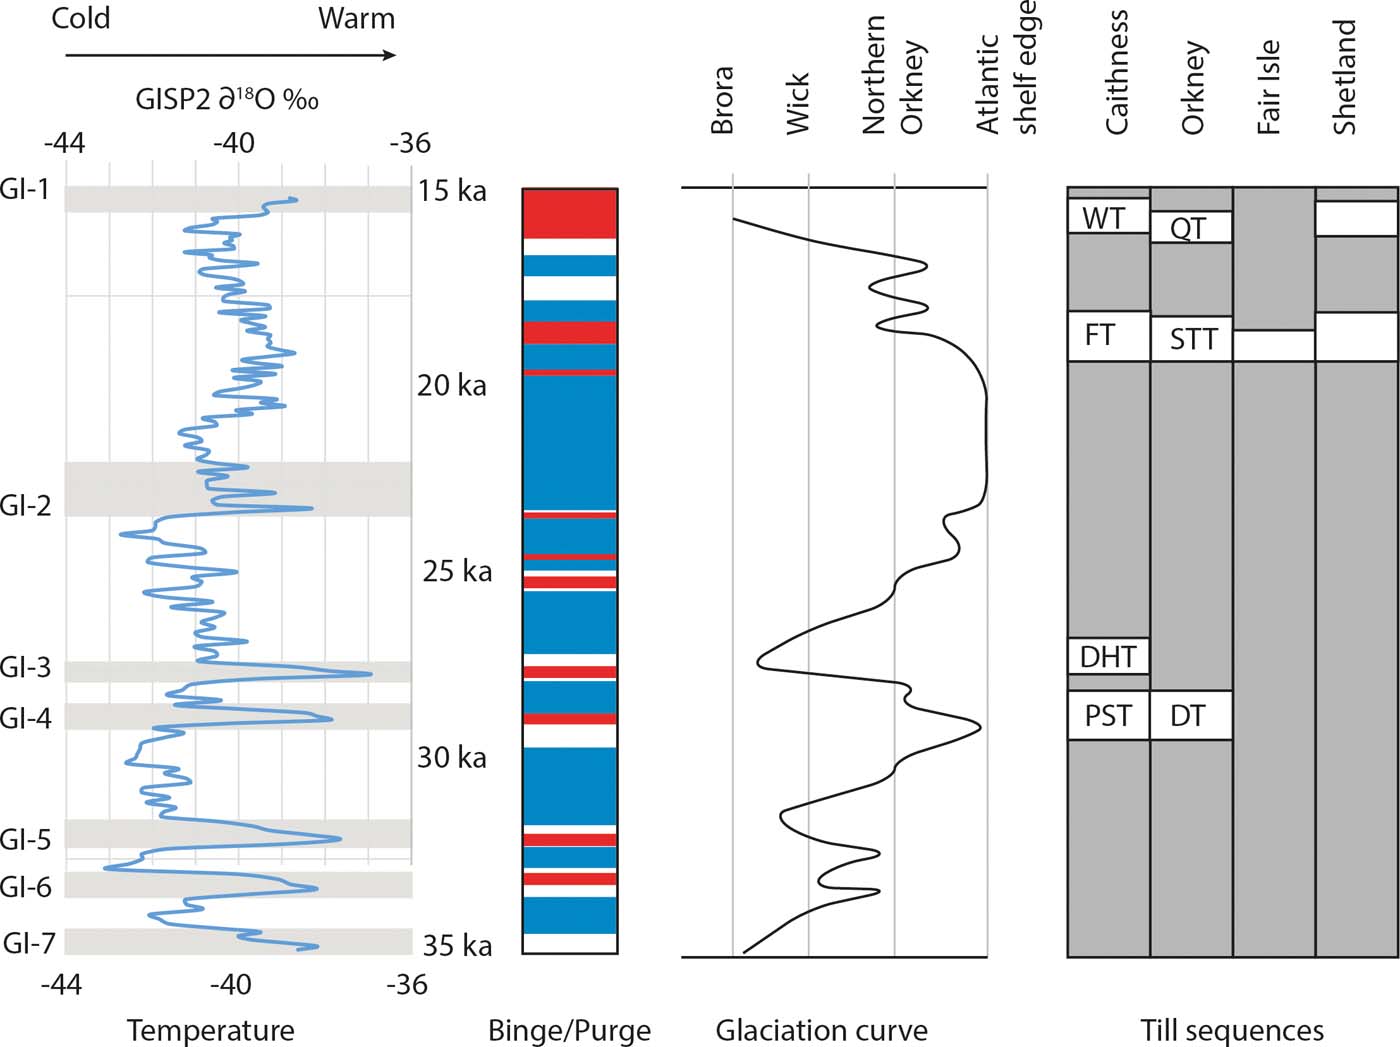
The reconstruction offered by Hall et al. (Reference Hall, Riding and Brown2016a) for the last glaciation of Caithness, Orkney and Shetland proposes ice flow both towards the Atlantic shelf edge and into the North Sea basin during three main phases, at 32–28, 24–18.5 and 17.5–16.2ka (Fig. 12). In recent years, the local LGM in northern Britain has been placed in the first of these intervals (e.g., Bradwell et al. Reference Bradwell, Stoker, Golledge, Wilson, Merritt, Long, Everest, Hestvik, Stevenson, Hubbard, Finlayson and Mathers2008a; Merritt et al. Reference Merritt, Connell and Hall2017a; Ballantyne & Small Reference Ballantyne and Small2018), yet the timing of the event elsewhere in NW Europe was generally coincident with the global LGM at 26.5ka to 19ka (Clark et al. Reference Clark, Dyke, Shakun, Carlson, Clark, Wohlfarth, Mitrovica, Hostetler and McCabe2009; Fig. 1). The FIS margin was close to its southernmost limits in Europe during the periods 24.3–23.4ka, 22.5–21.3ka and, again, 20.3–18.7ka (Toucanne et al. Reference Toucanne, Soulet, Freslon, Silva Jacinto, Dennielou, Zaragosi, Eynaud, Bourillet and Bayon2015). The FIS advanced into Denmark at 23–21ka (Houmark-Nielsen & Kjaer Reference Houmark-Nielsen and Kjaer2003). Peak IRD flux, coincident with Heinrich Event 2 at 24ka, is a feature of all records of the BIIS on its western margin (Scourse et al. Reference Scourse, Haapaniemi, Colmenero-Hidalgo, Peck, Hall, Austin, Knutz and Zahn2009). The LGM on the West Shetland shelf has also been placed at 22–19.5ka (Davison Reference Davison2004), comparable to the mid-Norwegian shelf (Dahlgren & Vorren Reference Dahlgren and Vorren2003). A late LGM is consistent with cosmogenic isotope exposure ages on deglaciation of high ground (217–530m OD) in Orkney, Caithness and Buchan, which occurred as late as 18.2±2.6ka (Ballantyne Reference Ballantyne2010).
Time frame and glaciation curve for the main events of the last ice sheet on the Atlantic–North Sea Divide. GISP2 ice core data from Stuiver & Grootes (Reference Stuiver and Grootes2000); binge-purge cycles and ice extent from Hubbard et al. (Reference Hubbard, Bradwell, Golledge, Hall, Patton, Sugden, Cooper and Stoker2009); till stratigraphy from Hall & Riding (Reference Hall and Riding2016) and Hall et al. (Reference Hall, Riding and Brown2016a). Abbreviations: DT = Dunbeath Till; DHT = Drumhollistan Till; FT = Forse Till; PST = Portskerra Till; QT = Quendale Till; STT = Scara Taing Till; WT = Wick Till.

Flow of the FIS across southern Shetland, Fair Isle and northern Orkney is also a recurrent feature of recent ice sheet reconstructions (Bradwell et al. Reference Bradwell, Stoker, Golledge, Wilson, Merritt, Long, Everest, Hestvik, Stevenson, Hubbard, Finlayson and Mathers2008a; Graham et al. Reference Graham, Lonergan and Stoker2010; Sejrup et al. Reference Sejrup, Clark and Hjelstuen2016). This interpretation mainly derives from: (i) a supposed connection between westward ice flow across northern Orkney and NW flow indicated by MGSLs in the Witch Ground basin; and (ii) the presence of Scandinavian erratics on northern Orkney and, probably, Fair Isle. Neither criterion, however, is secure. MGSLs are developed across the Coal Pit Formation and overlain by the Swatchway Formation; both sedimentary units include chalk debris (Graham et al. Reference Graham, Lonergan and Stoker2009; Davies et al. Reference Davies, Roberts, Bridgland, Ó Cofaigh and Riding2011), implying that erosion of the MGSLs was bracketed by phases of ice flow that crossed the chalk outcrop in the outer Moray Firth. The FIS also appears to have remained largely confined to the Norwegian sector of the North Sea basin during the last glaciation, heavily influenced by the Norwegian Trough (Sejrup et al. Reference Sejrup, Nygard, Hall and Haflidason2009). The extension of an ice stream from the SW flank of the Norwegian Channel to the North Atlantic shelf edge (Bradwell et al. Reference Bradwell, Stoker, Golledge, Wilson, Merritt, Long, Everest, Hestvik, Stevenson, Hubbard, Finlayson and Mathers2008a) is glaciologically implausible because the ice surface slope necessary to drive ice flow to the shelf edge gives an ice surface elevation offshore from southern Norway that is incompatible with the proximity of the southern LGM limit in Denmark (Phillips et al. Reference Phillips, Hodgson and Emery2017, fig. 3). As originally recognised by Graham et al. (Reference Graham, Lonergan and Stoker2007), the MGSLs were probably cut by ice flowing to the SE out of the Moray Firth.
On northern Orkney, the very low concentrations of Scandinavian erratics are accompanied by larger numbers of erratics of Scottish origin in the Scara Taing Till (Hall et al. Reference Hall, Riding and Brown2016a; Fig. 8). Palynomorphs indicate that this till is of Scottish origin, deposited by ice passing through the Moray Firth (Peach & Horne Reference Peach and Horne1880). Hence, it is likely that the Scandinavian erratics are reworked and part of complex patterns of erratic distribution on the Atlantic–North Sea divide (Fig. 10).
3.3. Outer Hebrides
The presence of erratics from the mainland in the Outer Hebrides indicates that at least parts of the archipelago were over-run by ice from the E during the last glaciation (Geikie Reference Geikie1873, Reference Geikie1878; Sissons Reference Sissons1980). For example, clasts of Torridonian sandstone, Cambrian quartzite and also sedimentary rocks derived from the floors of The Minch and the Sea of the Hebrides basins are found on the S and W coasts of South Uist (Jehu & Craig Reference Jehu and Craig1925), along the Sound of Harris and on the Flannan Isles (Stewart Reference Stewart1933; Fig. 13). On NW Lewis, mainland erratics are abundant in deposits derived from The Minch (Baden-Powell Reference Baden-Powell1938; von Weymarn Reference von Weymarn1979; Gordon Reference Gordon, Gordon and Sutherland1993j). However, the presence of mainland erratics in a till that locally underlies the Ipswichian raised ‘Galson Beach' on NW Lewis (Peacock Reference Peacock1984; Fig. 14) indicates that this part of Lewis was over-run during an earlier glaciation (Hall et al. Reference Hall, Merritt, Connell and Hubbard2018).
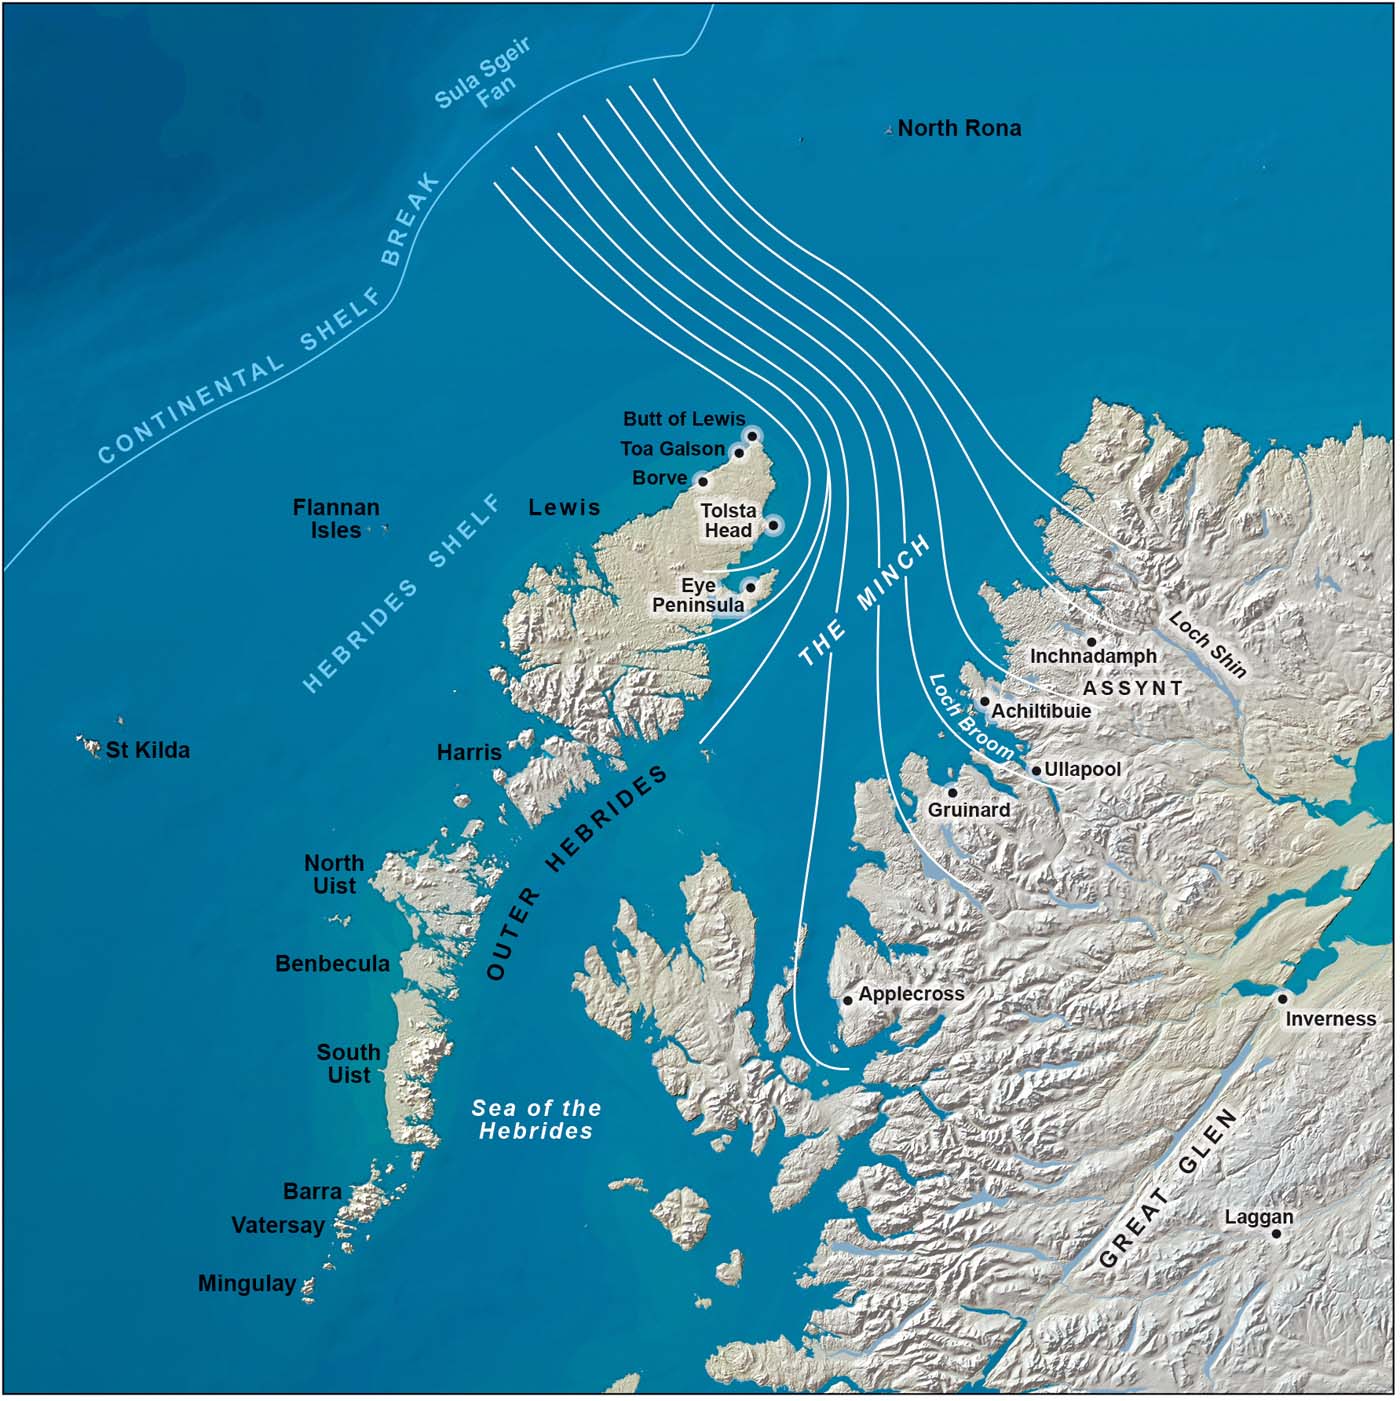
Physiography of the NW Highlands and Outer Hebrides showing the position of the former Minch Ice Stream (modified after Bradwell & Stoker Reference Bradwell and Stoker2015). Hill-shaded surface model built from Intermap Technologies NEXTMap Britain elevation data.

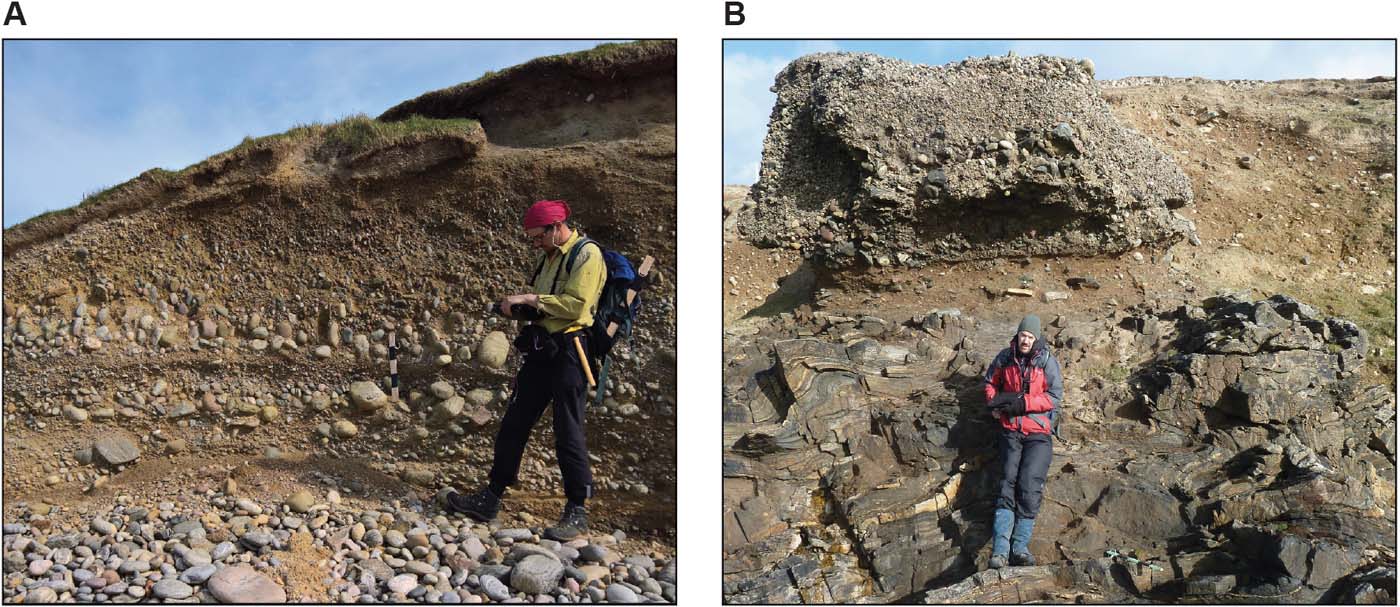
The Galson Raised Beach on NW Lewis. (A) South Galson. Undisturbed storm beach gravel of likely MIS 5e age at ∼5m OD, overlain by cryoturbated gravel with erect clasts and layers of gravel-rich diamicton (Lewis Till) deposited by local ice. (B) Eoropie. A small raft of Galson Raised Beach gravel within brown mud-rich diamicton (Port Beag Till) deposited by the Minch Ice Stream.

Local Outer Hebridean erratics, striae and glacial lineations indicate that an independent ice cap developed over the Outer Hebrides during the LGM. The ice cap had divides located close to the W coast of the Uists, across the mountains of Harris and S Lewis and extending N towards the Butt of Lewis (von Weymarn Reference von Weymarn1979; Peacock Reference Peacock1984; Hall Reference Hall, Gilbertson, Kent and Grattan1996a). Indeed, computer modelling of the last ice sheet suggests that independent ice masses developed on northern Lewis, the mountains of Harris and, later, the Uists, and subsequently coalesced (Hubbard et al. Reference Hubbard, Bradwell, Golledge, Hall, Patton, Sugden, Cooper and Stoker2009). Ice streams developed in the Sounds of Harris and Barra, discharging ice from The Minch and the Sea of the Hebrides onto the North Atlantic shelf (Fig. 13).
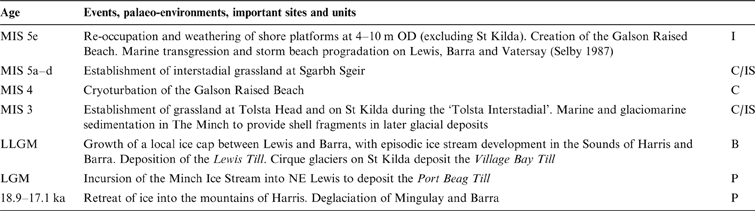
The ‘Galson Raised Beach' and its underlying raised shore platform at 4–10m OD provides a valuable stratigraphic marker (Hall Reference Hall, Gilbertson, Kent and Grattan1996a; Table 5). The raised beach rests on organic deposits at Toa Galson (Gordon Reference Gordon, Gordon and Sutherland1993i) (here renamed based on its location as Sgarbh Sgeir), which, in turn, rests on weathered till and rock (Sutherland & Walker Reference Sutherland and Walker1984). The beach gravel is cryoturbated N of Borve (Fig. 14), perhaps in more than one periglacial episode, and overlain by a single till unit derived from inland (Lewis Till Formation of Fig. 3b) (Hall Reference Hall and Jarvis1995). The Galson raised beach has escaped glacial erosion beneath cold-based ice cover on NW Lewis (Hall Reference Hall and Jarvis1995). To the N, on both coasts of the Butt of Lewis, the Galson Beach is overlain by a distinctive, interbedded sequence of glacigenic and water-lain sediments (Baden-Powell Reference Baden-Powell1938; Gordon Reference Gordon, Gordon and Sutherland1993i). These deposits, assigned to the Port Beag Till Formation were deposited by the Minch Palaeo Ice Stream (MPIS) crossing the northern tip of the island (Bradwell & Stoker Reference Bradwell and Stoker2015; Fig. 13). The SW boundary of this formation (Fig. 3b) is marked by a large ridge, either a marginal moraine (Sutherland & Walker Reference Sutherland and Walker1984) or a wedge of sediment that accreted below a former shear margin within the ice sheet that separated warm-based, fast-flowing ice from sluggish cold-based ice (Bradwell & Stoker Reference Bradwell and Stoker2015). Radiocarbon dates from marine shells in the sequence have yielded ages of 34.4–39.5 cal 14C ka, which, if correct, imply episodic establishment of ice-free conditions in The Minch during the latter part of the Middle Devensian and a constraining maximum date for the ice advance that deposited these sediments (Sutherland & Walker Reference Sutherland and Walker1984; Small et al. Reference Small, Benetti, Dove, Ballantyne, Fabel, Clark, Gheorghiu, Newall and Xu2017).
Summary of events in the Outer Hebrides. Abbreviations: B=glacial ‘binge'; C=cold-periglacial; I=Interglacial; IS=Interstadial; P=glacial ‘purge'.

Stronger evidence for ice-free conditions prior to the last glaciation has been obtained from the northern side of Tolsta Head (von Weymarn & Edwards Reference von Weymarn and Edwards1973; Birnie Reference Birnie1983; Gordon & Sutherland Reference Gordon, Sutherland, Gordon and Sutherland1993b; Whittington & Hall Reference Whittington and Hall2002; Figs 13, 15). The organic sediments preserved at Tolsta Head have been dated to 38–32 cal 14C ka and contain an important record of dominantly open grassland vegetation during the ‘Tolsta Interstadial' of MIS 3 (Whittington & Hall Reference Whittington and Hall2002; Table 4). Variations in palaeotemperature inferred from the pollen assemblages and sedimentology are provisionally matched by these authors with GI-8 to GI-5 (Fig. 2). The overlying Port Beag Till is a brown, matrix-supported, silty, sandy diamicton, with crude sub-horizontal structure. Clasts are predominantly Lewisian gneiss, but include hard, siliceous brown sandstones probably derived from the Torridonian inlier on the Shiant East Bank Ridge (von Weymarn & Edwards Reference von Weymarn and Edwards1973; Whittington & Hall Reference Whittington and Hall2002) that lies some 40km SE of Tolsta Head (Chesher et al. Reference Chesher, Smythe and Bishop1983). Von Weymarn & Edwards (Reference von Weymarn and Edwards1973) reported that the till fabric showed a dominant NW clast orientation that corroborates deposition by ice flowing from the SE, but striae inland of Tolsta Head trend E–W (Peacock Reference Peacock1981). The till was probably deposited within a zone of shifting ice flow where local Lewis ice bordered the western flank of the MPIS, which laid down a thick sequence of glacially overridden and tectonised diamictons, sands and gravels, with fragmented marine shells (Bradwell & Stoker Reference Bradwell and Stoker2015). Broadly equivalent deposits occur on the Eye Peninsula (Sutherland & Walker Reference Sutherland and Walker1984; Fig. 13).
Generalised stratigraphy at Tolsta Head on NW Lewis (modified from Gordon & Sutherland Reference Gordon, Sutherland, Gordon and Sutherland1993b).

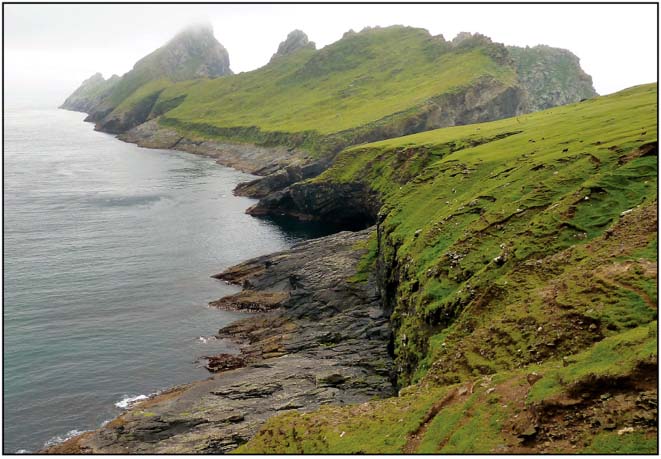
The outlying islands of St Kilda (Figs 13, 16) occupy a key location for understanding the extent of the last ice sheet on the Hebridean shelf (Sutherland et al. Reference Sutherland, Ballantyne and Walker1982). Earlier work on Hirta identified an older, weathered diamict, the Ruaival ‘Drift', assigned to a phase of local glaciation before the Late Devensian, and a younger till, the Village Bay Till, deposited by cirque glaciers on Hirta during the Late Devensian (Sutherland et al. Reference Sutherland, Ballantyne and Walker1984). The Abhainn Ruaival organic bed, radiocarbon-dated to 24.7ka BP (SRR-1809b), occurs beneath the Ruaival Head, one of two units of periglacial slope deposit seen to lie between the two tills. The palynology of the organic bed indicates the establishment of a species-poor grassland with virtually no shrub cover under interstadial conditions (Sutherland et al. Reference Sutherland, Ballantyne and Walker1984; Walker Reference Walker1984). The bed is tentatively assigned to the ‘Tolsta Interstadial' (Hiemstra et al. Reference Hiemstra, Shakesby and Vieli2015), but the pollen record differs from that for the same interval at Tolsta Head, on Lewis, where Fagus and Picea are absent (Whittington & Hall Reference Whittington and Hall2002). Hiemstra et al. (Reference Hiemstra, Shakesby and Vieli2015) suggest returning to the earlier, simplified interpretation of the stratigraphy on Hirta (Wager Reference Wager1953), challenging whether the Ruaival Drift is a glacial deposit.
Hirta, St Kilda, looking SW to Dùn, showing tor landforms mantled by thick periglacial slope deposits.

Small erratic clasts of red sandstone and heavy minerals derived from Lewisian gneisses occur in the oldest till units recorded on St Kilda (Sutherland et al. Reference Sutherland, Ballantyne and Walker1984). The source of the sandstone is probably the Flannan Trough, lying 35–50km to the E, which is floored by red-brown Permo-Triassic sandstone (Stoker et al. Reference Stoker, Hitchen and Graham1993). The heavy minerals are likely derived from the extensive submarine platform formed by Lewisian rocks E of St Kilda (Stoker et al. Reference Stoker, Hitchen and Graham1993). The last ice sheet glaciation of St Kilda probably occurred before MIS 5e (Sutherland et al. Reference Sutherland, Ballantyne and Walker1984; Hiemstra et al. Reference Hiemstra, Shakesby and Vieli2015), consistent with the presence of large tors and pinnacles on ridges down to <100m OD on Hirta (Fig. 16). Any more recent passage of fast-moving, erosive ice should have been capable of removing or modifying these fragile landforms. Recently acquired cosmogenic isotope ages support the conclusion that St Kilda supported only locally sourced glaciers during the LGM (Ballantyne et al. Reference Ballantyne, Fabel, Gheorghiu, Rodés, Shanks and Xu2017). However, this interpretation contradicts the view that the last ice sheet terminated to the W of the archipelago at, or near, the Atlantic shelf edge (Bradwell et al. Reference Bradwell, Stoker, Golledge, Wilson, Merritt, Long, Everest, Hestvik, Stevenson, Hubbard, Finlayson and Mathers2008a; Chiverrell & Thomas Reference Chiverrell and Thomas2010; Gibbard & Clark Reference Gibbard, Clark, Gibbard and Hughes2011; Clark et al. Reference Clark, Hughes, Greenwood, Jordan and Sejrup2012a, Reference Clark, Ely, Greenwood, Hughes, Meehan, Barr, Bateman, Bradwell, Doole, Evans, Jordan, Monteys, Pellicer and Sheehyb).
4. Core areas
Considerable research has been undertaken in the NW and Central Highlands since the review by Sutherland (Reference Sutherland, Gordon, Gordon and Sutherland1993b). Both regions were centres of ice accumulation beneath which older deposits have been preserved locally due to relatively little subglacial erosion.
4.1. NW Highlands
The ice that flowed from an ice divide situated over the NW Highlands deposited tills, outwash and glaciolacustrine deposits assigned to the North-west Highlands Glacigenic Subgroup (Auton Reference Auton2003; Bradwell Reference Bradwell2003; McMillan et al. Reference McMillan, Hamblin and Merritt2011a; Fig. 3a).
Three formations have been recognised to the W of the main N–S watershed following recent onshore and offshore mapping (Bradwell Reference Bradwell2003, 2010a; Stoker et al. Reference Stoker, Hitchen and Graham2009; Bradwell & Stoker Reference Bradwell, Stoker, Lukas and Bradwell2010), namely the Loch Broom Till, Assynt Glacigenic and Ullapool Gravel formations. To the E of the watershed, in eastern Sutherland and Caithness, the Reay Burn Till and Dunbeath Till formations also form part of the subgroup (Auton Reference Auton2003) (Section 3.2; Fig. 3b). The Loch Broom Till has been mapped alongside, and beneath, Loch Broom and Gruinard Bay, and is interpreted as a subglacial traction till that was deposited by the MPIS (Fig. 13). The till has a streamlined surface morphology with lineations trending NW.
The Assynt Glacigenic Formation comprises clast-rich to clast-supported diamictons interbedded with sands and gravels. It is distributed discontinuously to the W of the main watershed, extending offshore, and includes well-developed, nested moraine ridges (Stoker et al. Reference Stoker, Bradwell, Howe, Wilkinson and McIntyre2009; Bradwell & Stoker Reference Bradwell, Stoker, Lukas and Bradwell2010). Several geographically distinct members have been recognised associated with late-stage glacier oscillations, namely the Allt na h-Airbhe Member (predominantly offshore), and the Allt an t-Srathain, Rhiroy and Glen Douchary members. The last of these occurs within the ice limits correlated with the Loch Lomond Stadial in the region (Ballantyne Reference Ballantyne and Small2018). The Ullapool Gravel Formation includes glaciofluvial fan, deltaic and outwash deposits that formed during high relative sea levels (RSLs) around Ullapool, along margins of Loch Broom and adjoining sea lochs, and locally along the coast of the NW Highlands (Stoker et al. Reference Stoker, Bradwell, Howe, Wilkinson and McIntyre2009; Bradwell Reference Bradwell, Lukas and Bradwell2010b). It is assigned to the Windermere Interstadial.
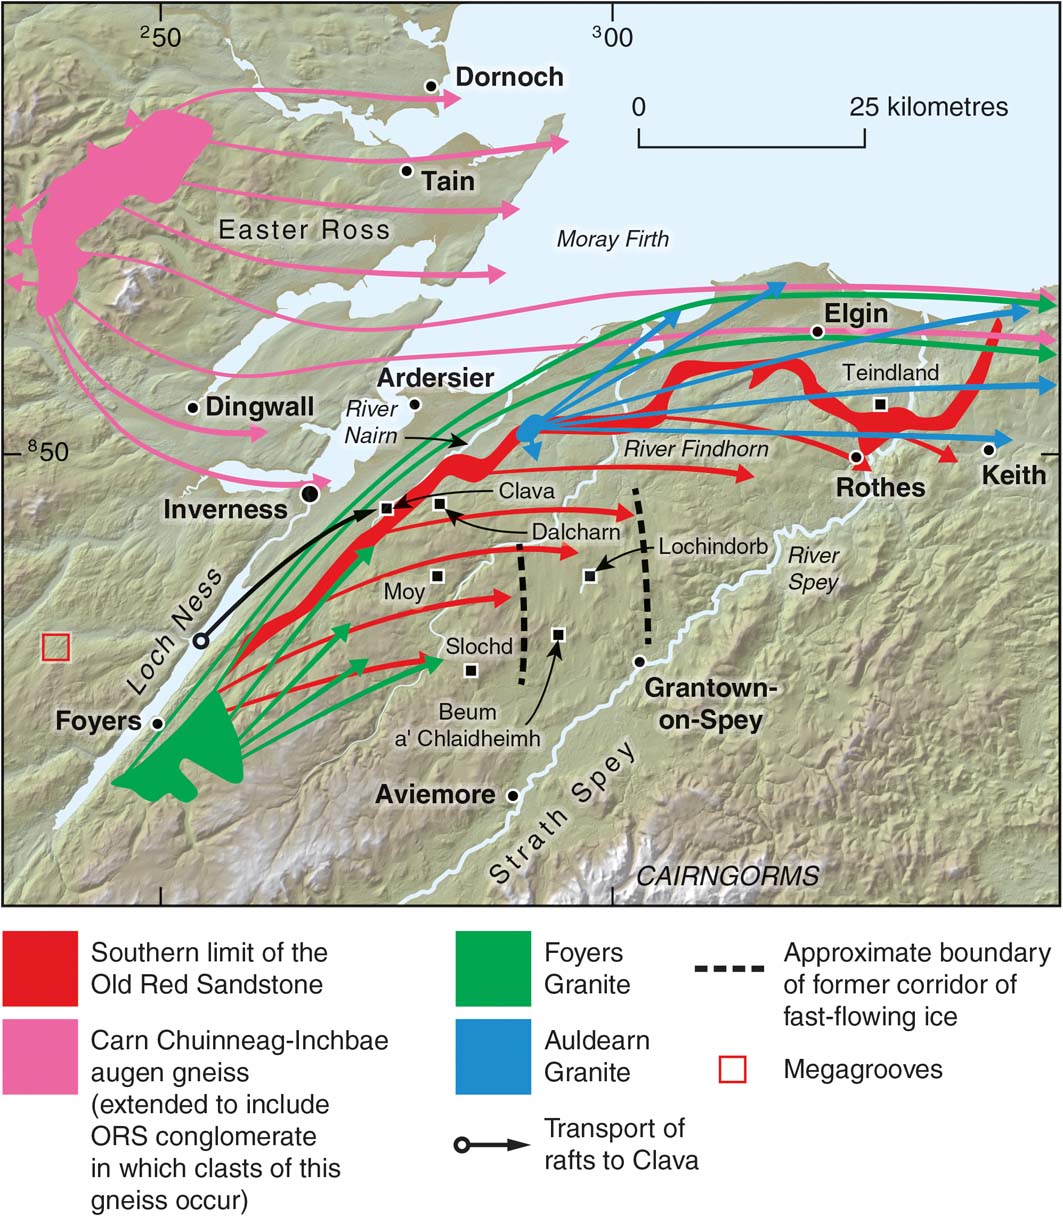
The tills of the NW Highlands typically contain clasts derived from local crystalline metamorphic and igneous rocks, Cambrian quartzites and Torridonian sandstones, but observations on the dispersal of sparse indicator erratics are revealing. For example, Cambrian Pipe Rock is found from NW Lewis to Hoy and into Moray, indicating that the ice shed once straddled the outcrop of this distinctive rock type in Assynt (Sutherland Reference Sutherland1984; Fig. 13). The location of the ice shed is also suggested by the general distribution of erratics of ‘Carn Chuinneag-Inchbae augen gneiss' (Fig. 17), which are found across Easter Ross and from Elgin eastwards towards Buchan (Sissons Reference Sissons1967a; Peacock Reference Peacock1970). However, these distinctive erratics also occur along Loch Broom, implying that the ice shed once lay E of the outcrop of the gneiss in Easter Ross, requiring a very different ice sheet configuration. Interestingly, in the ice sheet model of Hubbard et al. (Reference Hubbard, Bradwell, Golledge, Hall, Patton, Sugden, Cooper and Stoker2009) the ice shed is located over the coastal hills of Sutherland and Easter Ross for a time during the last glaciation, at 29.4ka.
Transport paths of some indicator erratics across the inner Moray Firth (after Mackie Reference Mackie1905; Sissons Reference Sissons1967a; Fletcher et al. Reference Fletcher, Auton, Highton, Merritt, Robertson and Rollin1996; Merritt et al. Reference Merritt, Connell and Hall2017a). Hill-shaded surface model built from Intermap Technologies NEXTMap Britain elevation data.
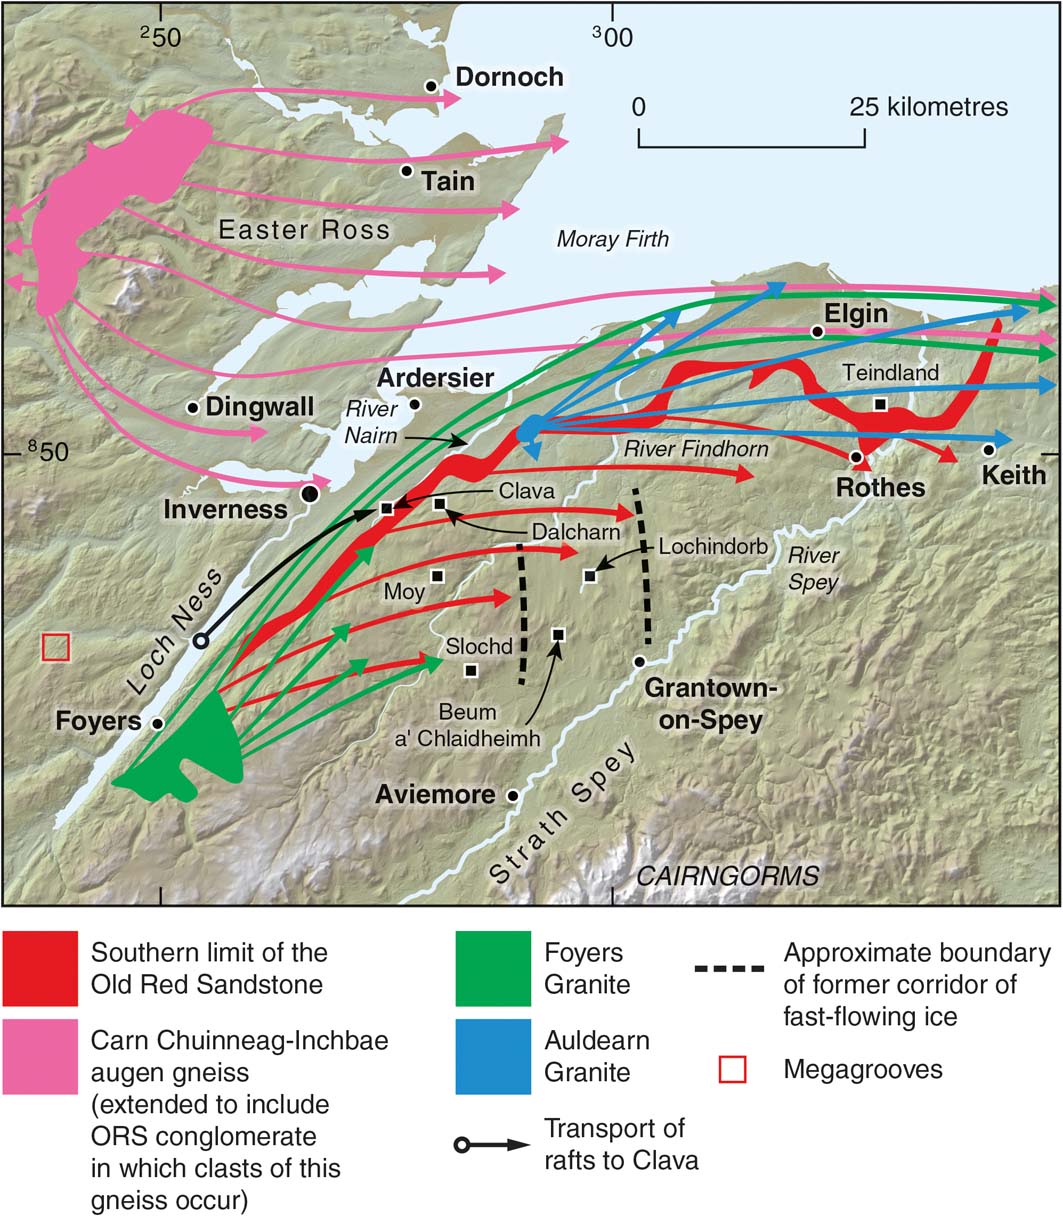
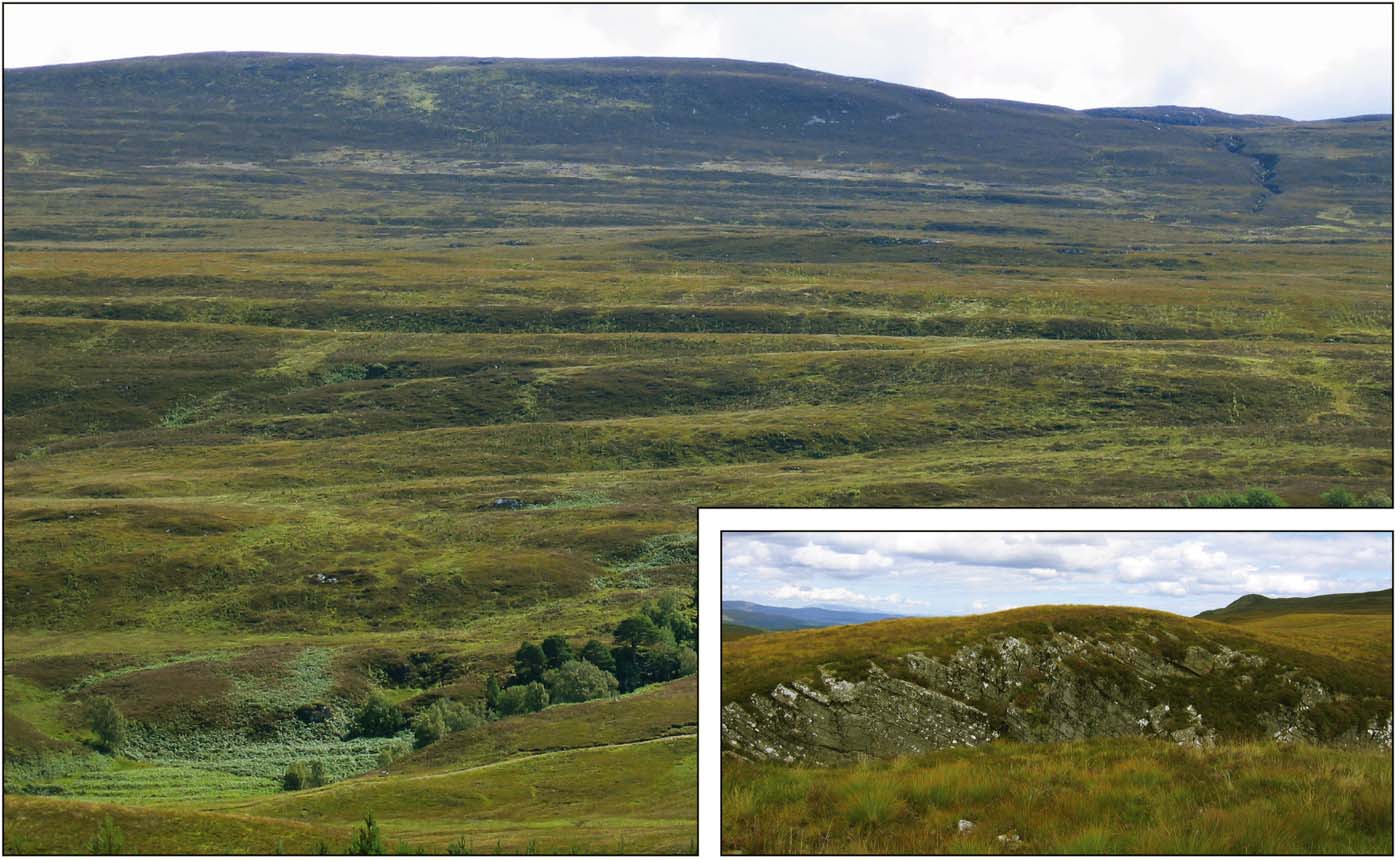
The significance of the region as an ice dispersal area has been enhanced by the recognition of the MPIS, which was fed by a number of tributaries sourced in the mountains of Kintail, Wester Ross, Assynt and Sutherland (Stoker & Bradwell Reference Stoker and Bradwell2005; Bradwell et al. Reference Bradwell, Stoker and Larter2007; Fig. 13). Geomorphological mapping based on NEXTMap imagery has elucidated the role of glaciation in shaping the landscape (Lukas & Bradwell Reference Lukas, Lukas and Bradwell2010). For example, multiple cycles of glacial erosion during the Pleistocene have removed pre-existing regolith and decomposed bedrock along the western fringe to form extensive ice-scoured ‘cnoc-and-lochain' topography (Sissons Reference Sissons1967a; Krabbendam & Bradwell Reference Krabbendam and Bradwell2014). Most notably, smooth, sub-parallel linear furrows and flutes in bedrock have been identified as ‘megagrooves' (cf. Goldthwaite Reference Goldthwaite1979; Bradwell Reference Bradwell2005; Bradwell et al. Reference Bradwell, Stoker and Larter2007, Reference Bradwell, Stoker and Krabbendam2008b; Krabbendam et al. Reference Krabbendam, Eyles, Putkinen, Bradwell and Arbelaez-Moreno2016). Another swathe of megagrooves, whalebacks and rock drumlins has been identified to the E of the former regional ice divide in the valley of the River Endrick (Figs 17, 18), N of the Great Glen (BGS 2012). These features are likely to be the legacy of a former topographically unconstrained ice stream within the last ice sheet that flowed NE towards the Moray Firth basin (Merritt et al. Reference Merritt, Auton, Boston, Everest, Merritt, Boston, Lukas and Merritt2013; Hughes et al. Reference Hughes, Clark and Jordan2014).
Megagrooves on the western flank of Suidhe Ghuirmain in the Endrick valley, N of the Great Glen, looking SE. Inset: rock drumlin associated with the megagrooves. Ice flowed towards the Moray Firth, to the NE (left). See Figure 17 for location.

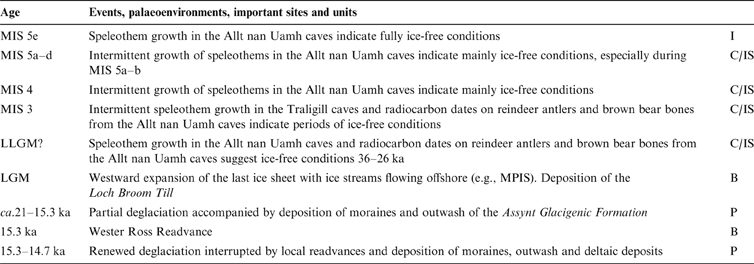
The caves of the Allt nan Uamh and Traligill valleys in Assynt, including the so-called ‘Bone Caves' of Inchnadamph (Fig. 13), provide critical evidence for Quaternary landscape evolution and chronology in the region (Hebdon et al. Reference Hebdon, Atkinson, Lawson and Young1997; Table 6). Further investigations since the review by Lawson (Reference Lawson, Gordon and Sutherland1993) have provided new information on the cave sediments, faunal remains and chronology (Lawson Reference Lawson and Lawson1995a, Reference Lawsonb, Reference Lawson, Lukas and Bradwell2010; Lawson & Atkinson Reference Lawson, Atkinson and Lawson1995; Kitchener & Bonsall Reference Kitchener and Bonsall1997; Lawson et al. Reference Lawson, Young, Kitchener and Birch2014). Uranium disequilibrium series dates on speleothems indicate ice-free conditions during the last (MIS 5e) interglacial, between 95 and 56 ka, at c. 38 ka and between 30 and 26 ka (Lawson Reference Lawson and Lawson1995a; Lawson & Atkinson Reference Lawson, Atkinson and Lawson1995). Radiocarbon dates on faunal remains (reindeer and brown bear) also imply that at least parts of the area were ice-free between ∼50 and ∼47 cal 14C ka BP and between ∼36 and ∼26 cal 14C ka BP (Lawson Reference Lawson, Lukas and Bradwell2010; Lawson et al. Reference Lawson, Young, Kitchener and Birch2014). Contrary to other evidence (Section 2), these dates appear to preclude extensive glaciation in the NW Highlands during the Early Devensian (particularly during MIS 5b and 5a where there is a cluster of dates) and conflict with interpretations of early build-up of the last ice sheet and its maximum extent on the Atlantic Shelf between ∼30 and 27ka (Bradwell et al. Reference Bradwell, Stoker, Golledge, Wilson, Merritt, Long, Everest, Hestvik, Stevenson, Hubbard, Finlayson and Mathers2008a; Ballantyne & Small Reference Ballantyne and Small2018).
Summary of events in the NW Highlands. Abbreviations: B=glacial ‘binge'; C=cold-periglacial; I=Interglacial; IS=Interstadial; P=glacial ‘purge'.

During deglaciation, the ‘Wester Ross Readvance' produced a series of end and lateral moraines between Applecross and Achiltibuie (Ballantyne et al. Reference Ballantyne, Schnabel and Xu2009a; Ballantyne & Small Reference Ballantyne and Small2018; Fig. 13). Recalibration of earlier terrestrial cosmogenic nuclide age estimates places this event at 15.3±0.7ka at the beginning of the Last Glacial–Interglacial Transition (Ballantyne & Small Reference Ballantyne and Small2018). On the E side of the ice divide, an oscillation of the ice sheet margin is indicated by a currently undated moraine system alongside Loch Shin (Lukas Reference Lukas, Lukas and Bradwell2010; Fig. 13).
4.2. Central Highlands
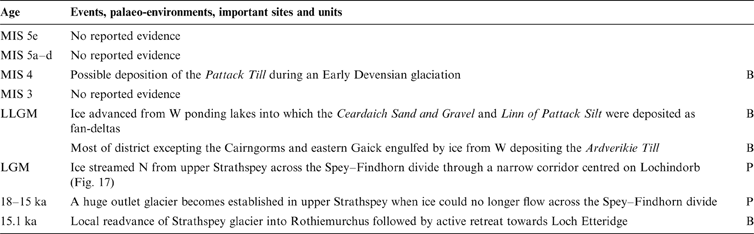
The Pleistocene deposits in upper Strathspey (Fig. 17), the middle reaches of the Findhorn and to the W of the Pass of Drumochter have been assigned to the Central Highland Glacigenic Subgroup (Fig. 3a). The eastern boundary of this subgroup divides those areas affected by ice flowing from the main N–S ice divide of the last ice sheet, situated over the western Highlands, from mountains affected by locally sourced ice, notably the Cairngorms and Gaick (British Geological Survey 2008a, b, 2013; Fig. 3a). The oldest known glacigenic unit in the sequence is the Pattack Till, which most probably antedates the last interglacial (MIS 5e) judging by its weathered condition (Hall et al. Reference Hall, Merritt, Connell and Hubbard2018; Table 7). It is locally overlain by the Ceardaich Sand and Gravel, which was deposited as glaciofluvial outwash during an early stage of the last glaciation when ice advanced eastwards up reverse-draining valleys (Merritt Reference Merritt1999; British Geological Survey 2002). Deltaic glaciofluvial sequences locally grade downwards into laminated clay and silt with sparse lonestone pebbles (Linn of Pattack Silt). Similar sequences occur to the S of the Gaick plateau, where sections displaying till-capped fine-grained sediments correlated with the Linn of Pattack Silt Formation indicate that ice first blocked the lower reaches of southward draining valleys, causing ponding, before it overrode the deposits from the W and impinged against the plateau (Merritt Reference Merritt, Lukas, Merritt and Mitchell2004a). No evidence for an early expansion of ice from the Gaick has been reported, but granite-rich till derived from the Cairngorms is locally overlain by psammite (metasandstone)-rich till derived from the W, recording an early expansion of Cairngorm ice (Barrow et al. Reference Barrow, Hinxman and Cunningham Craig1913; British Geological Survey 2013).
Summary of events in the Central Highlands. Abbreviations: B=glacial ‘binge'; P=glacial ‘purge'.

The laminated deposits of the Linn of Pattack Silt Formation typically have been deformed into glacitectonite (sensu Benn & Evans Reference Benn and Evans2010) at the base of the overlying Ardverikie Till (Merritt Reference Merritt1999). The latter includes most surficial tills in the region and is typically a stony diamicton with boulders of grey porphyritic granodiorite from the Rannoch area in addition to locally sourced psammitic rock types (Fig. 3b; McMillan et al. Reference McMillan, Hamblin and Merritt2011a). The Ardverikie Till extends N across the Spey–Findhorn catchment divide where it commonly overlies very sandy diamicton of the Inverness Glacigenic Subgroup (Horne & Hinxman Reference Horne and Hinxman1914; Fig. 3b). The Ardverikie Till is correlated with the Beinn an Uain Till at the Dalcharn and Moy sites E of Inverness (Figs 3b, 17; Section 5.1).
Northward flow of ice across the Spey–Findhorn divide is indicated by streamlined subglacial bedforms (Hughes et al. Reference Hughes, Clark and Jordan2014), the orientation of glacial striae, the clast-composition of the surficial till units (Fletcher et al. Reference Fletcher, Auton, Highton, Merritt, Robertson and Rollin1996) and the dispersal of erratics of Cairngorm Granite towards Lochindorb (Sutherland Reference Sutherland1984). The northward flow was concentrated within a narrow corridor of strongly glacially modified terrain centred on Lochindorb, whereas the landscape to either side, and particularly to the E, appears to have experienced relatively little cumulative glacial modification (Merritt et al. Reference Merritt, Auton, Boston, Everest, Merritt, Boston, Lukas and Merritt2013, Reference Merritt, Auton, Firth, Merritt, Auton and Phillips2017b; Hughes et al. Reference Hughes, Clark and Jordan2014; Fig. 17). Evidence for strong northward flow towards the corridor includes clusters of large-scale (‘mega') crag-and-tail features in the lower Dulnain valley, W of Grantown-on-Spey (Young Reference Young1977b; British Geological Survey 2013) and mega-scale rôches moutonnées (Creagan a' Choin and Ordan Shios), 25km SW of Aviemore (British Geological Survey 2008b; Merritt et al. Reference Merritt, Auton, Boston, Everest, Merritt, Boston, Lukas and Merritt2013; Merritt Reference Merritt, Auton, Firth, Merritt, Auton and Phillips2017a).
The absence of far-travelled erratics within the Cairngorms and eastern Gaick indicates that local ice caps had developed there before the district became overwhelmed by ice sourced from the W (Bremner Reference Bremner1929; Sugden Reference Sugden1970; Gordon Reference Gordon, Gordon and Sutherland1993h). The Cairngorms were entirely buried beneath ice, based on evidence of lee-side joint-block removal, glacially transported tor blocks and stripping of blockfields at elevations of up to 1200m (Hall & Glasser Reference Hall and Glasser2003; Phillips et al. Reference Phillips, Hall, Mottram, Fifield and Sugden2006). Ice flowed against the Cairngorm massif, where it was deflected by local cold-based ice (Sugden Reference Sugden1968; Hall & Sugden Reference Hall and Sugden1987; Sutherland Reference Sutherland, Gordon and Sutherland1993e), but probably penetrated eastwards into the catchment of the River Dee (Barrow et al. Reference Barrow, Hinxman and Cunningham Craig1913; Merritt et al. Reference Merritt, Lukas, Mitchell, Lukas, Merritt and Mitchell2004; Merritt Reference Merritt, Lukas, Merritt and Mitchell2004b). Cairngorm ice apparently re-occupied the uppermost catchment of the Dee during deglaciation following the retreat of ice sourced from the W (Merritt Reference Merritt, Lukas, Merritt and Mitchell2004b, fig. 24).
A topographically constrained corridor of relatively fast-flowing ice (ice stream) centred on upper Strathspey probably operated late in the LGM at the time when ice was flowing northwards across the Spey–Findhorn divide, via the narrow ‘Beum a' Chlaidheimh Breach' and Lochindorb (Merritt et al. Reference Merritt, Connell and Hall2017a, Reference Merritt, Auton, Firth, Merritt, Auton and Phillipsb; Fig. 17). Considering the elevation of the breach at 360m, ice is likely to have stopped flowing across the divide soon after deglaciation of the Cairngorm tops, which commenced at ca. 21.3ka (Phillips et al. Reference Phillips, Hall, Mottram, Fifield and Sugden2006; Table 7). A recalibrated mean cosmogenic age of 18.2ka (Ballantyne et al. Reference Ballantyne, Schnabel and Xu2009b; Ballantyne & Small Reference Ballantyne and Small2018) for rockslide debris suggests early deglaciation in Strath Nethy, in the NW Cairngorms. After ice became too thin to flow across the divide, a huge outlet glacier became established in upper Strathspey. Recent cosmogenic dating of boulders on an ice-marginal moraine in Rothiemurchus, a large depression lying to the W of the Cairngorms, suggests that the Strathspey glacier was still active and readvancing at ca. 15.1ka (Hall et al. Reference Hall, Binnie, Sugden, Dunai and Wood2016b). Widespread ponding occurred during and following the decoupling of local Cairngorm glaciers from the Strathspey glacier sourced in the W (Brazier et al. Reference Brazier, Kirkbride and Gordon1998). This was associated with the aggradation of glaciofluvial fans and deltas on the southern flanks of the Spey–Findhorn divide at elevations of 300–350m OD (Merritt et al. Reference Merritt, Auton, Boston, Everest, Merritt, Boston, Lukas and Merritt2013). Meltwaters carrying clasts of Old Red Sandstone (ORS) lithologies flowed southwards through a deep channel on the divide, at Slochd Mòr. They were then deflected eastwards along the margin of the outlet glacier in Strathspey before flowing back northwards across the divide through the Beum a' Chlaidheimh Breach (British Geological Survey 2013; Merritt Reference Merritt, Connell and Hall2017a; Fig. 17).
There is abundant evidence, such as glacial drainage channels on the valley flanks, for the retreat of the Strathspey outlet glacier (Young Reference Young1974, Reference Young1975a, Reference Youngb, Reference Young1977a, Reference Youngb, Reference Young1978; British Geological Survey 2004, 2013; Merritt et al. Reference Merritt, Auton, Boston, Everest, Merritt, Boston, Lukas and Merritt2013). Some ice-marginal channels and benches are intimately associated with lateral moraine ridges, and evidence from Raitts Burn, 16km SW of Aviemore (Phillips & Auton Reference Phillips, Auton, Maltman, Hubbard and Hambrey2000, Reference Phillips, Auton, Boston, Lukas and Merritt2013; Phillips et al. Reference Phillips, Merritt, Auton and Golledge2007), indicates that the glacier remained active during its retreat towards Loch Etteridge, 8km E of Laggan (Fig. 13), an important late-glacial site that had become free of ice by 15.6 cal 14C ka BP (Lowe et al. Reference Lowe, Albert, Hardiman, MacLeod, Blockley, Pyne-O'Donnell, Palmer, Lowe and Rose2008a; Ballantyne et al. Reference Ballantyne, Schnabel and Xu2009b; Ballantyne & Small Reference Ballantyne and Small2018). Meltwaters were firstly ponded behind temporary barriers of stagnant ice and glacial sediment in the Middle Findhorn during deglaciation, before being constrained to follow the present axis of the valley towards the coast (Bremner Reference Bremner1939; Auton Reference Auton, Auton, Firth and Merritt1990, Reference Auton1998, Reference Auton, Merritt, Auton and Phillips2017a, Reference Auton, Merritt, Auton and Phillipsb). In contrast, much of the meltwater from decaying ice in the upper reaches of the Findhorn Valley drained NW into the Nairn valley, depositing broad spreads of kettled outwash sand and gravel around Moy (Fletcher et al. Reference Fletcher, Auton, Highton, Merritt, Robertson and Rollin1996; British Geological Survey 1997; Merritt et al. Reference Merritt, Auton, Firth, Merritt, Auton and Phillips2017b; Fig. 17)
5. Lowland depocentres
5.1. Inverness and Moray
This region, lying between the Inverness area and the mouth of the River Spey, E of Elgin, includes two of the few sites in Scotland at which organic material has been assigned to the Ipswichian Interglacial (Sutherland & Gordon Reference Sutherland, Gordon and Sutherland1993c; Hall et al. Reference Hall, Merritt, Connell and Hubbard2018, fig 13; Table 8). At Dalcharn, 15km E of Inverness, the Dalcharn Palaeosol Formation (Figs 17, 19) contains compressed and disseminated organic material that includes pollen of full interglacial affinity reflecting the middle and later stages of an interglacial cycle (Walker et al. Reference Walker, Merritt, Auton, Coope, Field, Heijnis and Taylor1992; Auton Reference Auton, Gordon and Sutherland1993; Merritt & Auton Reference Merritt, Auton, Merritt, Auton and Phillips2017). The organics appear to be relatively unweathered, but they rest on the Craig an Daimh Gravel, which is substantially decomposed, indicating that it has been subjected to prolonged weathering under warm, humid conditions. The pollen record indicates that closed pine forest with birch, alder and holly was succeeded by pine-heathland, which was replaced initially by birch and later by heath and open grassland (Walker et al. Reference Walker, Merritt, Auton, Coope, Field, Heijnis and Taylor1992). As the Dalcharn site lies near to the present northern limit of holly in Britain, the relative abundance of Ilex pollen in the profile almost certainly reflects a climate somewhat warmer than that of today. The pollen assemblage is similar in some respects to that described from Fugla Ness, on Shetland (Section 3.1), which was originally equated with the Gortian of Ireland (Birks & Ransom Reference Birks and Ransom1969), and, hence, with the Hoxnian of southern Britain. However, samples of sandy matrix collected from a unit of white, cryoturbated gravel taken from beneath the uppermost organic part of the palaeosol at Dalcharn have yielded maximal luminescence ages of 68 and 50ka (Duller et al. Reference Duller, Wintle and Hall1995). The ages are not at variance with an infinite radiocarbon date of >41.3 14C ka BP obtained from a bulk sample of the organic unit above, but suggest that the thermophilous arboreal pollen in the palaeosol must be either allochthonous (Whittington Reference Whittington, Auton, Firth and Merritt1990) or reworked.
Summary of events around Inverness and Moray. Estimated ages after Merritt et al. (Reference Merritt, Connell and Hall2017a). Abbreviations: B = glacial ‘binge'; C = cold-periglacial; I = Interglacial; IS = Interstadial; P = glacial ‘purge'; R = glacial readjustment.

Summary logs of sections recorded at Dalcharn (modified after Walker et al. Reference Walker, Merritt, Auton, Coope, Field, Heijnis and Taylor1992).
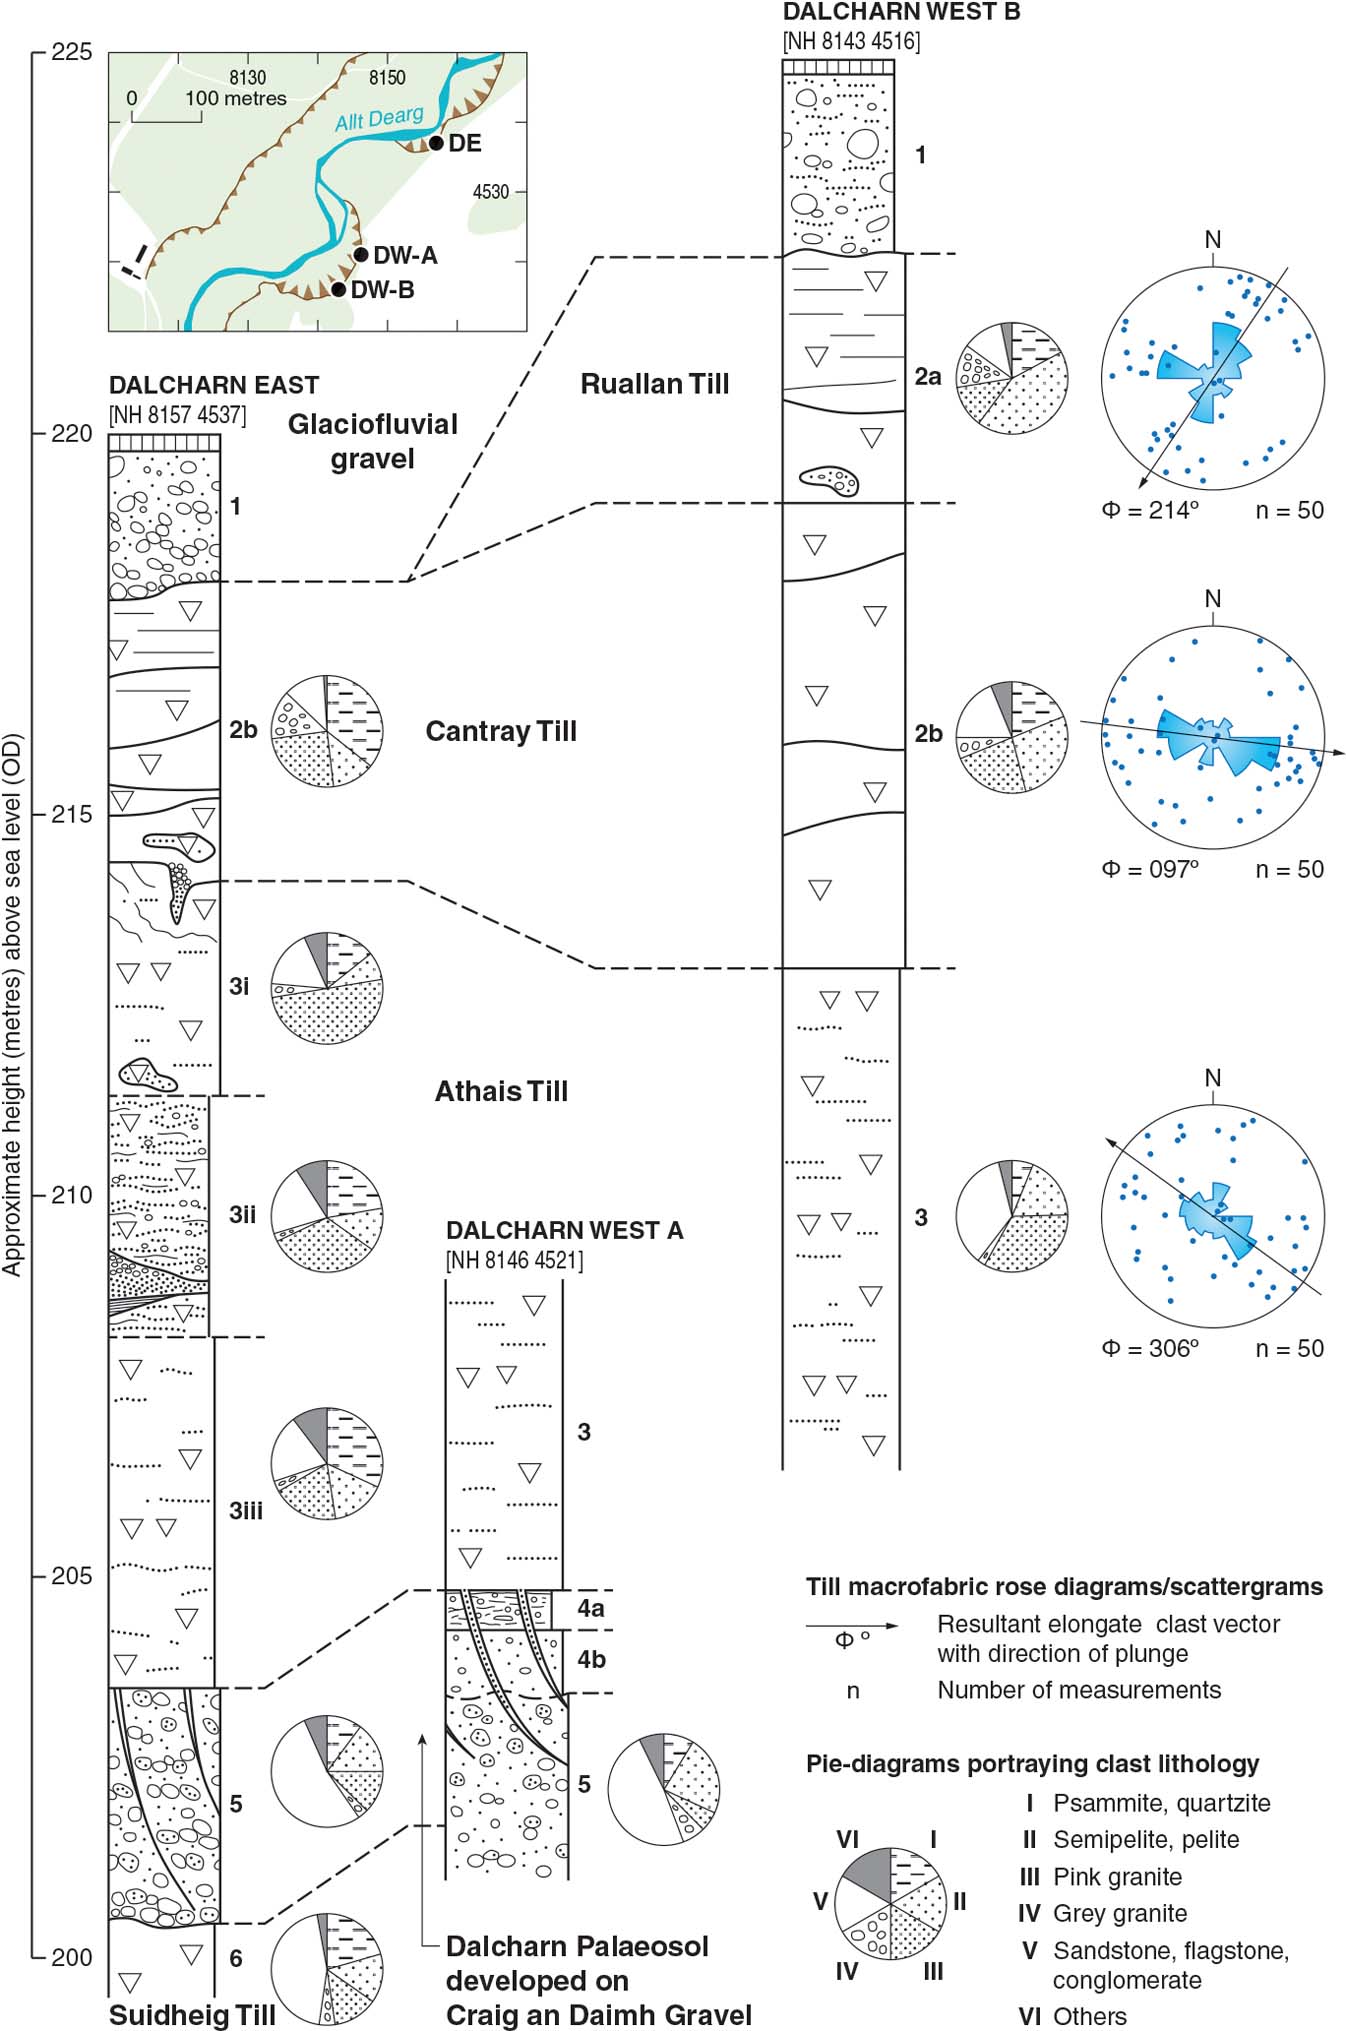
At another important site at Teindland (Fig. 17), near Elgin, where a preserved section reveals a truncated podzolic soil, the Teindland Palaeosol contains pollen of thermophillous species and grasses and has also been assigned to the latter part of the Ipswichian Interglacial (Sutherland Reference Sutherland, Gordon and Sutherland1993c; Hall et al. Reference Hall, Whittington, Duller and Jarvis1995a; Hall et al. Reference Hall, Merritt, Connell and Hubbard2018, fig. 21). Luminescence ages of around 79 and 67ka obtained by Duller et al. (Reference Duller, Wintle and Hall1995) from the Badentinian Sand Bed (Table 9) above the main organic horizons support the age suggested. Although the genesis of the overlying Woodside Diamicton is unclear, the presence of an isoclinal fold and shear zones within the sand bed strongly suggests post-depositional glacitectonism (Merritt et al. Reference Merritt, Auton, Connell, Hall and Peacock2003; Connell & Phillips unpublished). It follows that the uppermost part of the sand may have been eroded and, thus, the Thermoluminescence (TL) dates could significantly predate the initial glaciation of lower Strathspey during the last glacial cycle. However, the simplest interpretation would suggest that glaciation occurred soon after its deposition (Table 8).
The lithostratigraphy in the vicinity of Teindland Quarry, near Elgin.

A compressed bed of fibrous peat was discovered beneath till at the Allt Odhar site on the Moy estate, some 16km SE of Inverness, at 371m OD (Walker et al. Reference Walker, Merritt, Auton, Coope, Field, Heijnis and Taylor1992; Merritt Reference Merritt, Auton, Firth, Merritt, Auton and Phillips2017b; Fig. 20). This Moy Peat Formation contains pollen, plant-macrofossils and coleopteran remains that reveal climatic deterioration towards the end of a cool interstadial as reflected in the replacement of birch woodland and willow scrub with grassland and heath, and then by open communities of grass and sedges (Walker et al. Reference Walker, Merritt, Auton, Coope, Field, Heijnis and Taylor1992). An Early Devensian MIS 5d or 5b age is not at variance with three infinite radiocarbon age determinations (>51.1 14C ka BP) (Walker et al. Reference Walker, Merritt, Auton, Coope, Field, Heijnis and Taylor1992), nor with an experimental U-series disequilibrium measurement of 106ka for the peat (Heijnis & van der Plicht Reference Heijnis and van der Plicht1992). However, samples collected from sand-rich lenses within the peat unit have subsequently yielded luminescence ages of between 37 and 58ka (Duller et al. Reference Duller, Wintle and Hall1995). These ages are consistent with a single finite radiocarbon age of 47.7 14C ka BP obtained from the alkali insoluble component of samples of the peat (Walker et al. Reference Walker, Merritt, Auton, Coope, Field, Heijnis and Taylor1992). The time span of 20ka between the TL ages for the top and bottom of the peat is difficult to accept, but not totally at variance with the entomological palaeoenvironmental evidence. On reflection, a Middle Devensian age is possible, especially as pollen grains of Bruckenthalia spiculifolia (Balkan heath) are not recorded (M. J. C. Walker, pers. comm. 2017). This species has been reported from Early Devensian interstadial deposits in NE Scotland (Whittington Reference Whittington1994; Section 5.2), although at much lower altitudes.
The Allt Odhar section showing details of the Odhar Peat Formation and the position of the sampling points for pollen, insect and plant macrofossil remains (modified from Walker et al. Reference Walker, Merritt, Auton, Coope, Field, Heijnis and Taylor1992). The terminology follows McMillan et al. (Reference McMillan, Hamblin and Merritt2011a).

The Ipswichian biogenic deposits at Dalcharn (Fig. 19) and the Early (or Middle) Devensian interstadial peat unit at Allt Odhar (Fig. 20) are overlain by the sandstone-rich Athais Till Formation of the Inverness Glacigenic Subgroup, which has a fabric indicating ice flow towards the SE (Walker et al. Reference Walker, Merritt, Auton, Coope, Field, Heijnis and Taylor1992; Auton Reference Auton, Gordon and Sutherland1993; Merritt Reference Merritt, Gordon and Sutherland1993; Merritt Reference Merritt, Auton, Firth, Merritt, Auton and Phillips2017b; Merritt et al. Reference Merritt, Connell and Hall2017a). The distribution of other concealed sandy diamictons of this subgroup (Fig. 3a) suggests that during a relatively early phase of the last glaciation, if not before, ice flowed across the Great Glen towards the ESE, against the north-facing slopes of the Inner Moray Firth (Sutherland & Gordon Reference Sutherland, Gordon, Gordon and Sutherland1993c; Fletcher et al. Reference Fletcher, Auton, Highton, Merritt, Robertson and Rollin1996). The ice carried sandstone, siltstone and conglomerate from ORS outcrops around Loch Ness eastwards towards Grantown-on-Spey onto ground up to at least 500m OD on the Nairn–Findhorn watershed and into the middle to lower reaches of the Nairn, Findhorn and Spey valleys (Hinxman & Anderson Reference Hinxman and Anderson1915; Horne Reference Horne1923; Sutherland & Gordon Reference Sutherland, Gordon, Gordon and Sutherland1993d; Merritt et al. Reference Merritt, Auton, Firth, Merritt, Auton and Phillips2017b; Fig. 17). The sandy Athais Till is generally overlain by psammite-rich till (Beinn an Uain Till Formation) deposited by ice flowing NNE (Fletcher et al. Reference Fletcher, Auton, Highton, Merritt, Robertson and Rollin1996). Following the systematic logging of numerous natural sections E of Inverness, Merritt & Auton (Reference Merritt and Auton1993) found that the contact between the sandstone-rich and overlying psammite-rich till was generally represented by a sharp change in colour and commonly by a planar discontinuity suggestive of a hiatus in aggradation. However, no major unconformities, distinct weathering profiles, palaeosols or organic deposits were found at the boundary, indicating deglaciation, although the presence of downward-tapering, wedge-shaped pull-apart structures, truncated gravel-filled channels, seams of glacitectonite and rip-up clasts of diamicton suggest that ice-bed boundary conditions changed during the switch in flow (Fletcher et al. Reference Fletcher, Auton, Highton, Merritt, Robertson and Rollin1996). At Dalcharn, till fabrics reveal that ice flow first swung around to the E before heading NNE (Walker et al. Reference Walker, Merritt, Auton, Coope, Field, Heijnis and Taylor1992; Fig. 19). This inferred direction of flow suggests that the uppermost till unit at Dalcharn was deposited when ice flowed directly towards the Moray Firth basin across the Spey–Findhorn divide from centres positioned over the Cairngorms and western Highlands (Fig. 17; Merritt et al. Reference Merritt, Auton, Boston, Everest, Merritt, Boston, Lukas and Merritt2013; Hughes et al. Reference Hughes, Clark and Jordan2014). Both the sandstone- and psammite-rich till units could be Middle to Late Devensian in age if the youngest luminescence age at Moy (37ka) is accepted (Duller et al. Reference Duller, Wintle and Hall1995; Merritt et al. Reference Merritt, Connell and Hall2017a; Table 8).
At Clava, in the Nairn valley (Fig. 17), there is an important, well-documented site long known for discoveries of ‘arctic' shelly clay and shelly diamicton (Merritt Reference Merritt1992; Gordon Reference Gordon, Gordon and Sutherland1993e; Merritt & Phillips Reference Merritt, Firth, Merritt, Auton and Phillips2017). At elevations of 150m OD, the Clava Shelly Clay contains well-preserved, high-boreal to low-arctic, shallow-water marine shells that have yielded amino acid racemisation (AAR) ratios no younger than the Middle Devensian (Merritt Reference Merritt1992). Furthermore, an associated folded raft of pebbly diamicton (Clava Shelly Till) containing fragments of Portlandia arctica, an indicator of shallow-marine, fully arctic conditions, yielded a radiocarbon age of >47.1 cal 14C ka BP. These sediment units are now accepted to be glacial rafts transported eastwards from the Loch Ness basin (Fig. 17), which was probably a marine fjord during the Middle Devensian (Merritt Reference Merritt1992; Phillips & Merritt Reference Phillips and Merritt2008; Merritt et al. Reference Merritt, Akhurst, Wilkinson, Riding, Phillips, Smith, Finlayson and Dean2014). The rafts are overlain by the Finglack Till Formation, which was laid down by NE-directed ice that flowed towards the Inner Moray Firth, forming elongated subglacial landforms of this orientation (Hughes et al. Reference Hughes, Clark and Jordan2014, flow-set 6; Ballantyne & Small Reference Ballantyne and Small2018, fig. 4). The sandy Finglack Till crops out around Inverness, Nairn, Forres and across the Black Isle (Fletcher et al. Reference Fletcher, Auton, Highton, Merritt, Robertson and Rollin1996; Fig. 3b).
Evidence of generally falling RSLs around Inverness during deglaciation is preserved in flights of raised late-glacial shorelines lying up to about 30m OD around the inner Moray Firth (Firth 1989; Firth & Haggart 1989; Smith et al. Reference Smith, Barlow, Bradley, Firth, Hall, Jordan and Long2018). These shorelines truncate widespread deposits of glaciofluvial outwash, silt and clay to the E of Inverness assigned to the Alturlie Gravels and Ardersier Silts formations, respectively (Fletcher et al. Reference Fletcher, Auton, Highton, Merritt, Robertson and Rollin1996; British Geological Survey 1997). These raised deposits, which are interpreted to be glaciomarine in origin on account of the cyclic sedimention they commonly display, were laid down in front of an active outlet glacier that flowed into the Inner Moray Firth (Merritt et al. Reference Merritt, Auton and Firth1995). The Ardersier Silts were deformed during a substantial readvance that formed a push moraine on the Ardersier peninsula and a capping of diamicton (Baddock Till Member) (Merritt et al. Reference Merritt, Auton and Firth1995; Fletcher et al. Reference Fletcher, Auton, Highton, Merritt, Robertson and Rollin1996; Merritt & Firth Reference Merritt, Firth, Merritt, Auton and Phillips2017; Merritt et al. Reference Merritt, Auton, Firth, Merritt, Auton and Phillips2017b). A tidewater fan-delta (Bothyhill Gravel Member) formed during a subsequent stillstand at Alturlie Point (Merritt et al. Reference Merritt, Auton and Firth1995, 2017c; Fletcher et al. Reference Fletcher, Auton, Highton, Merritt, Robertson and Rollin1996). These glacial oscillations, and an earlier one that formed a possible push moraine at Grange Hill, between Forres and Kinloss (Auton Reference Auton, Merritt, Auton and Phillips2017c), are currently undated. They probably result partly from the competing strengths of ice flowing from the Great Glen and through the Beauly Firth basin, and partly from the delicate interplay between contemporary rates of global sea-level rise and local glacio-isostatic uplift (Merritt et al. Reference Merritt, Auton and Firth1995; Smith et al. Reference Smith, Barlow, Bradley, Firth, Hall, Jordan and Long2018).
The results of recent geophysical surveys and lake-bed sampling in Loch Ness suggest that the frontal margin of the Ness Glacier terminated in water throughout its retreat (Turner et al. Reference Turner, Woodward, Dunning, Shine, Stokes and Ò Cofaigh2012). The glacier initially had a lightly grounded or possibly floating ice shelf, forming a series of low, cross-valley ridges on the lake bed. It had become fully grounded by Foyers (Fig. 17), where a major moraine ridge was formed during a stillstand. The subsequent retreat of the glacier was dynamic and punctuated by minor stillstands and oscillations that formed smaller moraines beneath the loch.
5.2. NE Scotland
A comprehensive, critical review of the complex lithostratigraphical and geomorphological record of the last glaciation of NE Scotland (River Spey around Buchan to Montrose) has been given by Merritt et al. (Reference Merritt, Connell and Hall2017a) and so is not repeated here in detail. Descriptions of the sites in the region that are mentioned below and that have provided important stratigraphical information are given by Sutherland & Gordon (Reference Sutherland, Gordon, Gordon and Sutherland1993a) and Merritt et al. (Reference Merritt, Auton, Connell, Hall and Peacock2003, http://earthwise.bgs.ac.uk/index.php/Cainozoic_geology_and_landscape_evolution_of_north-east_Scotland._Memoir_of_the_British_Geological_Survey,_sheets_66E,_67,_76E,_77,_86E,_87W,_87E,_95,_96W,_96E_and_97_(Scotland)
The informal lithostratigraphic ‘series' of glacigenic deposits in NE Scotland established by Sutherland (Reference Sutherland1984) and Hall & Connell (Reference Hall, Connell, Ehlers, Gibbard and Rose1991) have been replaced by more formal subgroups (McMillan et al. Reference McMillan, Hamblin and Merritt2011a; Fig. 3a). The ‘blue-grey series' of Synge (Reference Synge1956), renamed as the Banffshire Coast, Caithness and Orkney Glacigenic Subgroup, relates to a suite of generally thickly developed diamictons, sands and gravels laid down by ice that flowed onshore from the Moray Firth (Fig. 21). The ‘red series' of Jamieson (Reference Jamieson1906) and Synge (Reference Synge1956) formed of generally thickly developed reddish-brown diamictons, sands and gravels has been subdivided. This is in order to separate the typically more vivid reddish brown diamictons, sands, silts and gravels that were laid down by ice that encroached onshore from the North Sea basin (Logie-Buchan Glacigenic Subgroup), from those that were derived entirely from ice flowing NE along Strathmore (Mearns Glacigenic Subgroup). The ‘inland series' of Hall (Reference Hall1984) comprising generally thin, very sandy and commonly weathered diamictons, sands and gravels has become the East Grampian Glacigenic Subgroup.
Transport paths of some indicator erratics in NE Scotland (after Read Reference Read1923; Bremner Reference Bremner1928; Synge Reference Synge1956; Sissons Reference Sissons1967a; Merritt et al. Reference Merritt, Auton, Connell, Hall and Peacock2003). Hill-shaded surface model built from Intermap Technologies NEXTMap Britain elevation data.
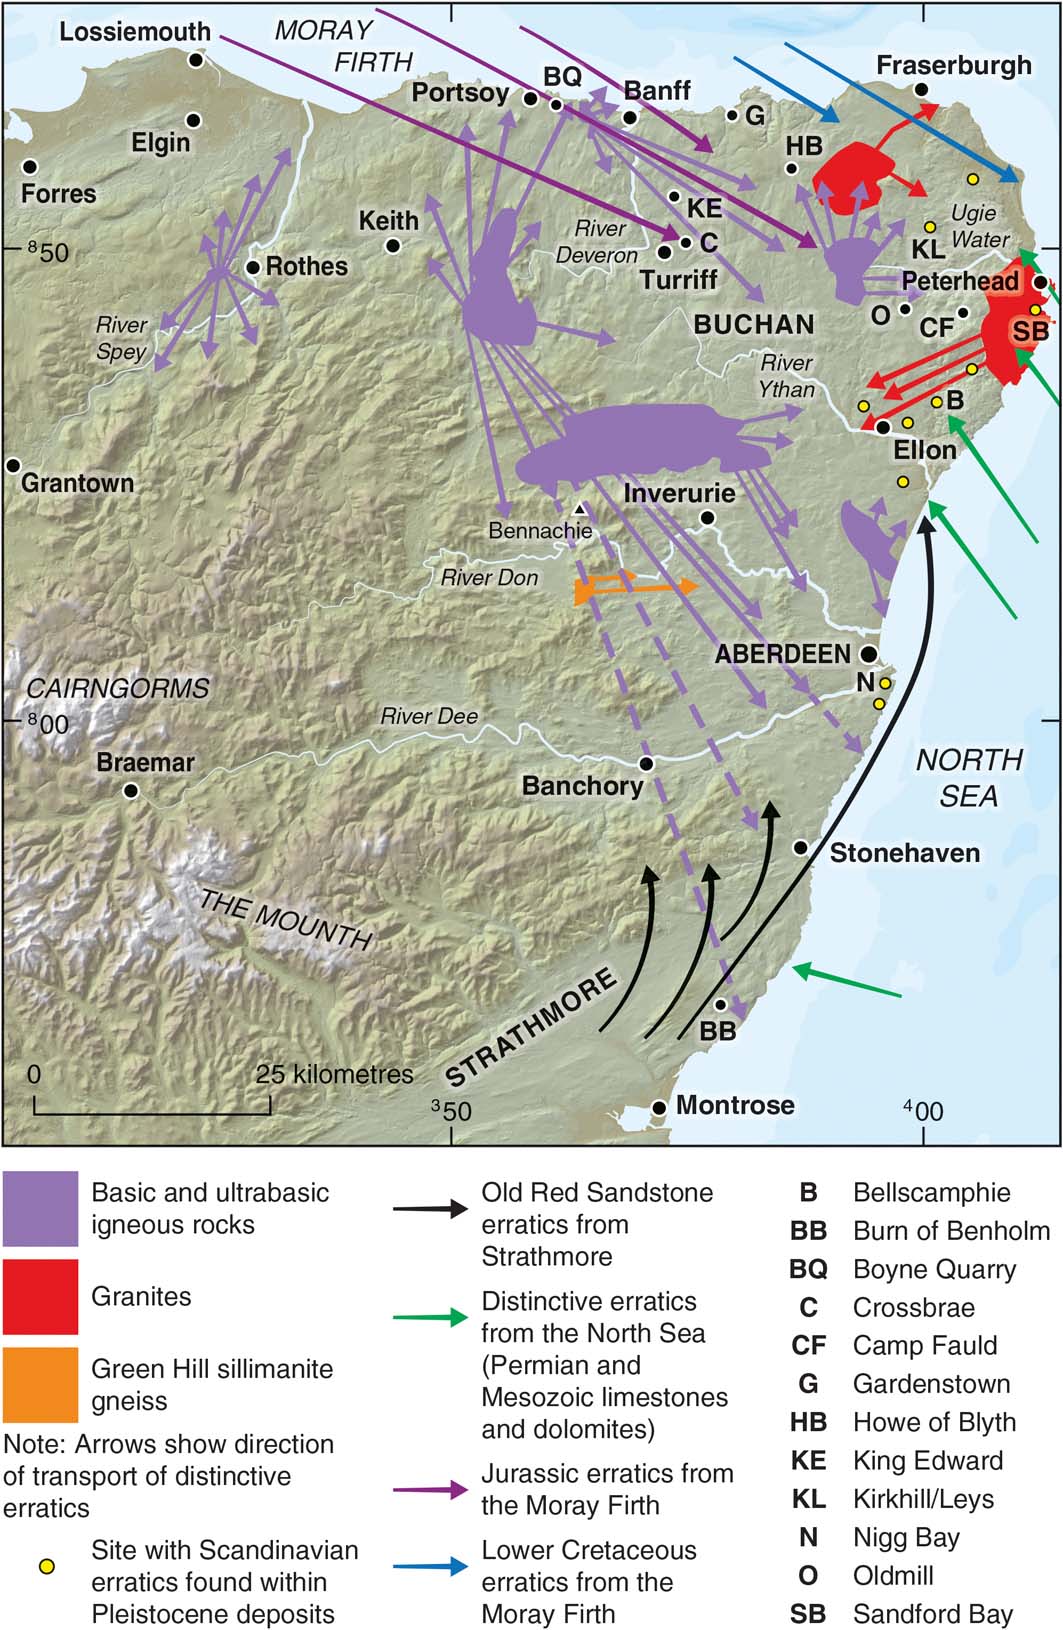
NE Scotland, and particularly Buchan (Fig. 21), includes several sites that are important for understanding pre-Devensian events (Hall et al. Reference Hall, Merritt, Connell and Hubbard2018). At the Kirkhill and Leys sites (Fig. 21), the truncated Fernieslack (Kirkhill Upper) Palaeosol Bed (Hall et al. Reference Hall, Merritt, Connell and Hubbard2018, fig. 14) is assigned to the Ipswichian following TL dates on sediments underlying it (Duller et al. Reference Duller, Wintle and Hall1995; Tables 10, 11). Early Devensian stadial/interstadials recording fluctuating cool and colder environmental conditions may be represented at the Camp Fauld and Crossbrae sites in Buchan (Fig. 21; Whittington et al. Reference Whittington, Hall and Jarvis1993, Reference Whittington, Connell, Coope, Edwards, Hall, Hulme and Jarvis1998; Merritt et al. Reference Merritt, Auton, Connell, Hall and Peacock2003). Elsewhere, the Burn of Benholm Peat Bed at the Burn of Benholm, S of Inverbervie (Fig. 21), is also now correlated tentatively with MIS 5c on the basis of the presence of pollen of the Balkan heath, Bruckenthalia spiculifolia, which occurs at Camp Fauld and Crossbrae (Whittington Reference Whittington1994; Auton et al. Reference Auton, Gordon, Merritt and Walker2000). At Benholm, the erratics within the shelly, clayey diamicton (Benholm Clay Formation) that underlies the peat bed indicate that it was laid down by ice flowing onshore from the North Sea basin, probably during MIS 6 (Merritt et al. Reference Merritt, Auton, Connell, Hall and Peacock2003; Hall et al. Reference Hall, Merritt, Connell and Hubbard2018).
Summary of events in NE Scotland. Stages and estimated ages after Merritt et al. (Reference Merritt, Connell and Hall2017a). Abbreviations: B = glacial ‘binge'; C = cold-periglacial; I = Interglacial; IS = Interstadial; P = glacial ‘purge'; R = glacial readjustment.

The lithostratigraphy at Kirkhill and Leys quarries relating to the last glacial–interglacial cycle. Note: Due to the position of the sites in eastern Buchan, and the accommodation space available in channels/basins, this complex stratigraphy does not exceed 2.5–3.0m in total thickness.

The last ice sheet witnessed abrupt changes in ice-flow direction and geometry (Hughes et al. Reference Hughes, Clark and Jordan2014), but the peripheral location of this area in respect to accumulation centres in the W and NW probably resulted in large sectors remaining cold-based for long periods. This is suggested by palimpsest periglacial features (cf. Kleman Reference Kleman1994) preserved in central Buchan, where the stratigraphical record is longest (Connell & Hall Reference Connell, Hall and Boardman1987; Hall et al. Reference Hall, Merritt, Connell and Hubbard2018).
It has been suggested that much of Scotland was glaciated during the Early Devensian (MIS 4) (Sutherland Reference Sutherland1981) and Hibbert et al. (Reference Hibbert, Austin, Leng and Gatliffe2010) have recorded contemporaneous IRD with a Scottish provenance in the offshore Barra-Donegal Fan (Hall et al. Reference Hall, Merritt, Connell and Hubbard2018, fig. 1) implying a marine-terminating ice sheet during this period. However, with the possible exception of the Woodside Diamicton at Teindland (Hall et al. Reference Hall, Whittington, Duller and Jarvis1995a; Table 8), no tills in the region can be confidently assigned to this glacial event, including the Hythie Till (Kirkhill Upper Till) (Hall & Jarvis Reference Hall, Gordon, Whittington, Birnie, Gordon, Bennett and Hall1993a), and the Pitlurg Till, at Bellscamphie, near Ellon (Hall & Jarvis Reference Hall, Whittington, Gordon, Birnie, Gordon, Bennett and Hall1993b, Reference Hall and Jarvis1995) (Fig. 21). Several sites probably include a record of this period in the form of periglacial phenomena; for example, the Corsend Gelifluctate Bed at Kirkhill (Table 11; Hall et al. Reference Hall, Merritt, Connell and Hubbard2018, figs 16, 18). At Oldmill, in Buchan, and Nigg Bay, immediately S of Aberdeen, clastic sediments have yielded luminescence (OSL) age estimates of 74±6ka and 63±7ka, respectively (Merritt et al. Reference Merritt, Auton, Connell, Hall and Peacock2003). This suggests, if correct, that the dated glaciodeltaic deposit at Oldmill (truncated and capped by a periglacial land surface displaying ice-wedge casts) and upwards-fining outwash sediments at Nigg Bay may represent terrestrial evidence of an MIS 4 ice sheet (Gemmell et al. Reference Gemmell, Murray and Connell2007). At both sites these sediments are overlain unconformably by complex suites of tills, sands and gravels believed to date to later Devensian events (Merritt et al. Reference Merritt, Connell and Hall2017a).
There are now no known representative organic deposits of Middle Devensian interstadials in the region. The Crossbrae Peat at Crossbrae, near Turriff (Fig. 21) was originally thought to date from between 22 and 26.5 14C ka BP, but it is now correlated with MIS 5a or 5c (Whittington et al. Reference Whittington, Connell, Coope, Edwards, Hall, Hulme and Jarvis1998). The apparent absence of Middle Devensian deposits may be explained if the region was ice-covered during this period of time. Indeed, this scenario is suggested by evidence obtained from the gravel pit at the Howe of Byth, near New Pitsligo (Fig. 22), at which the Howe of Byth Gravel has yielded luminescence ages of between 45 and 38ka (Duller et al. Reference Duller, Wintle and Hall1995; Hall et al. Reference Hall, Duller, Jarvis and Wintle1995b). As this gravel unit is interpreted to have been laid down by glacial meltwater (Hall et al. Reference Hall, Duller, Jarvis and Wintle1995b; Hall & Connell Reference Hall, Connell, Merritt, Connell and Bridgland2000), ice had possibly reached the northern coast of Buchan at this time.
Summary logs of sections recorded at the Howe of Byth Quarry, SW of Fraserburgh (modified after Hall & Connell Reference Hall, Connell, Merritt, Connell and Bridgland2000).

Twelve stages in the evolution of the last BIIS in NE Scotland during the Middle to Late Devensian have been recognised by Merritt et al. (Reference Merritt, Connell and Hall2017a; Table 10; Fig. 23) and are summarised in the following sections. Stages 1–5 are established mainly from a parsimonious interpretation of the lithostratigraphical record at a few key sites, whereas stages 6–12 are linked to retreat stages based on the geomorphological record, both onshore and offshore, identified by Clark et al. (Reference Clark, Hughes, Greenwood, Jordan and Sejrup2012a, Reference Clark, Ely, Greenwood, Hughes, Meehan, Barr, Bateman, Bradwell, Doole, Evans, Jordan, Monteys, Pellicer and Sheehyb) and Hughes et al. (Reference Hughes, Clark and Jordan2014). The evidence for each stage is presented fully as ‘Supporting Information' in Merritt et al. (Reference Merritt, Connell and Hall2017a); however, problems remain regarding the published geochronometry for the region, particularly the integration of ages produced by different dating methods and of adjustments and recalibrations that have been made to them.
Conceptual glacial reconstructions depicting stages in the evolution of the NE quadrant of the last BIIS (from Merritt et al. Reference Merritt, Connell and Hall2017a with minor modification). (Reprinted from Journal of Quaternary Science, 32, 276–94, Merritt, J. W., Connell, E. R. & Hall, A. M., Middle to Late Devensian glaciation of north-east Scotland: implications for the north-eastern quadrant of the last British–Irish ice sheet. Copyright (2017), with permission from Wiley.) (A) Reconstruction similar to that of Boulton et al. (Reference Boulton, Smith, Jones and Newsome1985, fig. 10) (stage 1). (B) LLGM (stage 2). (C) Considerable thinning and glacial reorganisation during stages 3 and 4. (D) Re-expansion following possible marine ingression into the Witch Ground basin during stage 5, followed by probable coalescence of BIIS and the NCIS at the Tampen Ridge (see reconstruction F for limits). (E) Marine ingression to Lunan Bay during stage 7. (F) Stages 8–12 and other limits after Clark et al. (Clark et al. Reference Clark, Hughes, Greenwood, Jordan and Sejrup2012a, figs 12, 13). Red hexagons show the centre of the Witch Ground basin. Ice divides shown by thick black lines with open diamonds; single filled ticks denote ice divide receding by ice stream headward scavenging.

At least three ‘binge-purge' cycles (cf. Alley & MacAyeal Reference Alley and MacAyeal1994) occurred during the last glaciation of Scotland (Hubbard et al. Reference Hubbard, Bradwell, Golledge, Hall, Patton, Sugden, Cooper and Stoker2009; Fig. 12) and appear to be represented in the stratigraphy of NE Scotland (Merritt et al. Reference Merritt, Connell and Hall2017a; Table 10). The ‘binge' phases resulted in very limited, patchy subglacial erosion and till deposition, but were conducive to the initiation, transport and preservation of glacial rafts, which are unusually common along the Banffshire coast and in Buchan (Peacock & Merritt Reference Peacock and Merritt1997, 2000; Merritt & Connell Reference Merritt and Auton2000; Merritt et al. Reference Merritt, Auton, Connell, Hall and Peacock2003). The relatively short ‘purge' phases dominate the subglacial geomorphological legacy, in terms of the number of distinct flowsets that have been recognised (Hughes et al. Reference Hughes, Clark and Jordan2014), and appear to be more fully represented in the stratigraphical record through deposition of till.
5.2.1. Stage 1
An extensive, early, ESE-directed flow of ice from the Great Glen and the western Highlands has been deduced to have occurred to the W of the Spey across ground rising to at least 500m OD (Fletcher et al. Reference Fletcher, Auton, Highton, Merritt, Robertson and Rollin1996; Fig. 23a; Section 5.1). Several sites in NE Scotland preserve stratigraphical evidence of a possibly contemporaneous early ice advance from the NW across the southern shore of the Moray Firth, such as at Teindland, Boyne Quarry and Gardenstown (Peacock & Merritt Reference Peacock and Merritt1997, Reference Peacock and Merritt2000; Merritt et al. Reference Merritt, Auton, Connell, Hall and Peacock2003; Fig. 21).
5.2.2. Stage 2
The SE flow of ice from the Moray Firth laid down dark grey, shelly diamictons with a rich Jurassic to early Cretaceous palynoflora (Whitehills Glacigenic Formation) (Peacock Reference Peacock, Merritt, Connell and Bridgland2000a), for example, at Boyne Quarry (Gordon Reference Gordon, Gordon and Sutherland1993f; Peacock & Merritt Reference Peacock and Merritt2000; Figs 24, 25). The ice penetrated inland across central and eastern Buchan towards Aberdeen on at least one occasion (Synge Reference Synge1963; Fig. 21), laying down large masses of crushed, dark grey Mesozoic mudstone at Gardenstown (Castle Hill) (Sutherland Reference Sutherland, Gordon, Gordon and Sutherland1993d; Peacock & Merritt Reference Peacock and Merritt1997), Oldmill (Merritt & Connell Reference Merritt, Connell, Merritt, Connell and Bridgland2000a), Ardglassie (Merritt & Connell Reference Merritt, Connell, Merritt, Connell and Bridgland2000b) and at Kirkhill and Leys (Corse Diamicton Member) (Table 10). Ice was apparently sufficiently thick to create SE-orientated striae on the NE flank of the iconic mountain of Bennachie, at ca.335m OD (Merritt et al. Reference Merritt, Connell and Hall2017a; Fig. 21). AAR ratios (Miller et al. Reference Miller, Jull, Linick, Sutherland, Sejrup, Brigham, Bowen and Mangerud1987) on derived shell fragments in glacigenic sediments, mostly from the King Edward site (Hall & Peacock Reference Hall, Peacock, Merritt, Connell and Bridgland2000; Fig. 21), indicate that the BIIS last advanced across Buchan in the latter part of the Middle Devensian (Peacock & Merritt Reference Peacock and Merritt2000). A substantial shelf-edge parallel ice sheet is speculated to have become established during this stage (Merritt et al. Reference Merritt, Connell and Hall2017a; Fig. 23b).
Generalised stratigraphy recorded at Boyne Quarry in 2014, E of Portsoy. Encircled letters refer to units described by Peacock & Merritt (Reference Peacock and Merritt2000).

Subglacially streamlined features and ice marginal glacial drainage channels around Boyne Quarry (A) and the Howe of Byth (B) sites (modified after Merritt et al. Reference Merritt, Connell and Hall2017a). Flowsets (fs) after Hughes et al. Reference Hughes, Clark and Jordan2014. Hill-shaded surface model built from Intermap Technologies NEXTMap Britain elevation data.

5.2.3. Stage 3
Till provenance and the direct superimposition of tills suggest that ice flow swung around to the E or ENE along the coast of the Moray Firth, laying down, for example, the Tofthead Till at Teindland (Table 9; Hall et al. Reference Hall, Whittington, Duller and Jarvis1995a, Reference Hall, Merritt, Connell and Hubbard2018), the Old Hythie Till Formation at Boyne Quarry (Peacock & Merritt Reference Peacock and Merritt2000; Fig. 24), the Byth Till Formation at the Howe of Byth (Hall et al. Reference Hall, Duller, Jarvis and Wintle1995b; Fig. 22) and the Hythie Till Formation at Oldmill and Kirkhill (Merritt et al. Reference Merritt, Auton, Connell, Hall and Peacock2003; Table 10; Fig. 23c). A major glacial reorganisation appears to have occurred associated with thinning of the ice sheet, but apparently not resulting in widespread glacial retreat across the region.
5.2.4. Stage 4
Sparse, poorly developed, streamlined subglacial landforms in western Buchan (Fig. 26, flow-set 33) indicate possible NNW drawdown of ice towards the Moray Firth basin from an ice divide stretching from the Cairngorms towards Buchan (Hughes et al. Reference Hughes, Clark and Jordan2014), but no contemporary till unit has been reported (Merritt et al. Reference Merritt, Connell and Hall2017a). This scenario is supported by crossing striae recorded at two localities SSE of Banff (Fig. 21), where eastward-directed striae are cut by N or NNE-directed ones (Read Reference Read1923; Merritt et al. Reference Merritt, Auton, Connell, Hall and Peacock2003), but there is little evidence in eastern Buchan for northward flow, possibly because that area was protected beneath cold-based ice.
Reconstruction of ice-free enclaves and proglacial lakes in Buchan (modified after Merritt et al. Reference Merritt, Connell and Hall2017a). (a) Confluence between ice lobes during stage 5, creation of 80m Glacial Lake Ugie (GLU) followed by the ‘Logie-Buchan Readvance' and creation of 50m GLU during stage 6. (b) Decay of the Logie-Buchan ice lobe, further retreat of East Grampian ice followed by readvance of Moray Firth ice during stages 7–9. (c) St. Fergus Readvance and subsequent ponding during glacial retreat along the Banffshire coast during stages 10–11.

5.2.5. Stage 5
Ice flowing through the Moray Firth basin and Strathmore appears to have subsequently thickened, coalescing at the ‘Angle of Buchan', between Fraserburgh and Peterhead, as reconstructed by Clapperton & Sugden (Reference Clapperton and Gordon1977) (Fig. 23d). As the inland boundary of the Hatton Till Formation (Fig. 3b), laid down by Strathmore ice, can be traced from the Ythan valley NE across ground above 80m OD (grey dashed line in Fig. 26a), there was probably ice occupying the central North Sea basin, preventing ice from flowing directly offshore from Strathmore. The absence of evidence suggests that Central Buchan was mostly protected from glacial erosion beneath cold-based ice at this time. A small ice-free enclave appears to have opened up soon after in eastern Buchan, at the confluence of Strathmore, East Grampian and Moray Firth-sourced ice, where deltaic deposits formed in Glacial Lake Ugie at its 80m OD level (Merritt et al. Reference Merritt, Auton, Connell, Hall and Peacock2003, Reference Merritt, Connell and Hall2017a; Fig. 26a).
5.2.6. Stage 6
East Grampian ice slowly retreated W across Buchan (Fig. 26a), leaving a reticulate network of glacial drainage channels of a type associated with cold-based ice margins (cf. Benn & Evans Reference Benn and Evans2010, fig. 8.38) and laying down the Banchory Till Formation (Fig. 3b). A local glacial reorganisation followed that involved a further advance of Strathmore ice onshore between Aberdeen and Peterhead, up the valley of the River Ythan to the vicinity of Ellon, where laminated silts and clays occur that formed in a proglacial, ice-dammed lake (Merritt et al. Reference Merritt, Auton, Connell, Hall and Peacock2003) and formed arcuate end-moraines at the Cross-Stone site nearby (Gemmell et al. Reference Gemmell, Murray and Connell2007; Fig. 26a). The ice also advanced into the lower Ugie Valley during this event, named as the ‘Logie-Buchan Readvance' by Merritt et al. (Reference Merritt, Connell and Hall2017a). It dammed Glacial Lake Ugie at its 50m OD level (Fig. 26b), in which thick sequences of laminated muds were deposited (Ugie Clay Formation) (Peacock & Connell Reference Peacock, Connell, Merritt, Connell and Bridgland2000). Glaciofluvial deposits associated with both the former lakes experienced intense periglacial conditions during subsequent stages, testified by widespread preservation of tundra polygons and other cryogenic phenomena in the Ugie Valley (Gemmell & Ralston Reference Gemmell and Ralston1984), but attempts at OSL dating the glaciofluvial sediments proved inconclusive (Gemmell et al. Reference Gemmell, Murray and Connell2007).
The ice lobe occupying Logie-Buchan subsequently decayed to form fresh, hummocky topography typical of ice stagnation (Jamieson Reference Jamieson1882). The associated deposits of the Logie-Buchan Glacigenic Subgroup are generally undivided as they comprise a complex interbedded sequence of clayey diamict, sand, silt, clay and gravel, typically vivid reddish brown in colour. Sands and gravels forming eskers and kame-terraces are assigned to the Kippet Hills Sand and Gravel Formation, which contains a distinctive suite of glacial erratics, in particular Permian limestone, and shells derived from the floor of the North Sea basin immediately to the E (Gordon Reference Gordon, Gordon and Sutherland1993g; Hall & Jarvis Reference Hall and Jarvis1995; Merritt et al. Reference Merritt, Auton, Connell, Hall and Peacock2003; Fig. 26). Although East Grampian ice had retreated from at least the lower reaches of the Ythan and Ugie valleys during the Logie-Buchan Readvance (Fig. 26b), the two ice masses abutted in the vicinity of Aberdeen where there is both stratigraphical and geomorphological evidence at Nigg Bay (Fig. 21) for limited eastward readvance (‘Aberdeen Readvance') (Merritt et al. Reference Merritt, Auton, Connell, Hall and Peacock2003), but no confining dates.
5.2.7. Stage 7
Strathmore and East Grampian ice continued to ‘unzip' down the E coast, associated with widespread glaciofluvial and deltaic deposition around Aberdeen (Lochton Sand and Gravel Formation and Glen Dye Silts Formation) (Simpson 1948, 1955; Merritt et al. Reference Merritt, Auton, Connell, Hall and Peacock2003; Fig. 26b). A marine incursion led to the deposition of red clays of the Tullos Clay Member (Errol Formation) when RSL stood at about 30m OD (Peacock Reference Peacock1999). The ‘unzipping' continued down the coast to Montrose, where red marine clay of the Lunan Bay Clay Member was laid down at Lunan Bay (Fig. 23e). McCabe et al. (Reference McCabe, Clark, Smith and Dunlop2007a) conclude that the clay accumulated in open waters following a minor readvance at 20.1–20.9 cal 14C ka BP, when RSL stood at about 22m OD. However, the basis of these authors' investigation has been questioned by Peacock et al. (Reference Peacock, Armstrong, Browne and Stoker2007) and Sejrup et al. (Reference Sejrup, Nygard, Hall and Haflidason2009), who comment on how the dates are incompatible with the youngest ages of ca.17.5ka for deglaciation of ground above 200m on Mormond Hill (Fig. 26b) and Pitfichie, SSW of Inverurie (Fig. 21), provided by cosmogenic techniques (Phillips et al. Reference Phillips and Merritt2008). Furthermore, in a review of RSL changes, glacial isostatic modelling and ice sheet reconstructions from the British Isles since the LGM, Shennan et al. (2006) conclude that the area only became ice-free after ca.17ka (Smith et al. Reference Smith, Barlow, Bradley, Firth, Hall, Jordan and Long2018).
5.2.8. Stage 8
This stage is correlated with the Fladen 1 Readvance (17.5 cal 14C ka BP), during which ice advanced SE into the Witch Ground basin of the North Sea (Sejrup et al. Reference Sejrup, Hjelstuen, Nygård, Haflidason and Mardal2015), but the contemporaneous position of ice in NE Scotland is unclear (Clark et al. Reference Clark, Hughes, Greenwood, Jordan and Sejrup2012a; Sejrup et al. Reference Sejrup, Hjelstuen, Nygård, Haflidason and Mardal2015). The Scottish and Scandinavian ice sheets had separated by this time as the Viking Bank (E of Shetland) had become ice-free by ca.18.3ka (Peacock Reference Peacock1995; Hughes et al. Reference Hughes, Gyllencreutz, Lohne, Mangerud and Svendsen2016; Stewart et al. Reference Stewart, Carter, Dove, Stewart, Green, Cooper, Cotterill and Gafeira2019; Fig. 23f).
5.2.9. Stage 9
The mapped extent and provenance of the Essie Till Formation (Fig. 3b) combined with evidence from striae around Peterhead and Fraserburgh suggests that a limited readvance of Moray Firth ice occurred prior to its subsequent retreat across the NE tip of Buchan (Peacock Reference Peacock, Merritt, Connell and Bridgland2000b). By this stage, a huge ice lobe would have occupied most of the Moray Firth basin (Clark et al. Reference Clark, Hughes, Greenwood, Jordan and Sejrup2012a). It was fed from the NW through to the SE, delimited by sea-bed features that can be traced from Peterhead to the N tip of Shetland via the Bosies Bank, in the outer Moray Firth (Clark et al. Reference Clark, Hughes, Greenwood, Jordan and Sejrup2012a; Fig. 23f). The Bosies Bank has been interpreted as a push moraine (Graham et al. Reference Graham, Lonergan and Stoker2010, Reference Graham, Stoker, Lonergan, Bradwell and Stewart2011) now judged to have formed during the Fladen 2 Readvance at 16.2 cal 14C ka BP (Sejrup et al. Reference Sejrup, Hjelstuen, Nygård, Haflidason and Mardal2015).
5.2.10. Stage 10
Evidence from the raised glaciomarine deposits of the St Fergus Silt Formation suggests that the southern margin of the Moray Firth ice lobe terminated in the sea in the vicinity of St Fergus, at a RSL of ca.12m OD, before a minor onshore readvance created the St Fergus Push Moraine (Hall & Jarvis Reference Hall and Whittington1989; Merritt et al. Reference Merritt, Auton, Connell, Hall and Peacock2003; Fig. 26c). This feature includes faulted, tilted and deformed masses of bedded marine silt and sand formed by ice push from the E or NE. The absence of contemporary late-glacial marine deposits south of Peterhead (Shennan et al. 2006; Smith et al. Reference Smith, Barlow, Bradley, Firth, Hall, Jordan and Long2018) suggests that the sea had retreated from the area owing to rapid glacio-isostatic rebound (Merritt et al. Reference Merritt, Auton, Connell, Hall and Peacock2003). Radiocarbon dates on marine bivalves in the deformed silts suggest that the readvance occurred sometime after 17.5 cal 14C ka BP (Hall & Jarvis Reference Hall and Whittington1989; Peacock Reference Peacock1999). The push moraine has been linked tentatively with sea-bed features off the northern tip of Orkney (Clark et al. Reference Clark, Hughes, Greenwood, Jordan and Sejrup2012a; Reference BellFig. 23f) and it possibly correlates with a minor readvance that deposited the Wick Till in Caithness (Hall & Riding Reference Hall and Riding2016; Section 3.2).
5.2.11. Stage 11
During subsequent retreat, the southern margin of the Moray Firth ice lobe was pinned along the Banffshire coast where the lacustrine Kirk Burn Silt Formation accumulated in proglacial lakes, and swathes of glaciofluvial outwash (Blackhills Sand and Gravel Formation) were laid down in association with ice-marginal drainage channels (Merritt et al. Reference Merritt, Auton, Connell, Hall and Peacock2003; Fig. 26c). Evidence of minor readvances of the Moray Firth ice lobe against the coast have been reported, notably to the W of Banff (Merritt et al. Reference Merritt, Auton, Connell, Hall and Peacock2003). A limit based on sea-bed ridges that swing around from the vicinity of Banff to the NE tip of Caithness has been identified by Clark et al. (Reference Clark, Hughes, Greenwood, Jordan and Sejrup2012a, Reference Clark, Ely, Greenwood, Hughes, Meehan, Barr, Bateman, Bradwell, Doole, Evans, Jordan, Monteys, Pellicer and Sheehyb) (Fig. 23f). Merritt et al. (Reference Merritt, Connell and Hall2017a) tentatively link this stage with deposition of the so-called ‘Northern Drift', which resulted from a northward advance of ice towards the Moray Firth basin (Read Reference Read1923; Bremner Reference Bremner1934, Reference Bremner and Tocher1943). It laid down little till – for example, at Boyne Quarry (Fig. 24) – but left eskers, retreat moraines and numerous blocks of locally derived Huntly/Knock Gabbro (Read Reference Read1923; Peacock & Merritt Reference Peacock and Merritt2000; Fig. 25a).
A significant change in the character of the landscape occurs inland at retreat limits formed by moraine ridges S of Bennachie (Blairdaff Moraine Formation) and around Durn Hill (Merritt et al. Reference Merritt, Auton, Connell, Hall and Peacock2003, Reference Merritt, Connell and Hall2017a; Fig. 25a). For example, periglacial phenomena, specifically ice-wedge pseudomorphs and sheets of gelifractate and gelifluctate are widespread to the NE, across central Buchan (Synge Reference Synge1956; Romans et al. Reference Romans, Stevens and Robertson1966; Connell & Hall Reference Connell, Hall and Boardman1987), where a reticulate network of ice-marginal drainage channels formed at the retreating ice sheet margin (Clapperton & Sugden Reference Clapperton and Gordon1977). The channels are typically incised into bedrock with little or no associated till (Merritt et al. Reference Merritt, Auton, Connell, Hall and Peacock2003), they are rarely associated with eskers or other ice-contact glaciofluvial deposits (Merritt et al. Reference Merritt, Auton, Connell, Hall and Peacock2003) and they have a style that is typical of those formed at cold-based ice margins (cf. Benn & Evans Reference Benn and Evans2010, fig. 8.38). In contrast, relatively fresh-looking moraine ridges and glaciofluvial deposits relatively devoid of periglacial phenomena are more common to the SW, at least on lower ground (Sutherland & Gordon Reference Sutherland, Gordon, Gordon and Sutherland1993d).
It is suggested that the fresher topography formed after a significant regional re-expansion of ice associated with the ‘Northern Drift', following prolonged very cold conditions, but the event is currently undated. At the Howe of Byth site (Hall et al. Reference Hall, Duller, Jarvis and Wintle1995b; Fig. 22) the Auchmedden Gravel Formation forms an upper fan that was fed from water flowing eastwards via interconnected glacial drainage channels typical of those associated with westward retreating ice across central Buchan (Merritt & Peacock Reference Merritt, Peacock, Merritt, Connell and Bridgland2000; Fig. 25b). Gemmell et al. (Reference Gemmell, Murray and Connell2007) obtained an OSL luminescence age estimate of ca.61ka from the gravel unit, but it is older than the luminescence ages of ca.45 and 38ka obtained from the Howe of Byth Gravel below (Duller et al. Reference Duller, Wintle and Hall1995).
5.2.12. Stage 12
Peacock et al. (Reference Peacock, Berridge, Harris and May1968) present geomorphological evidence suggesting that ice re-occupied the lower reaches of Strathspey during a significant, but poorly constrained, readvance that they named as the Elgin Oscillation (Fig. 23f). The Waterworks Till was probably laid down during this event at Teindland (Table 9; Hall et al. Reference Hall, Whittington, Duller and Jarvis1995a). Ice at the coast ponded lakes (Glacial Lake Rothes) in an area previously vacated by East Grampian ice (Bremner Reference Bremner1934), such as at Tofthead, upstream of Fochabers (Connell Reference Connell, Merritt, Connell and Bridgland2000). The direction of large-scale foreset beds in deltaic deposits preserved in Glen Rothes, S of Elgin, and Glen Rinnes, SW of Dufftown, indicate that meltwater entered the lakes from the N and S, respectively (Merritt et al. Reference Merritt, Auton, Connell, Hall and Peacock2003). Sets of N–S orientated linear transverse ridges around Elgin (Peacock et al. Reference Peacock, Berridge, Harris and May1968) subsequently formed at the westward retreating margin of Moray Firth ice (Merritt et al. Reference Merritt, Auton, Finlayson, Merritt and Phillips2017d). As similar features have not been recorded to the E of the Spey, their presence within the glacial limits of the Elgin Oscillation suggests that glaciological conditions may have changed following that event (still not firmly dated), associated with the initiation of the Moray Firth Ice Stream (Hughes et al. Reference Hughes, Clark and Jordan2014).
5.3. Southern Argyll and Arran
Southern Argyll, including Kintyre, Islay and Arran (Fig. 27), contains evidence of glaciation that provides an important link between the terrestrial geomorphological and lithostratigraphical records of SW Scotland and NE Ireland (Finlayson et al. Reference Finlayson, Fabel, Bradwell and Sugden2014; Table 12). It also links the sedimentary records of the fjord-like coastal terrain of the western Scottish Highlands with the Malin Shelf beneath the Atlantic Ocean to the W (Fig. 27). This is another region that is notable for the presence of shell-bearing clays underlying till, particularly at sites in and around Tangy Glen, on the western coast of Kintyre (Fig. 27a), at elevations of between 40 and 60m OD (Sutherland Reference Sutherland, Gordon and Sutherland1993f). Deposits containing both cold and temperate marine molluscs, ostracods and foraminiferids also occur on the southern tip of Arran, at up to 55m OD (Sutherland Reference Sutherland1981). At Afton Lodge (Merritt et al. Reference Merritt, Akhurst, Wilkinson, Riding, Phillips, Smith, Finlayson and Dean2014), in Ayrshire, the shelly deposits have either been interpreted to be in situ (Sutherland Reference Sutherland1981) or attributed to glacial rafting (Synge & Stephens Reference Synge and Stephens1966) (Section 5.4.2). In either case, erratic dispersal patterns and glacial striae suggest that the localities on Kintyre were subsequently overridden by ice flowing W towards the Malin Shelf (Finlayson et al. Reference Finlayson, Fabel, Bradwell and Sugden2014). However, ice-marginal features on the W coast of Kintyre, together with striae on Arran, suggest that the final flow was towards the S through the Kilbrannan Sound and the Outer Firth of Clyde (Fig. 27g), consistent with the occurrence of red tills derived from Permo-Triassic rocks along the W coast of Kintyre (Synge & Stephens Reference Synge and Stephens1966). Two suites of recessional moraines have been recognised in the mountains of Arran (Gemmell Reference Gemmell1973), an inner suite attributable to the Loch Lomond (Younger Dryas) Stadial, and more subdued outer limits formed earlier during deglaciation (Ballantyne Reference Ballantyne2007). The relationship between the outer moraines and raised deltaic deposits in Glen Dougarie, western Arran, indicate that they formed after RSL had fallen from 32m OD (Finlayson et al. Reference Finlayson, Fabel, Bradwell and Sugden2014).
Eight stages (A–H) of the growth and decay of the last BIIS over western Scotland, the North Channel and NE Ireland (modified after Finlayson et al. Reference Finlayson, Fabel, Bradwell and Sugden2014). Diagonal shading denotes probable cold-based ice. Dashed lines denote ice divides. Age estimates modified in respect of the recently published age of the Scottish Readvance determined by Chiverrell et al. (Reference Chiverrell, Smedley, Small, Ballantyne, Burke, Callard, Clark, Duller, Evans, Fabel, van Landeghem, Livingstone, Ó Cofaigh, Thomas, Roberts, Saher, Scourse and Wilson2018). Hill-shaded surface model built from Intermap Technologies NEXTMap Britain elevation data.

Summary of events in Argyll. Stages and ages modified after Finlayson et al. (Reference Finlayson, Fabel, Bradwell and Sugden2014) and Chiverrell et al. (Reference Chiverrell, Smedley, Small, Ballantyne, Burke, Callard, Clark, Duller, Evans, Fabel, van Landeghem, Livingstone, Ó Cofaigh, Thomas, Roberts, Saher, Scourse and Wilson2018). Abbreviations: B=glacial ‘binge'; I=Interglacial; P=glacial ‘purge'.

A raised rock platform attributed to an interglacial period pre-dating the last glacial cycle passes beneath till in the vicinity of Tangy Glen, one of several such occurrences along the W coast of Scotland (Gray Reference Gray, Gordon and Sutherland1993; Smith et al. Reference Smith, Barlow, Bradley, Firth, Hall, Jordan and Long2018). Finlayson et al. (Reference Finlayson, Fabel, Bradwell and Sugden2014, fig. 5b) note that at Drumore Burn, S of Glenacardoch Point (Fig. 27g), 15m of till overlay up to 8m of cobble-gravel with weakly developed herring-bone cross stratification. Tentatively interpreted as beach gravel, the unnamed unit overlies a rock platform at ca.18m OD, only a few metres higher than the one described by Gray (Reference Gray, Gordon and Sutherland1993) at Glenacardoch Point.
In western Islay, up to 60m of pink clays, silts and diamicton rest on raised shore platforms (Benn & Dawson Reference Benn and Dawson1987). Luminescence dates of 55–40ka for these supposed glaciomarine sediments suggest an Early Devensian age (Dawson et al. Reference Dawson, Benn, Dawson, Dawson and Dawson1997), but the dates may be in error due to inadequate exposure to light in turbid water (Peacock Reference Peacock2008). Furthermore, the terraced surface of the sequence at up to 80–90m above OD is far above the Late Devensian marine limit in western Islay at 23m OD (Dawson Reference Dawson1982). Considering that global sea level was possibly as low as -75m and never significantly higher than -50m in the Early Devensian (Shackleton 1987), considerable glacio-isostatic depression would be required immediately following the retreat of a thick Early Devensian ice sheet for the sequence to have been deposited in situ (Sutherland Reference Sutherland1981). Whilst a similar explanation has been proposed to account for the occurrence of other ‘high level' cold-water marine/glaciomarine sediments around Scotland (Sutherland Reference Sutherland1981), all other occurrences are now considered more likely to have been emplaced by glacial rafting during the last glaciation (Merritt Reference Merritt1992; Peacock Reference Peacock2008; Finlayson et al. Reference Finlayson, Fabel, Bradwell and Sugden2014; Merritt et al. Reference Merritt, Akhurst, Wilkinson, Riding, Phillips, Smith, Finlayson and Dean2014).
Although no formal lithostratigraphy has been established, the glacial history of the region has become much clearer following recent analysis of NEXTMap imagery combined with cosmogenic dating and fieldwork. For example, Finlayson et al. (Reference Finlayson, Fabel, Bradwell and Sugden2014) have elucidated seven stages (summarised below) combining their findings with ice sheet reconstructions made for W central Scotland (Finlayson et al. Reference Finlayson, Fabel, Bradwell and Sugden2010), SW Scotland (Salt & Evans Reference Salt and Evans2004), northern England (Livingstone et al. Reference Livingstone, Evans, O'Cofaigh, Davies, Merritt, Huddart, Mitchell, Roberts and Yorke2012), NE Ireland (Greenwood & Clark Reference Greenwood and Clark2009; McCabe & Williams Reference McCabe and Williams2012) and the Malin Shelf (Dunlop et al. Reference Dunlop, Shannon, McCabe, Quinn and Doyle2010) (Fig. 27; Table 12).
Evidence from erratics reveals that ice advance was initially directed through N–S aligned, geologically controlled basins that have been carved through successive glacial cycles. Ice entered these basins in stage 1 from a restricted, marine-proximal mountain ice sheet similar to those that probably existed during many cold stages of the middle and late Pleistocene during ‘average' conditions (Porter Reference Porter1989; Fig. 27a). The ice front advanced against reverse slopes along the western coast of Kintyre, leading to the local preservation in hollows of glacial rafts of shelly sediment. The Western Highlands ice sheet subsequently joined with a smaller ice cap centred over the Southern Uplands during stage 2, which witnessed a major glacier expansion. An E–W ice divide developed over northern Kintyre, Arran and the Firth of Clyde, protecting the underlying landscape from glacial erosion. The ice sheet became sufficiently thick for ice to flow directly westwards to the Malin Shelf, and was no longer topographically constrained, creating WNW-directed bedforms (streamlined hills, crag-and-tail forms and drumlins) across southern Kintyre, maintaining the same alignment at all elevations. Following a possible early advance of Scottish ice into Belfast Lough, in Northern Ireland (Greenwood & Clark Reference Greenwood and Clark2009), an E–W ice ridge developed over the North Channel, bridging the British and Irish ice centres (Fig. 27b).
The N–S ice divide centred over the Firth of Clyde migrated some 60km to the E during stage 3, when enhanced drawdown towards the western marine margins of the BIIS created WNW-orientated streamlined subglacial bedforms across till along the western seaboard of Kintyre (Fig. 27c). Finlayson et al. (Reference Finlayson, Fabel, Bradwell and Sugden2014) infer that a shear margin within the ice sheet across southern Arran and central Kintyre separated warm-based ice, which flowed towards the Malin Shelf, from cold-based ice within a ‘sticky spot' that protected the delicate mountaintop tors of northern Arran (cf. Benn & Evans Reference Benn and Evans2010, p. 472) (Fig. 27b). Ice flowing over southern Arran and Kintyre merged with powerful NW flowing ice to overwhelm Islay (Cousins Reference Cousins2012). Finlayson et al. (Reference Finlayson, Fabel, Bradwell and Sugden2014) conclude that the regional N–S ice divide then migrated westwards again, following a substantial, renewed build-up of ice during stage 4. It became pinned over Arran and the eastern seaboard of Kintyre, causing minimal subglacial erosion there (Fig. 27d). An ice divide over the North Channel linked Antrim and the Southern Uplands at this time, which is possibly contemporaneous with the Gosforth/Blackhall Wood Oscillation (Scottish Readvance) into the northern Irish Sea basin (Merritt & Auton Reference Merritt, Peacock, Merritt, Connell and Bridgland2000; Livingstone et al. Reference Livingstone, Evans, O'Cofaigh, Davies, Merritt, Huddart, Mitchell, Roberts and Yorke2012; Chiverrell et al. Reference Chiverrell, Smedley, Small, Ballantyne, Burke, Callard, Clark, Duller, Evans, Fabel, van Landeghem, Livingstone, Ó Cofaigh, Thomas, Roberts, Saher, Scourse and Wilson2018) and the Clogher Head Readvance of Irish ice in NE Ireland (McCabe et al. Reference McCabe, Clark, Clark and Dunlop2007b; Clark et al. Reference Clark, Ely, Greenwood, Hughes, Meehan, Barr, Bateman, Bradwell, Doole, Evans, Jordan, Monteys, Pellicer and Sheehy2012b; Merritt et al. Reference Merritt, Roberson and Cooper2018) (Fig. 27e; Section 5.5).
During stage 5, ice flowing SW towards the North Channel subsequently formed streamlined, topographically unconstrained subglacial bedforms with this general alignment across thick till mantling western Kintyre (Finlayson et al. Reference Finlayson, Fabel, Bradwell and Sugden2014; Fig. 27f). Similar SSW-orientated bedforms in southern Arran indicate probable contemporaneous funnelling of ice out of the Outer Firth of Clyde, which must have followed breaching of the eastern half of the North Channel ice divide that previously linked Antrim and the Southern Uplands (Fig. 27e). The absence of streamlined landforms on the high ground of southern Kintyre and northern Arran, together with the local preservation of the mountaintop tors, suggest that either cold-based ice protected these areas from subglacial erosion or they formed nunataks. This likely resulted from the migration of the North Channel ice divide across these areas, linking Kintyre and Antrim.
Following rapid wasting of the Irish Ice Sheet, ice flowing from the more substantial ice centre positioned over the western Scottish Highlands temporarily advanced into Northern Ireland during the ‘East Antrim Coastal Readvance' (McCabe & Williams Reference McCabe and Williams2012; Finlayson et al. Reference Finlayson, Fabel, Bradwell and Sugden2014; Fig. 27f). Suites of converging subglacial landforms identified by Finlayson et al. (Reference Finlayson, Fabel, Bradwell and Sugden2014) across NW Kintyre, parts of southern Kintyre and southern Arran indicate that ice became increasingly topographically constrained during deglaciation (stage 6). The distribution and orientation of ice marginal meltwater channels mapped by Finlayson et al. (Reference Finlayson, Fabel, Bradwell and Sugden2014) in the region indicate that the major pathways of glacier retreat were through corridors of low-lying ground and glacially over-deepened basins (Fig. 27g).
The pattern of retreat of local glaciers on Arran deduced by Gemmell (Reference Gemmell1973) has been generally accepted, involving limited advances following separation from the main retreating outlet glaciers occupying the Kilbrannan Sound and Firth of Clyde (stage 7). The sediments and geomorphology in Dougarie Glen, western Arran, together with the results of recent cosmogenic dating there (Ballantyne Reference Ballantyne2007; Finlayson et al. Reference Finlayson, Fabel, Bradwell and Sugden2014), suggest that a limited advance of local ice occurred at ca.16.2ka BP following a fall in RSL from 32m OD (Fig. 27h). This timing supports RSL simulations for the area, where a falling RSL is modelled between ca.16.5 and 15ka BP (Shennan et al. 2006; Smith et al. Reference Smith, Barlow, Bradley, Firth, Hall, Jordan and Long2018).
5.4. West Central Lowlands
The lithostratigraphy of the region (McMillan et al. Reference McMillan, Hamblin and Merritt2011a), which includes the Glasgow conurbation and Ayrshire, is based on formations originally proposed by Rose (Reference Rose1981, Reference Rose, Rose and Schlüchter1989), Browne & McMillan (Reference Brown, Rose, Coope and Lowe1989) and Sutherland (Reference Sutherland and Bowen1999) (Fig. 28). The history of glaciation has been disputed (Price Reference Price1975; Menzies Reference Menzies1976, Reference Menzies1981; Sutherland & Gordon Reference Sutherland, Gordon, Gordon and Sutherland1993e; Rose & Smith Reference Rose and Smith2008), but recent geomorphological, lithostratigraphical and three-dimensional (3D) mapping investigations have substantially resolved the glacial history of this area (Finlayson Reference Finlayson2012; Finlayson et al. Reference Finlayson, Merritt, Browne, Merritt, McMillan and Whitbread2010, Reference Finlayson, Fabel, Bradwell and Sugden2014; Kearsey et al. Reference Kearsey, Lee, Finlayson, Garcia-Bajo and Irving2018).
Simplified glacial lithostratigraphy for the Clyde and Ayrshire basins (after McMillan et al. Reference McMillan, Hamblin and Merritt2011a). Greenland Ice Core GICC05 Chronology events after Lowe et al. (Reference Lowe, Rasmussen, Björk, Hoek, Steffensen, Walker and Yu2008b). Abbreviations: Fm = formation; Mbr = member; LLS = Loch Lomond Stadial; LI = Lateglacial Interstadial; GS = Greenland Stadial; GI = Greenland Interstadial.

5.4.1. Glasgow area (Clyde Basin)
At Balglass Burn, N of Glasgow (Fig. 29f), a weathered till containing partially decomposed clasts with weathering rinds underlies organic sands that have been radiocarbon dated to the Middle Devensian (36.0–34.9 cal 14C ka) (Brown et al. Reference Brown, Rose, Coope and Lowe2007). The sands are capped by relatively unweathered till formed during the last glaciation. Thus, Balglass is one of very few reliably described and sampled localities in Scotland where ice-free conditions can be proven immediately before the last glaciation, at ca.35 cal 14C ka BP (Table 13); others notably include Sourlie (see the following section) and Tolsta Head, on the Isle of Lewis (Whittington & Hall Reference Whittington and Hall2002; Hall et al. Reference Hall, Merritt, Connell and Hubbard2018) (Section 3.3).
Reconstructed stages (A–F) of glaciation in the West Central Lowlands (modified from Finlayson Reference Finlayson2012). Clyde basin outlined in red. Hill-shaded surface model built from Intermap Technologies NEXTMap Britain elevation data. Abbreviations: AF = Afton Lodge; CE = Carstairs Eskers; G = Grangemouth; GG = Glengavel; FF = Firth of Forth.

Summary of events in western central Scotland and Ayrshire. Stages and estimated ages modified after Finlayson et al. (Reference Finlayson, Merritt, Browne, Merritt, McMillan and Whitbread2010) and Finlayson (Reference Finlayson2012). Abbreviations: B = glacial ‘binge'; C = cold-periglacial; I = Interglacial; IS = Interstadial; P = glacial ‘purge'; R = glacial readjustment.

The considerable degree of weathering observed in the lower till at Balglass suggests that it was formed in a pre-Ipswichian (MIS 5e) glaciation (Brown et al. Reference Brown, Rose, Coope and Lowe2007). The unit probably correlates with the Ballieston Till Formation in the Clyde basin, which was laid down by a substantial advance of ice from the NW following a significant period of exposure (Price Reference Price1975; Browne & McMillan Reference Browne and McMillan1989; Sutherland & Gordon Reference Sutherland, Gordon, Gordon and Sutherland1993e; Fig. 29a). The Ballieston Till is shown from site investigations in parts of northern Glasgow to be overlain by gravelly sands of the Cadder Sand Formation (Menzies Reference Menzies1976, Reference Menzies1981; Finlayson Reference Finlayson2012; Kearsey et al. Reference Kearsey, Lee, Finlayson, Garcia-Bajo and Irving2018), from which bones and teeth of woolly rhinoceros have been obtained at two localities in the vicinity of Bishopbriggs (Fig. 29f) (Hungryside and Wilderness Pit) (Rolfe Reference Rolfe1966). Following ultrafiltration pre-treatment, a revised radiocarbon age of 31.1 14C ka BP (ca.35 cal 14C ka BP) has been obtained from bones collected from Wilderness Pit (Jacobi et al. Reference Jacobi, Rose, MacLeod and Higham2009). Excavations at the type site of Wilderness Pit (Rose Reference Rose, Rose and Schlüchter1989) showed that the Cadder Sand is locally overlain by water-lain diamictons of the Broomhill Clay Formation. Borehole records reveal that the latter comprises up to 15m of very compact, laminated, glaciolacustrine mud with dropstones (Browne & McMillan Reference Browne and McMillan1989; Finlayson Reference Finlayson2012). These glaciolacustrine muds, if varved, indicate that ponding occurred for at least 1000 years during the earliest stages of the last glaciation (Fig. 29a) and their elevation suggests that contemporary sea level was at least 25m below present sea level (Browne & McMillan Reference Browne and McMillan1989). The Broomhill Clay, Cadder Sand and Ballieston Till are mainly located within concealed bedrock depressions, particularly a 108-m-deep, 1500-m-wide and 26-km-long elongate depression, probably a tunnel valley (cf. Kehew et al. Reference Kehew, Piotrowski and Jørgensen2012), that trends WSW–ENE beneath the floodplain of the River Kelvin (Kearsey et al. Reference Kearsey, Lee, Finlayson, Garcia-Bajo and Irving2018) (Fig. 29f).
The Broomhill Clay and/or Cadder Sand are generally overlain by the widespread Wilderness Till Formation (Fig. 3b) assigned to the last glaciation (Rose et al. Reference Rose, Lowe and Switsur1988; Rose Reference Rose, Rose and Schlüchter1989; Sutherland & Gordon Reference Sutherland, Gordon, Gordon and Sutherland1993e; Forsyth et al. Reference Forsyth, Hall and McMillan1996; Hall et al. Reference Hall, Browne and Forsyth1998). At Wilderness Pit the Sand is sheared, folded and includes seams of diamicton, possibly glacitectonite, and the overlying Wilderness Till includes tectonic slices and rafts of sand and laminated clay from underlying units (Hall unpublished). In eastern Glasgow, the Wilderness Till is overlain by the Broomhouse Sand and Gravel Formation, which forms ice-contact topography including eskers, mounds, flat-topped kames and kettleholes (Browne & McMillan Reference Browne and McMillan1989; Rose & Smith Reference Rose and Smith2008; Finlayson Reference Finlayson2012; Kearsey et al. Reference Kearsey, Lee, Finlayson, Garcia-Bajo and Irving2018). The formation may be subdivided locally into the Ross Sand Member (deltaic sand and gravel) and the Bellshill Clay Member (glaciolacustrine laminated clay) (Browne & McMillan Reference Browne and McMillan1989). These units were deposited in ice-dammed ‘Glacial Lake Clydesdale' (Bell Reference Bell1871; Sissons Reference Sissons1967a, Reference Sissonsb) after the ice sheet margin had retreated NW (Sutherland & Gordon Reference Sutherland, Gordon, Gordon and Sutherland1993e) (Fig. 29e).
Late-glacial raised glaciomarine deposits assigned to two members of the Clyde Clay Formation (Fig. 28) were laid down around the Clyde estuary downstream of Glasgow following deglaciation at ca.15ka BP (Peacock Reference Peacock1971, Reference Peacock and Evans2003; Rose Reference Rose and Evans2003; McMillan et al. Reference McMillan, Hamblin and Merritt2011a; Fig. 30). The Paisley Clay Member, which typically comprises thinly laminated mud with dropstones and includes the cold-water foraminifera Elphidium clavatum, occurs up to altitudes of ca.40m OD (Browne & McMillan Reference Browne and McMillan1989). The Linwood Clay Member is confined to western areas of the estuary, where it commonly overlies the Paisley Clay; it consists of more thickly bedded mud, with a richer, warmer-water faunal assemblage (Peacock Reference Peacock and Evans2003).
Glacial geomorphology and geology of the Clyde and Ayrshire basins. (Reprinted from Quaternary Science Reviews, 29, 969–88, Finlayson, A., Merritt, J. W. Browne, M., Merritt, J. E., McMillan, A. & Whitbread, K. Ice sheet advance, dynamics and decay configurations: evidence from west central Scotland. Copyright (2010), with permission from Elsevier.) Erratic limits are from Eyles et al. (Reference Eyles, Simpson and MacGregor1949) and glacial striations from Paterson et al. (Reference Paterson, McAdam and MacPherson1998).
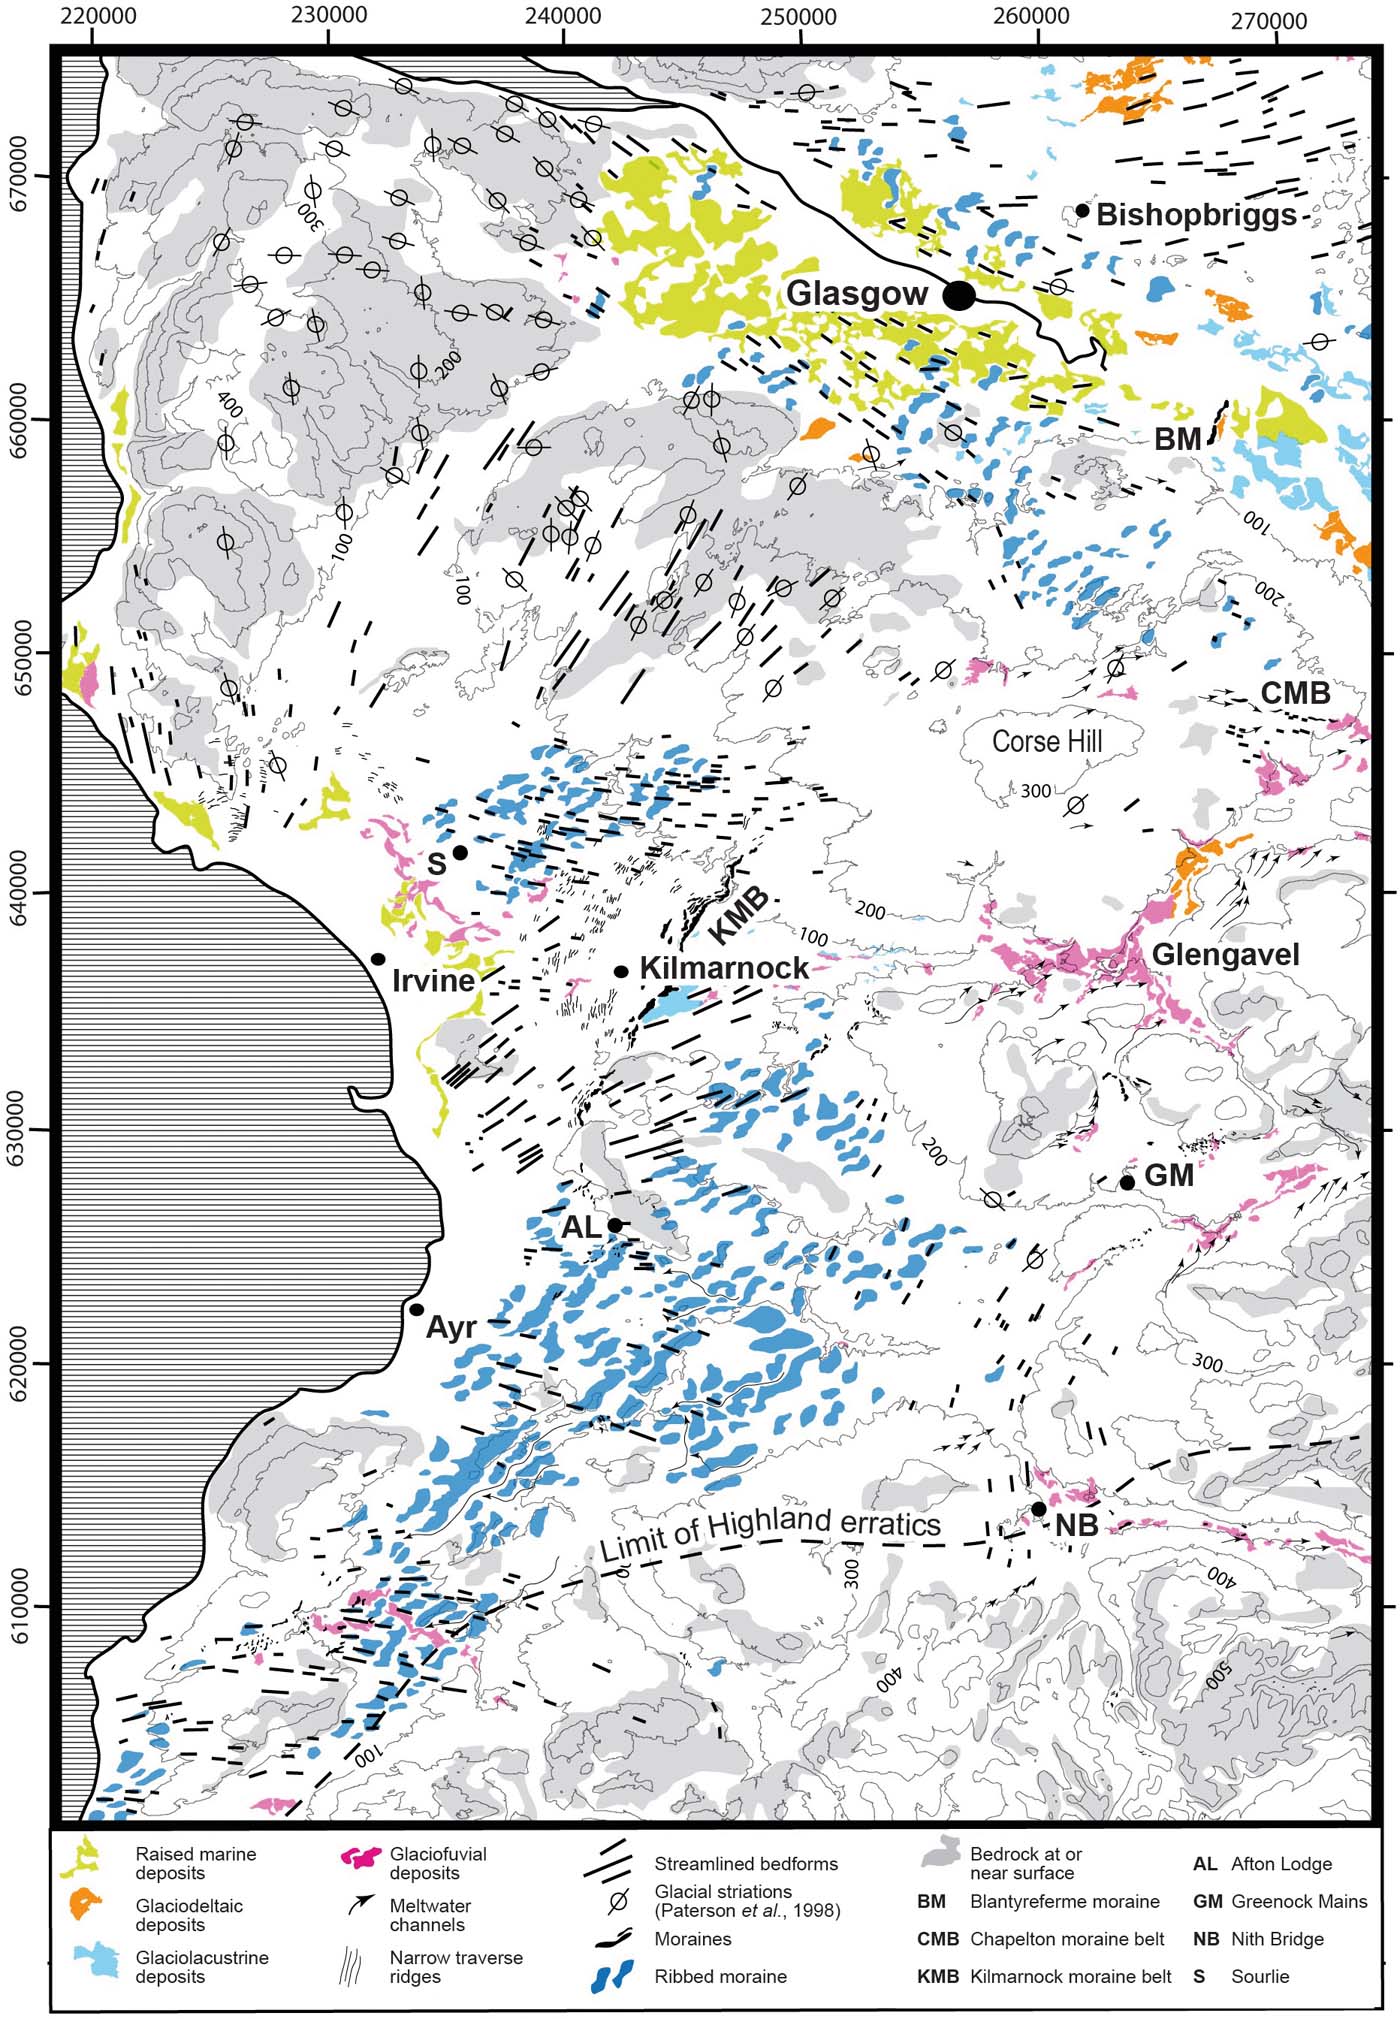
5.4.2. Ayrshire
The sequence in Ayrshire (Fig. 28) is largely based on sections in a former opencast coal pit at Sourlie, near Irvine (Jardine et al. Reference Jardine, Dickson, Haughton, Harkness, Bowen and Sykes1988; Sutherland & Gordon Reference Sutherland, Gordon, Gordon and Sutherland1993e; Sutherland Reference Sutherland and Bowen1999; Bos et al. Reference Bos, Dickson, Coope and Jardine2004; Finlayson et al. Reference Finlayson, Merritt, Browne, Merritt, McMillan and Whitbread2010), and on natural river bank sections at Afton Lodge, near Ayr (Merritt et al. Reference Merritt, Akhurst, Wilkinson, Riding, Phillips, Smith, Finlayson and Dean2014) (Fig. 30). Both sites lie within a suite of ribbed moraine (Fig. 30). The importance of the Sourlie site lay in the discovery of thin lenses of organic material occurring between two units of till (Jardine et al. Reference Jardine, Dickson, Haughton, Harkness, Bowen and Sykes1988). These lenses, now assigned to the Sourlie Organic Silt Formation (McMillan et al. Reference McMillan, Hamblin and Merritt2011a), occupy shallow depressions within the surface of the underlying glaciofluvial Armsheugh Sand and Gravel Formation. They have yielded a very rich flora and fauna deposited within a shallow pond in a treeless, low-shrub to sedge-moss tundra environment, together with bones of woolly rhinoceros and antler fragments of reindeer. Radiocarbon dates on the antler, plant debris and bulk organic matter range between 33.5 and 29.0 cal 14C ka BP, confirming a Middle Devensian age (Bos et al. Reference Bos, Dickson, Coope and Jardine2004). The basal unit at Sourlie (Littlestone Till Formation) comprises dark-grey stony diamicton locally enclosing deformed sheets of sand. The till is overlain by up to 3.5m of clay-rich gravel of uncertain origin named as the Lawthorn Diamicton Member. The two units were assumed to have been deposited during an Early Devensian glaciation by Sutherland (Reference Sutherland and Bowen1999), but they could be older.
At Sourlie, the Wilderness Till has been divided into two members (Fig. 28). The Eglinton Shelly Till is a diamicton containing fragments of marine shells together with far-travelled sedimentary, igneous and metamorphic rocks from the Scottish Highlands. It represents the ‘shelly tills' of the region (Sutherland & Gordon Reference Sutherland, Gordon, Gordon and Sutherland1993e), and some Arctica islandica shell fragments have yielded Late Devensian amino acid ratios (Jardine et al. Reference Jardine, Dickson, Haughton, Harkness, Bowen and Sykes1988). The overlying Auchenwinsey Till is a grey diamict containing local Middle Coal Measures and basic igneous rock lithologies (Jardine et al. Reference Jardine, Dickson, Haughton, Harkness, Bowen and Sykes1988).
The Eglinton Shelly Till at Afton Lodge is associated with several large bodies of shelly clay (see Gordon Reference Gordon, Gordon and Sutherland1993k and references therein), which have been assigned to the Afton Lodge Clay Formation by Merritt et al. (Reference Merritt, Akhurst, Wilkinson, Riding, Phillips, Smith, Finlayson and Dean2014). They comprise weakly laminated to massive, stiff, calcareous mud containing sparse shells, foraminiferids, ostracods, fish debris and echinoid spines. The generally well-dispersed pebbles include Carboniferous sandstone, coal and basalt together with more far-travelled crystalline ‘Highland' rock types. The shelly clay contains abundant marine macro- and micro-fauna, as well as palynomorphs consistent with its deposition within a shallow marine to estuarine environment. Faunal changes within the main body of marine clay record at least one millennial-scale cycle of Arctic-boreal, to boreal, and back to Arctic-boreal climatic conditions (Merritt et al. Reference Merritt, Akhurst, Wilkinson, Riding, Phillips, Smith, Finlayson and Dean2014). A radiocarbon date of >41 14C ka BP obtained from the foraminifera indicates that these marine clays are older than the surrounding till (Merritt et al. Reference Merritt, Akhurst, Wilkinson, Riding, Phillips, Smith, Finlayson and Dean2014).
The location of Afton Lodge suggests that the rafts were transported at least 10km from their likely source within the Firth of Clyde basin, prior to being accreted at between 70 and 82m OD (Merritt et al. Reference Merritt, Akhurst, Wilkinson, Riding, Phillips, Smith, Finlayson and Dean2014). The rafts of shelly clay, together with closely associated bodies of ‘shelly till', which were possibly formed mainly by the attenuation and crushing of other rafts during their transport within the subglacial deforming bed (cf. Aber Reference Aber1985), were emplaced during an early phase of the LGM glaciation of Scotland by ice flowing from the western Grampian Highlands of Scotland. This ice flowed through the topographically confined Firth of Clyde basin where it probably detached the blocks of unfrozen marine sediment prior to splaying-out onshore against reversed slopes, leading to subsequent raft emplacement and creation of closely associated ribbed moraine (Merritt et al. Reference Merritt, Akhurst, Wilkinson, Riding, Phillips, Smith, Finlayson and Dean2014). The transport of the rafts was probably facilitated by the development of water-lubricated décollement surfaces along their margins (cf. Phillips & Merritt Reference Phillips and Merritt2008).
5.4.3. Regional interpretation
The published literature (Sissons Reference Sissons1967a; Price Reference Price1983; Rose & Letzer Reference Rose and Letzer1977; Sutherland 1984; Sutherland & Gordon 1993e; Rose & Smith Reference Rose and Smith2008; Finlayson Reference Finlayson2012; Finlayson et al. Reference Finlayson, Merritt, Browne, Merritt, McMillan and Whitbread2010, Reference Finlayson, Fabel, Bradwell and Sugden2014), together with the numerical ice sheet model of Hubbard et al. (Reference Hubbard, Bradwell, Golledge, Hall, Patton, Sugden, Cooper and Stoker2009), indicate that ice initially advanced into the area from the NW (Figs 27a, 29a). The ice front generally advanced against reverse slopes leading to the widespread formation of ribbed moraine perpendicular to flow (Finlayson et al. Reference Finlayson, Merritt, Browne, Merritt, McMillan and Whitbread2010; Hughes et al. Reference Hughes, Clark and Jordan2010; Fig. 30). That landforms from such an early stage of glaciation could survive is supported by the preservation of Middle Devensian deposits, such as at Sourlie and Bishopbriggs. Merritt et al. (Reference Merritt, Akhurst, Wilkinson, Riding, Phillips, Smith, Finlayson and Dean2014) conclude that the rafts of Afton Lodge Clay were detached and entrained into the deforming layer beneath the ice at this stage as it advanced from the Firth of Clyde basin SE towards Nith Bridge, near New Cumnock (Sutherland 1993g; Fig. 30), and S to Stranraer, the most southerly known occurrence of shelly diamicton in Scotland (Phillips et al. Reference Phillips, Everest and Diaz-Doce2009; Peacock & Everest Reference Peacock and Everest2016). The advance of ice into the Clyde basin resulted in ponding (Price Reference Price1975) and the ribbed moraine may have been initiated locally as ice-marginal sediment ridges generated by folding and thrusting (McMillan & Browne Reference McMillan and Browne1983; Finlayson Reference Finlayson2012).
Sustained stadial conditions at the LLGM (30–25cal ka BP) resulted in the development of an ice divide over the Firth of Clyde basin, beneath which there was minimal subglacial erosion and landscape modification. Once ice had become sufficiently thick to overtop the main Clyde–Forth drainage divide, a wide corridor of fast-flowing ice flowed E towards the Firth of Forth forming drumlins (Rose Reference Rose, Menzies and Rose1987; Rose & Smith Reference Rose and Smith2008; Finlayson Reference Finlayson2012), striae (Paterson et al. Reference Paterson, McAdam and MacPherson1998) and a train of essexite erratics that were dispersed from their source near Lennoxtown at the foot of the Campsie Fells N of Glasgow (Peach Reference Peach1909; Shakesby 1978) (Figs 27b, 29b). A significant dispersal centre had developed over the Southern Uplands by this stage, contributing to deflection of ice in the Clyde basin towards the NE. This flow formed streamlined bedforms and deposited till of Southern Uplands provenance on shelly diamictons (Eglington Shelly Till) at Nith Bridge (Holden & Jardine Reference Holden, Jardine and Jardine1980; Sutherland 1993e; Fig. 30).
A broad belt of streamlined bedforms in rock, striae and drumlins carved into the earlier-formed ribbed moraine indicate convergent flow into the outer Firth of Clyde basin (Rose & Letzer Reference Rose and Letzer1977; Finlayson Reference Finlayson2012; Finlayson et al. Reference Finlayson, Fabel, Bradwell and Sugden2014; Fig. 27c). This phase clearly followed a major change in the ice sheet configuration that probably resulted from enhanced marine drawdown to the W, initiating an eastward migration and substantial lowering of the ice divide (Figs 27c, 29c). This glacial reorganisation probably eventually reduced the power of eastward flow towards the Firth of Forth and resulted in the relatively early deglaciation of eastern Scotland (Sissons Reference Sissons1967a, Reference Sissonsb; Sutherland 1984). An intermediate phase probably occurred when ice covering the Southern Uplands was scavenged and drawn down to the W around the S of Arran, as indicated by the westward transportation of microgranite erratics derived from the island of Ailsa Craig, off the SW Scottish coast (Sissons Reference Sissons1967a; Fig. 27c).
Following substantial thinning and local deglaciation, a subsequent change in ice sheet configuration is indicated in the E of the region by a suite of landforms including local E-trending subglacial bedforms, eastward-descending ice-marginal meltwater channels and suites of ice-contact glaciofluvial landforms (including the Chapelton Moraine Belt) (Finlayson et al. Reference Finlayson, Merritt, Browne, Merritt, McMillan and Whitbread2010; Clark et al. Reference Clark, Hughes, Greenwood, Jordan and Sejrup2012a; Finlayson Reference Finlayson2012; Fig. 30). Collectively, they demonstrate ice-divide migration back towards the W, coupled with probable thickening of ice located over the Firth of Clyde basin (Finlayson Reference Finlayson2012; Finlayson et al. Reference Finlayson, Fabel, Bradwell and Sugden2014; Fig. 27d). The Highland and Southern Uplands ice caps subsequently separated across southern parts of the Clyde Basin in the vicinity of the Carstairs Eskers (Finlayson Reference Finlayson2012; Fig. 29d), supporting the conclusion of Thomas & Montague (Reference Thomas and Montague1997) and Huddart & Bennett (Reference Huddart and Bennett1997) that this well-documented esker system (Gordon Reference Gordon, Gordon and Sutherland1993l), and others nearby (Bennett et al. Reference Bennett, Huddart, Thomas, Hambrey, Christoffersen, Glasser and Hubbard2007), developed in an interlobate sediment sink during uncoupling of northern- and southern-sourced ice caps. The configuration is roughly that proposed for the supposed ‘Perth Readvance' in central Scotland (Sissons Reference Sissons1963, Reference Sissons1964, Reference Sissons1967a, Reference Sissonsb), when the upper catchment of the River Clyde drained eastwards into that of the River Tweed (Shaw & Merritt 1981). A minor readvance of Southern Uplands ice is apparent in the Ayr valley near Greenock Mains (Fig. 30) where the orientation of a nested assemblage of meltwater channels and moraine ridges indicates a late NE advance (Holden & Jardine Reference Holden, Jardine and Jardine1980). Ice-marginal ponding first began on the watershed between the catchments of the NE-flowing Avon Water and the W-flowing River Irvine, in Glengavel (Figs 29d, 30), where thick sequences of laminated glaciolacustrine silt coarsen upwards into deltaic sand and gravel occur up to an elevation of at least 205m OD (Nickless et al. Reference Nickless, Aitken and McMillan1978).
A phase of more active and widespread streamlining towards the E and SE accompanied the final phase of ice sheet thinning in the region (Fig. 29e). One or more significant ice-front oscillations occurred late during deglaciation. The streamlined bedforms assigned to this phase terminate abruptly in the vicinity of the Kilmarnock and Blantyreferme moraine complexes (Fig. 30), to the E of which suites of glaciolacustrine and deltaic sediments were laid down in the Clyde and Irvine valleys (Fig. 29e). Water previously ponded only within upper parts of the Avon Valley eventually merged with a much larger lake, ‘Glacial Lake Clydesdale' (Bell Reference Bell1871), which occupied the Clyde valley and its tributaries upstream of Glasgow (Fig. 29e). Paterson et al. (Reference Paterson, McAdam and MacPherson1998) deduced that the level of Lake Clydesdale dropped in stages as the NW retreat of the ice margin in the lower Clyde Valley made available spillways to the E at progressively lower elevations of 200, 165, 102 and 85m OD, respectively. The lake finally drained E via a col in the upper Kelvin valley, NE of Glasgow, at about 45m OD (Forsyth et al. Reference Forsyth, Hall and McMillan1996; Hall et al. Reference Hall, Browne and Forsyth1998).
Lake Clydesdale probably existed during the creation of the ‘Main Perth Shoreline' in the Forth estuary (Sissons & Smith Reference Sissons and Smith1965; Sutherland 1984), and possibly into the beginning of the Lateglacial Interstadial (GI-1) (Peacock Reference Peacock1999, Reference Peacock and Evans2003). The timing, contemporary sea level and manner in which the Late-glacial sea eventually invaded Lake Clydesdale is disputed (see Peacock Reference Peacock and Evans2003 for review), but it is generally accepted that the transgression had occurred by 13.1–12.5 14C ka BP (based on uncorrected, reported ages from marine shells) (Peacock Reference Peacock1971, Reference Peacock and Evans2003; Browne et al. Reference Browne, Harkness, Peacock and Ward1977; Peacock et al. Reference Peacock, Graham, Robinson, Wilkinson, Gray and Lowe1977; Rose Reference Rose and Evans2003). Eventual disintegration of ice blocking the Clyde estuary resulted in the level of Lake Clydesdale falling from 45m to no less than 40m, the contemporaneous sea level (Peacock Reference Peacock and Evans2003). Later stages in the deglaciation to the W of Glasgow have been deduced by Finlayson et al. (Reference Finlayson, Fabel, Bradwell and Sugden2014) (Section 5.3).
5.5. Solway Lowlands
A review of the complex lithostratigraphical and geomorphological record of the last glaciation within the Solway Lowlands and surrounding areas has been given by Livingstone et al. (Reference Livingstone, Evans, O'Cofaigh, Davies, Merritt, Huddart, Mitchell, Roberts and Yorke2012), who identify seven distinct sets of glacially streamlined features relating to six stages of glaciation (Fig. 31). The oldest known unit on the Scottish side of the border is the Chapelknowe Till Formation (McMillan et al. Reference McMillan, Merritt, Auton and Golledge2011b; Table 14), which was possibly laid down during an ‘Early Advance' of Scottish ice across the Solway Firth, up the Vale of Eden and through the Stainmore Gap into eastern England (Trotter Reference Trotter1929; Hollingworth Reference Hollingworth1931; Trotter & Hollingworth Reference Trotter and Hollingworth1932b; Evans et al. Reference Evans, Clark and Mitchell2005; Stone et al. Reference Stone, Millward, Young, Merritt, Clarke, McCormac and Lawrence2010; Mitchell Reference Mitchell, Waltham and Lowe2013; Ballantyne & Small Reference Ballantyne and Small2018; Fig. 31a). The till contains a suite of Southern Uplands erratics, including Criffel and Dalbeattie granite and greywacke. The Chapelknowe Till is overlain locally by the ‘Middle Sands' of a ‘tripartite' sequence that occurs around Gretna, pinching out just E and S of Carlisle (Trotter & Hollingworth Reference Trotter and Hollingworth1932a). This middle unit is now assigned to the Plumpe Farm Sand and Gravel Formation, which is capped by a thin ‘upper' red diamicton, the Plumpe Bridge Till Member of the Gretna Till Formation (McMillan et al. Reference McMillan, Merritt, Auton and Golledge2011b). The widespread red, sandstone-rich Gretna Till was laid down by ice flowing from the W as indicated by its composition and the predominant orientation of drumlins across the lowlands N of the inner Solway Firth (Livingstone et al. Reference vingstone, Ó Cofaigh and Evans2008; McMillan et al. Reference McMillan, Merritt, Auton and Golledge2011b; Fig. 3b). Relatively little ice flowed into the lowlands from the Langholm Hills, to the N, as revealed by the distribution of the greywacke-rich Langholm Till Formation (British Geological Survey 2005, 2006; Fig. 3b).
Reconstructed stages (A–F) of glaciation around the Solway Firth (from Livingstone et al. Reference Livingstone, Evans, O'Cofaigh, Davies, Merritt, Huddart, Mitchell, Roberts and Yorke2012, trimmed and with minor modification). (Reprinted from Earth-Science Reviews, 111, 25–55, Livingstone, S. J., Evans, D. J. A., O'Cofaigh, C., Davies, B. J., Merritt, J. W., Huddart, D., Mitchell, W. A., Roberts, D. H. & Yorke, L., Glaciodynamics of the central sector of the last British-Irish Ice Sheet in Northern England. Copyright (2012), with permission of Elsevier.) Dashed-dotted lines refer to ice divides (with the thick dotted lines indicating possible ice-saddles) and the arrows indicate ice-flow vectors (dotted arrows indicate alternative ice-flow scenarios). Hill-shaded surface model built from Intermap Technologies NEXTMap Britain elevation data.

Summary of events in the Solway Lowlands. Stages and estimated ages after Livingstone et al. (Reference Livingstone, Evans, O'Cofaigh, Davies, Merritt, Huddart, Mitchell, Roberts and Yorke2012) and Chiverrell et al. (Reference Chiverrell, Smedley, Small, Ballantyne, Burke, Callard, Clark, Duller, Evans, Fabel, van Landeghem, Livingstone, Ó Cofaigh, Thomas, Roberts, Saher, Scourse and Wilson2018). Abbreviations: B=glacial ‘binge'; I=Interglacial; P=glacial ‘purge'.

The occurrence of red, granite-bearing till (unnamed) passing upwards into rubbly, greywacke-rich till in the Langholm Hills indicates that ice overwhelmed the area from the W during an early phase of the last glaciation (Lumsden et al. Reference Lumsden, Tulloch, Howells and Davies1967; McMillan et al. Reference McMillan, Merritt, Auton and Golledge2011b). NEXTMap imagery of the Langholm Hills reveals that this region of the Southern Uplands has been relatively little modified by glacial erosion because it was a minor ice-dispersal centre and probably overlain by mainly sluggish, cold-based ice (Fig. 31a). A minor, southward readvance of ice from the Langholm Hills occurred following the separation of ice masses during deglaciation (Lumsden et al. Reference Lumsden, Tulloch, Howells and Davies1967), laying down rubbly diamicton of the Mouldy Hills Moraine Formation (British Geological Survey 2006). Although the Gretna and Chapelknowe till formations have not been mapped to the E of the Langholm Hills, sandstone and granite-bearing red tills including a suite of glacial erratics sourced in the Galloway Hills have been recorded there, high on the catchment divide (Day Reference Day1970). Together with new evidence from NEXTMap and satellite imagery revealing elongate, glacially streamlined landforms arcing NNE towards the divide (Livingstone et al. Reference vingstone, Ó Cofaigh and Evans2008; McMillan et al. Reference McMillan, Merritt, Auton and Golledge2011b; Fig. 31a), this suggests that transfluence of ice may have occurred into the catchment of the Tweed at the LGM.
The Plumpe Bridge Till has been connected with the late-stage ‘Scottish Readvance' into the Solway Lowlands (Dixon et al. Reference Dixon, Maden, Trotter, Hollingworth and Tonks1926; Trotter & Hollingworth Reference Trotter and Hollingworth1932a; Huddart Reference Huddart, Ehlers, Gibbard and Rose1991; Merritt & Phillips Reference Merritt, Phillips, Livingstone, Evans and Ó Cofaigh2010). Indeed, the thin and laterally discontinuous nature of the till probably results from a short-lived advance across water-saturated sediment adjacent to proglacial lakes dammed up against higher ground to the E of the ice (Phillips et al. Reference Phillips, Merritt, Auton and Golledge2007) (Fig. 31f). The ‘Middle Sands' were considered to have formed proglacially in, and around, ‘Glacial Lake Carlisle' following partial deglaciation of the Solway Lowlands (Dixon et al. Reference Dixon, Maden, Trotter, Hollingworth and Tonks1926; Trotter & Hollingworth Reference Trotter and Hollingworth1932a). This interpretation has been confirmed by the identification in the Caldew Valley, SW of Carlisle, of a sequence of laminated mud deposited in a pro-glacial lake (Livingstone et al. Reference Livingstone, Ó Cofaigh, Evans and Palmer2010a, Reference Livingstone, Evans and Ó Cofaighb; Fig. 31b). These varved sediments (Blackhall Wood Glaciolacustrine Formation), which are also overlain by a reddish-brown ‘upper till' that includes mixed Scottish, Lake District and local clasts, are now assigned to the Blackhall Wood/Gosforth Oscillation (Livingstone et al. Reference Livingstone, Evans and Ó Cofaigh2010b, Reference Livingstone, Ó Cofaigh and Evansc, Reference Livingstone, Evans, O'Cofaigh, Davies, Merritt, Huddart, Mitchell, Roberts and Yorke2012; Ballantyne & Small Reference Ballantyne and Small2018).
Evidence for a subsequent, minor readvance of Scottish ice includes a striated boulder pavement that is intermittently exposed at low tide W of Powfoot (Brookfield et al. Reference Brookfield, Merritt, McMillan, Livingstone, Evans and Cofaigh2010; Merritt Reference Merritt, Livingstone, Evans and Ó Cofaigh2010). The pavement consists of a single layer of interlocking, ice-bevelled boulders composed predominantly of wacke sandstone with some red Triassic sandstone and sparse granodiorite derived from Criffell, some 15km to the W. The boulders have smoothed and striated upper surfaces and both the long axes of the boulders and the striations show a consistent WNW–ESE alignment. The simplest explanation is that the pavement formed subglacially beneath wet-based ice that flowed ESE across previously deposited till and glaciofluvial deposits. The presence of granodiorite boulders from Criffell in diamicton locally overlying the pavement, but not below it, is compatible with a late-stage readvance of ice that splayed out into the Solway Firth from valleys to the N.
The age, regional correlations and integrity of the Scottish Readvance have been controversial (Merritt & Auton Reference Merritt and Auton2000; Evans et al. Reference Evans, Clark and Mitchell2005; Livingstone et al. Reference Livingstone, Evans, O'Cofaigh, Davies, Merritt, Huddart, Mitchell, Roberts and Yorke2012), but many issues have been resolved recently following new geochronological, offshore geophysical and stratigraphical evidence collected from around the northern Irish Sea Basin (Chiverrell et al. Reference Chiverrell, Smedley, Small, Ballantyne, Burke, Callard, Clark, Duller, Evans, Fabel, van Landeghem, Livingstone, Ó Cofaigh, Thomas, Roberts, Saher, Scourse and Wilson2018). The latter authors constrain the event to 19.2–18.2ka and demonstrate it to be a significant regional readvance across the Isle of Man and Cumbrian lowlands. It probably correlates with the Gosforth Oscillation that affected the W Cumbrian coast (Trotter et al. Reference Trotter, Hollingworth, Eastwood and Rose1937; Merritt & Auton Reference Merritt and Auton2000; Livingstone et al. Reference Livingstone, Evans, O'Cofaigh, Davies, Merritt, Huddart, Mitchell, Roberts and Yorke2012) and the Clogher Head Readvance at the coast of County Down, in Northern Ireland (McCabe et al. Reference McCabe, Clark, Smith and Dunlop2007a, Reference McCabe, Clark, Clark and Dunlopb; Clark et al. Reference Clark, McCabe, Bowen and Clark2012b; Merritt et al. Reference Merritt, Roberson and Cooper2018).
5.6. East Central Lowlands, Tayside, Fife and the Borders
In the apparent absence of new, comprehensive field studies in eastern Scotland, McMillan et al. (Reference McMillan, Hamblin and Merritt2011a) assigned existing stratigraphic units to their lithostratigraphic framework (Fig. 3b). Given the historical importance of this region (Sutherland 1993i, j), and particularly the Lothians and Borders (Gordon Reference Gordon, Gordon and Sutherland1993m), it merits detailed reinvestigation, for example in the context of recent understanding of ice-flow-pattern evolution and palaeo-ice streams (Everest et al. Reference Everest, Bradwell and Golledge2005; Golledge & Stoker Reference Golledge and Stoker2006; Hughes et al. Reference Hughes, Clark and Jordan2014; Livingstone et al. Reference Livingstone, Roberts, Davies and Evans2017). For example, the results of mapping in the valley of the Kale Water, W of the Cheviot Hills, revealed that this upland area lay beneath a cold-based, frozen patch to the E of a thermal boundary related to the Tweed ice stream (Mitchell Reference Mitchell2008; Fig. 31). In the past 15 years, superficial deposits have been mapped by BGS in the Borders (around Duns and Moffat), central Galloway, Montrose and Crieff, but no descriptive and interpretive accounts have been written.
A digital dataset of over 100,000 boreholes that penetrate the full thickness of Quaternary deposits in the Central Lowlands has been utilised in a recent study of ‘buried' valleys and their infills (Kearsey et al. Reference Kearsey, Lee, Finlayson, Garcia-Bajo and Irving2018). The study identified 18 buried palaeo-valleys in the region ranging from 4 to 36km in length and from 24 to 162m in depth, some cross-cutting one another. The deepest features are orientated WSW–ENE beneath the Kelvin valley, NE of Glasgow (Browne & McMillan Reference Browne and McMillan1989), the Carron valley, farther to the ENE between Falkirk and Grangemouth (Browne et al. Reference Browne, Graham and Gregory1984; Cameron et al. Reference Cameron, Aitken, Browne and Stephenson1998; Browne Reference Browne2011), and the Devon valley at the foot of the Ochil Hills, to the E of Stirling (Parthasarathy & Blyth Reference Parthasarathy and Blyth1959). These palaeo-valleys all have undulating longitudinal profiles and are interpreted as tunnel valleys (cf. Kehew et al. Reference Kehew, Piotrowski and Jørgensen2012) formed during the LGM (Kearsey et al. Reference Kearsey, Lee, Finlayson, Garcia-Bajo and Irving2018). The shallower features are generally aligned with ice flow during ice sheet retreat.
6. Advances and setbacks over the past 25 years in understanding the terrestrial stratigraphic record of the last glacial cycle in Scotland
6.1. Advances
Progress in the last 25 years has been facilitated by a number of developments.
The application of a systematic approach to lithostratigraphy (Sutherland 1999; McMillan et al. Reference McMillan, Hamblin and Merritt2011a) has enabled a more rigorous framework for the recognition and correlation of Pleistocene deposits.
Advances in dating techniques have improved understanding and timing of events and the development of a rigorous chronostratigraphy. Refinements in radiocarbon dating through the use of accelerator mass spectrometry have enabled the application to smaller samples and reduced the error limits on older material pre-dating the last glaciation (e.g., Bos et al. Reference Bos, Dickson, Coope and Jardine2004; Brown et al. Reference Brown, Rose, Coope and Lowe2007; Jacobi et al. Reference Jacobi, Rose, MacLeod and Higham2009). Recognition of natural variations in the atmospheric concentration of radiocarbon through time and the development of calibration methods to a common calendar timescale have greatly enhanced the comparability and interpretation of dates (Reimer et al. Reference Reimer, Bard, Bayliss, Beck, Blackwell, Bronk Ramsey, Buck, Cheng, Edwards, Friedrich, Grootes, Guilderson, Haflidason, Hajdas, Hatté, Heaton, Hoffmann, Hogg, Hughen, Kaiser, Kromer, Manning, Niu, Reimer, Richards, Scott, Southon, Staff, Turney and van der Plicht2013). Although there have been limited applications in Scotland, improvements in luminescence dating and amino acid geochronology have helped clarify Ipswichian and Early Devensian chronostratigraphy, particularly in NE Scotland and around Inverness (e.g., Merritt Reference Merritt1992; Duller et al. Reference Duller, Wintle and Hall1995; Hall et al. Reference Hall, Gordon, Whittington, Duller and Heijnis2002). Surface exposure dating using terrestrial cosmogenic nuclides has greatly advanced understanding of the timing, sequence and pattern of the last ice sheet glaciation (Ballantyne & Small Reference Ballantyne and Small2018 and references therein).
The use of satellite imagery and digital surface models derived from remote sensing, and particularly NEXTMap Britain topographic dataset, has progressed geomorphological mapping and morphostratigraphy (Chandler et al. Reference Chandler, Lovell, Boston, Lukas, Barr, Benedicktsson, Benn, Clark, Darvill, Evans, Ewertowski, Loibl, Margold, Otto, Roberts, Stokes, Storrar and Stoeven2018). It has enabled the recognition of multiple sequential ice-flow patterns during the life of the last BIIS indicated by superimposed glacial lineations (e.g., Salt & Evans Reference Salt and Evans2004; Golledge & Stoker Reference Golledge and Stoker2006; Hughes et al. Reference Hughes, Clark and Jordan2014) and has considerably improved knowledge of glaciation during the Younger Dryas (Ballantyne Reference Ballantyne and Small2018; Bickerdike et al. Reference Bickerdike, Ó Cofaigh, Evans and Stokes2018).
3D modelling based on borehole data has helped understanding of the architecture of layered sedimentary sequences (e.g., Finlayson Reference Finlayson2012; Kearsey et al. Reference Kearsey, Lee, Finlayson, Garcia-Bajo and Irving2018). When combined, the use of lithostratigraphy, geomorphological mapping, 3D modelling and geochronometry has proved a powerful combination in elucidating the dynamics and pattern of decay of the last ice sheet (Finlayson et al. Reference Finlayson, Merritt, Browne, Merritt, McMillan and Whitbread2010, Reference Finlayson, Fabel, Bradwell and Sugden2014).
The significant progress in mapping and dating offshore landforms and sediments reviewed by Stewart et al. (Reference Stewart, Carter, Dove, Stewart, Green, Cooper, Cotterill and Gafeira2019) has provided a more extended lithostratigraphic and chronostratigraphic framework in which to set the incomplete terrestrial record. Ice sheet modelling (e.g., Boulton & Hagdorn Reference Boulton and Hagdorn2006; Hubbard et al. Reference Hubbard, Bradwell, Golledge, Hall, Patton, Sugden, Cooper and Stoker2009) has also highlighted the highly dynamic nature of the last ice sheet and provided further context for interpreting the stratigraphic record.
6.2. Constraints
Progress has been hampered by a decline in stratigraphic studies, arising from a number of factors.
There has been a shift in research away from regional studies of glacial deposits and landforms based around detailed field survey, mapping and logging of sections to more systematic, desk-based, remote sensing studies and analysis of digital topographic imagery. While the latter have produced important new results, particularly at regional and national scales, the two approaches must be complementary.
Few new important natural sections have been discovered and then described. This has been compounded by the end of open-cast coal mining, the opening of fewer small gravel pits and increasingly stringent restrictions being applied to access resulting from more rigorous health and safety legislation. Meanwhile, many former sections have been lost to development, infilling, land restoration or natural degradation. There has also been an absence of resources (human and financial) for routine logging of exposures arising from construction and infrastructure projects (e.g., roads, pipelines, power lines, run-of-river hydro schemes and forestry and wind farm access routes) and for re-excavation of former sections that are now degraded. New excavations typically involve ‘cut and cover', so that exposures are largely temporary.
6.3. Next steps
Significant advances have been made in elucidating the pattern and timing of deglaciation, but these results have yet to be integrated into numerical ice sheet models in order to test how closely computer simulations match litho- and morph-stratigraphic records. Successful tests would give confidence that model design replicated ice sheet behaviour and so offer the promise of using improved models as frameworks in which to piece together the much more fragmentary records of events during and before the LGM.
Despite the huge step forward that the Natural Environment Research Council (NERC)-funded BRITICE-CHRONO consortium has made in dating events during deglaciation, further dating is needed, including the application of luminescence, radiocarbon and cosmogenic methods. However, it is suggested that the focus of dating should now switch towards the LGM and older events. That could usefully include attempting to extend the Scottish varve chronology back beyond the Younger Dryas (McLeod et al. Reference McLeod, Palmer, Lowe, Rose, Bryant and Merritt2011). This, for example, could begin with detailed examination, targeted drilling and sampling of known exposures of laminated glaciolacustrine clay concealed beneath till, such as in the Solway Lowlands (Livingstone et al. Reference Livingstone, Ó Cofaigh, Evans and Palmer2010a, Reference Livingstone, Evans and Ó Cofaighb), the Irvine valley upstream of Kilmarnock and around Glasgow (Finlayson et al. Reference Finlayson, Merritt, Browne, Merritt, McMillan and Whitbread2010), in the catchment of the Ugie Water, in eastern Buchan (Merritt et al. Reference Merritt, Auton, Connell, Hall and Peacock2003) and near Grantown-on-Spey (Merritt et al. Reference Merritt, Merritt, Bradwell, Merritt, Auton and Phillips2017e). More cosmogenic ages on bedrock are required; for example, on glacially roughened and streamlined bedrock forms in order to help establish rates of glacial erosion, check for cosmogenic inheritance and attempt to date glacial lineations formed before the LGM. Attempts could also be made to date shore platforms covered by till (Smith et al. Reference Smith, Barlow, Bradley, Firth, Hall, Jordan and Long2018). However, any new work should involve detailed lithostratigraphy as morphostratigraphy alone is of limited value for sediment sequences. Long-term programmes of section logging during major construction projects are required together with sampling boreholes.
The coverage of detailed litho- and morph-stratigraphic investigations remains patchy. Large parts of Sutherland, Easter Ross, the Outer Hebrides, the Eastern Grampians, Angus, Lothian, the Borders and the Tweed catchment lack recent published work. We observe that the focus of BRITICE-CHRONO and recent dating has been on glacial environments and specifically on ice limits. Relatively little attention has been given to Late Pleistocene non-glacial environments during the last 25 years. For example, there are readily accessible exposures of glacially transported rafts of marine and glaciomarine sediment, raised beaches on Lewis, Barra and Vatersay, Hoy and Kintyre, and buried periglacial soils and structures in Buchan and elsewhere. Old records of organic remains, including peat and bones found below, or within the Wilderness Till in the central lowlands (Sutherland 1984), represent targets for new studies.
7. Conclusions
Our knowledge of the sequence of events that have occurred during the last glacial–interglacial cycle in Scotland has vastly improved over the past 25 years, with ten or more separate events now identified in some regions. Research has benefitted from the development and application of a systematic approach to lithostratigraphy, digital surface models, glaciological models and new dating methods, combined with access to offshore seabed mapping, geophysical datasets and sediment core records. This has enabled a more rigorous spatial and temporal framework to be developed for the differentiation and correlation of terrestrial Late Pleistocene deposits.
Few new critical sites pre-dating the Late Devensian have become available, but further research on several existing sites from Shetland and NE Scotland has clarified aspects of Ipswichian (MIS 5e) and Early Devensian (MIS 5d-4) events and environments. New offshore evidence has become available that indicates ice sheet glaciation of Scotland during both the Early Devensian (MIS 4) and the Middle Devensian (MIS 3) is consistent with the climate records from Greenland ice cores and the Norwegian stratigraphic record. However, the terrestrial stratigraphic record in Scotland for MIS 4 and MIS 3 is poorly resolved in space and time.
The greater part of the terrestrial evidence apparently relates to the Late Devensian (MIS 2) and broadly accords with recent computer reconstructions of the last BIIS (Boulton & Hagdorn Reference Boulton and Hagdorn2006; Hubbard et al. Reference Hubbard, Bradwell, Golledge, Hall, Patton, Sugden, Cooper and Stoker2009). However, many truncated units of till occurring locally towards the base of glacigenic sequences are undated and could be older, like many ice-moulded landforms. The last ice sheet clearly was dynamic and probably reached its greatest thickness between 30 and 27ka, during the local LGM (Ballantyne & Small Reference Ballantyne and Small2018; Fig. 1). The ice sheet had two modes of flow-pattern geometry: an early, thick (relative to topography) integrated one with a relatively simple ice-divide structure, and a later, much thinner mode of ice sheet comprising multiple dispersion centres and a more complex flow structure (Hughes et al. Reference Hughes, Clark and Jordan2014). The changing flow patterns are reflected in the lithostratigraphy. The ice sheet was episodically warm-based and erosive, but the pattern of warm-based flow was spatially variable. One former hypothesis firmly rebutted is that there were ice-free enclaves at the LGM in Scotland; there were none. The overall picture emerging is that a dynamic glacial system, highly sensitive to climate change drivers, existed in Scotland throughout much of the Devensian, but the terrestrial record so far as known remains incomplete. Nevertheless, terrestrial stratigraphy in its various forms (litho-, chrono- and morpho-stratigraphy) will continue to be a benchmark for constraining the pattern and timing of events during the Late Pleistocene in Scotland.
The enigmatic ‘high-level' shelly clay deposits located around the Scottish coast (Sutherland & Gordon 1993a) are now all interpreted as glacially transported rafts of marine sediment rather than remnant in situ deposits formed during periods of high RSL before the Last glaciation (Sutherland 1981). Localities include Afton Lodge, in Ayrshire (Merritt et al. Reference Merritt, Akhurst, Wilkinson, Riding, Phillips, Smith, Finlayson and Dean2014), other localities around the coasts of the Firth of Clyde and Kintyre (Finlayson et al. Reference Finlayson, Merritt, Browne, Merritt, McMillan and Whitbread2010, Reference Finlayson, Fabel, Bradwell and Sugden2014), the Rhins of Galloway (Peacock & Everest Reference Peacock and Everest2016), Clava, near Inverness (Merritt Reference Merritt1992), sites along the southern coast of the Moray Firth (Merritt et al. Reference Merritt, Auton, Connell, Hall and Peacock2003) and the North Sea coast of the Grampian Highlands (Auton et al. Reference Baden-Powell2000). Much of the controversy has centred on the local field evidence of ice flow, which Sutherland (1981) concluded to be generally offshore rather than onshore as required in the rafting model. However, the subsequent research has shown that an early phase of onshore flow did indeed take place at all known sites.
Several areas offer opportunities and challenges to address current gaps in understanding. First, improvements in dating methods and their novel applications are crucial, particularly to older deposits pre-dating the LGM. They include luminescence applications, revival of AAR dating, cosmogenic radionuclide (CRN) dating and development of new techniques. Second, digital surface models provide opportunities for refinements of morphostratigraphy and developing closer links with lithostratigraphy. Third, more detailed till provenance studies may help to clarify directions of ice movement, distances of ice transport and sediment recycling, ice movement indicators and rafting, recognising that the simple law of superposition does not always apply. Fourth, further applications of 3D modelling based on borehole data in combination with lithostratigraphy and geomorphological mapping should provide new opportunities to elaborate on the dynamics and pattern of decay of the last ice sheet. Fifth, detailed field mapping is required of the geomorphology and superficial deposits in key areas that have been overlooked in recent decades (e.g., the Lothians and Fife), supported by pit excavations and coring and links with morphostratigraphy and flow patterns from digital surface models. Sixth, studies of intermontane areas (e.g., Strathspey) and loch and sea loch basins may help to elucidate the history of mountain icefields and glaciers during periods of more restricted glaciation during the Middle Devensian. Seventh, digital modellers are now challenged to produce ice sheet reconstructions that accommodate the complex event stratigraphy that has been elucidated, particularly from recent offshore surveys.
8. Acknowledgements
Many figures incorporate NEXTMap BritainTM imagery (DSM: digital surface model; DTM: digital terrain model) courtesy of Intermap Technologies Inc., provided by NERC via the NERC Earth Observation Data Centre. AMH thanks the Carnegie Trust for the Universities of Scotland for supporting fieldwork in northern Scotland. Some of ERC's work was undertaken when in receipt of an NERC Studentship during 1977–1980 for which he is most grateful, and he would like to thank Dr Al Gemmell for his help and interest since he first worked in NE Scotland. We all thank Dr Jim Riding (BGS, Keyworth, Nottingham) for his detailed palynological analyses of tills, and Dr Douglas Peacock for information, advice and support over many years. Craig Woodward is thanked for cartographic support. Dr Wishart Mitchell and an anonymous referee are thanked for their comments and constructive suggestions on earlier drafts. Jon Merritt publishes as an Honorary Research Associate of the BGS; Adrian Hall and John Gordon as Visiting Research Associates. The authors publish with the permission of the Executive Director, BGS (NERC).