Implications
On commercial farms, the number of pigs per pen can be increased to reduce capital costs (i.e. the cost of housing) and simplify feeding management. However, increasing the number of pigs per pen limits the space allowance (surface area per pig) available for each pig. This limited space allowance can have adverse effects on multiple parameters, including growth performance, behavioral responses and health. Simultaneously, consumer groups are critical of modern animal husbandry practices that are primarily focused on increasing production and that sacrifice animal welfare. Therefore, it is necessary to determine the optimal space allowance that maximizes productivity without resulting in environmental stress due to overcrowding.
Introduction
In swine production, space allowance (surface area per pig) has an enormous impact on growth performance. Previous studies have shown that limiting the available space reduces the average daily feed intake (ADFI) and average daily gain (ADG) of pigs. Space limitations also have negative effects on the social and behavioral responses (i.e. aggressiveness) of pigs (Brumm and Miller, Reference Brumm, Ellis, Johnston, Rozeboom and Zimmerman1996; Edmonds et al., Reference Edmonds, Arentson and Mente1998; Cho and Kim, Reference Cho and Kim2011; Vermeer et al., Reference Vermeer, de Greef and Houwers2014).
In South Korea, the space allowance at each growth stage of pigs has been prescribed in accordance with the Livestock Industry Act. The Act suggests that a minimum area of 0.2, 0.30, 0.45 and 0.8 m2/pig are required for growth stages corresponding to BWs of 7 to 20, 20 to 30, 30 to 60 and 60 to 110 kg, respectively. However, these BW ranges were set without adequate experimental support and are not rational. Because these criteria are based on the area per pig, a BW of 30 to 60 or 60 to 110 kg results in a significant difference in the space allowance at the initial BW than at the final BW. The space allowance has been expressed as coefficient (κ) in the following formula: (lying) area/pig=κ×BW0.667. The space allowance at the final BW, represented by the coefficient κ, is approximately one-and-a-half times than those of initial BW. This difference could increase the negative effects of restricted space allowances over time for growing–finishing pigs. Edmonds et al. (Reference Edmonds, Arentson and Mente1998) suggests that pigs with heavier BWs are more affected by restricted space allowances. In particular, because the allowances are determined for pigs with BWs of 60 to 110 kg as a single stage, the effect of space allowance is more intensified with increasing BW.
Furthermore, restricted space allowances suppress the immune response, elevate plasma cortisol levels (an indicator of stress) and contribute to increased mortality (Arnone and Dantzer, Reference Arnone and Dantzer1980; McGlone and Curtis, Reference McGlone and Curtis1985; Oh et al., Reference Oh, Choi, Ju, Chung and Kim2010). Floor space allowances also affect aggression and stress in pigs (Barnett et al., Reference Barnett, Hemsworth, Cronin, Newman, McCallum and Chilton1992; Hemsworth et al., Reference Hemsworth, Rice, Nash, Giri, Butler, Tilbrook and Morrison2013). It is well known that acute and/or chronic stress causes a decrease in immune function (Oh et al., Reference Oh, Choi, Ju, Chung and Kim2010), and the close relationship between the activation of the immune system and the rates of feed intake and growth has also been well demonstrated (Van Heugten et al., Reference Van Heugten, Coffey and Spears1996). However, the effects of space allowance on the stress and the immune system at different growth stages have not been extensively studied.
Europe and the United States have recommended that optimal space allowances can be subdivided into seven and five different stages, respectively, depending on BW (Cho and Kim, Reference Cho and Kim2011). In South Korea, there is a need for a more rational BW-based determination of optimal space allowances for each growth stage than are provided by the currently used criteria. Thus, this experiment was designed to determine the optimal space allowance for pigs that maximizes growth performance at specific growth stages based on BW. In addition, we measured cortisol levels, as a stress marker, and immune parameters in relation to space allowances at each growth stage.
Material and methods
Animals, housing and experimental design
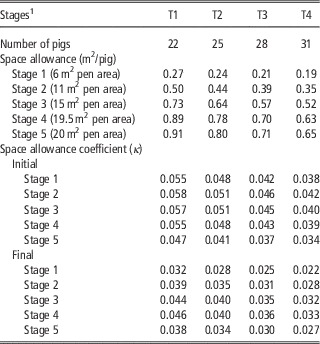
The experimental protocols describing the management and care of animals were reviewed and approved by the Animal Care and Use Committee at the National Institute of Animal Science (NIAS). A total of 1590 crossbred (Landrace×Yorkshire×Duroc) pigs were housed on a slatted floor and assigned to one of four treatment groups at each of the five growth stages (stage 1, 11 to 25 kg BW; stage 2, 25 to 45 kg BW; stage 3, 45 to 65 kg BW; stage 4, 65 to 85 kg BW; stage 5, 85 to 110 kg BW). Pen areas at each growth stage were 6, 11, 15, 19.5 and 20 m2 at stages 1 to 5, respectively. The space allowances for the four treatments at each growth stage were modified by varying the number of pigs per pen (22, 25, 28 and 31 pigs/pen), and these treatment groups were defined as T1, T2, T3 and T4, respectively. Pigs in T1 to T4 consisted of 11, 12, 14 and 15 females and 11, 13, 14 and 16 castrated males, respectively. Based on these pen sizes and the number of pigs per pen, the space allowances for pigs in T1 to T4, respectively, were as follows: 0.27, 0.24, 0.21 and 0.19 m2/pig at stage 1; 0.50, 0.44, 0.39 and 0.36 m2/pig at stage 2; 0.72, 0.64, 0.57 and 0.51 m2/pig at stage 3; 0.89, 0.78, 0.70 and 0.63 m2/pig at stage 4; and 0.91, 0.80, 0.72 and 0.65 m2/pig at stage 5. Experimental designs where space allowance is controlled by varying the number of pigs per pen is a commonly used method (Brumm and Miller, Reference Brumm, Ellis, Johnston, Rozeboom and Zimmerman1996; Edmonds et al., Reference Edmonds, Arentson and Mente1998; Brumm et al., Reference Brumm and Miller2001; Oh et al., Reference Oh, Choi, Ju, Chung and Kim2010). Previous studies have evaluated group sizes within the range 20 to 40 pigs/pen during the growing–finishing period and found no differences in growth performance (McGlone and Newby, Reference McGlone and Newby1994; Schmolke et al., Reference Schmolke, Li and Gonyou2003). To minimize the effect of group size, this experiment was designed within this range (22 to 31 pigs) and with four levels of space allowance, with a difference of three pigs per pen between treatments. There were three replicates (pens) per treatment and different pigs were used for every growth stage. Thus, 318 pigs were subjected to the trial at every growth stage. Pig numbers per pen were adjusted to maintain the same space allocation per pig if a pig died or was removed. The details of the pigs per pen, pen area, surface area per pig and the space allocation coefficient (κ) for each treatment and growth stage are presented in Table 1.
Area per pig and space allowance coefficient (κ) for each treatment

1 All stages had the same number of pigs per treatment; stage 1, 11 to 25 kg BW; stage 2, 25 to 45 kg BW; stage 3, 45 to 65 kg BW; stage 4, 65 to 85 kg BW; stage 5, 85 to 115 kg BW. The allometric expression of the space coefficient is as follows: κ=area (m2)/BW0.667 (kg).
The pigs at stage 1 were housed in a room with a controlled environment (28±1.5°C). Conditions in pens with pigs at stages 2 to 5 were automatically controlled with a heater and fan ventilation. The temperature in the pig house was set to 24°C at stage 2, and was gradually decreased from 22°C to 18°C at stages 3 to 5. Lighting was kept on a consistent 12 : 12 light : dark cycle, and relative humidity was kept at a range of 55% to 70%.
Experimental diets and growth performance
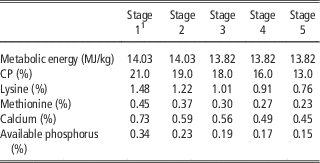
Commercial mixed feed diets formulated with corn and soybean meal were provided at each growth stage. Nutrient requirements were met or exceeded based on the Korean Feeding Standard for Swine (2012) recommendations (Table 2). All pigs had free access to feeders and water nipples. The BW and ADFI of pigs were determined at the start and end of the trial. Feed conversion ratios (FCR) were calculated using ADG and ADFI.
The chemical composition of the experimental diets

Chemical compositions are calculated based on the chemical content of the ingredients.
1 Stage 1, 11 to 25 kg BW; stage 2, 25 to 45 kg BW; stage 3, 45 to 65 kg BW; stage 4, 65 to 85 kg BW; stage 5, 85 to 115 kg BW.
Blood sampling and physiological analysis
Pigs were fasted for 12 h before blood sampling and had free access to water. Blood collection was performed at 0800 h on the last day of each growth stage. Totally, 24 castrated male pigs, randomly selected from each growth stage (two pigs per pen; three pens per treatment; four treatments per growth stage) were restrained by a loop, and blood samples (~8 ml) were then collected from the jugular vein and immediately transferred into a tube without anticoagulant. The procedure, from pig restraint to blood collection, was completed within 2 min to minimize the stress associated with blood collecting. To separate the serum, the collected blood samples were centrifuged for 15 min at 2000×g, and the serum supernatant was then stored at −70°C until analysis. Blood biochemical parameters, including serum glucose (GLU), total cholesterol (T-CHO), total protein (T-PRO), triglyceride (TG) and blood urea nitrogen (BUN) were analyzed with an Automated Clinical Analyzer (7180; Hitachi, Ibaraki, Japan). The concentrations of immunoglobulin G (IgG), cortisol and proinflammatory cytokines (tumor necrosis factor-α (TNF-α), interleukin-6 (IL-6), interleukin-1β (IL-1β)) in the serum were determined using ELISA kits (IgG, E101-104, Bethyl Laboratories Inc., Montgomery, Texas, USA; cortisol, CSB-E06811p, Cusabio Biotech Co. Ltd, Wuhan, Hubei, China; TNF-α, PTA00, R&D Systems Inc., Minneapolis, Minnesota, USA; IL-6, P6000B, R&D Systems Inc.; IL-1β, PLB00B, R&D Systems Inc.) following the manufacturer’s instructions.
Statistical analysis
All data were statistically analyzed using the GLM procedure in SPSS version 17.0. Individual pens were considered the experimental unit for the statistical analysis. The results from different treatment groups were compared using polynomial regression to model the linear and quadratic relationships between space allowance and the various parameters measured. Differences were considered significant at the level of P<0.05, and Duncan’s multiple range test (Duncan, Reference Duncan1955) was used to compare treatment means.
Results
Performance
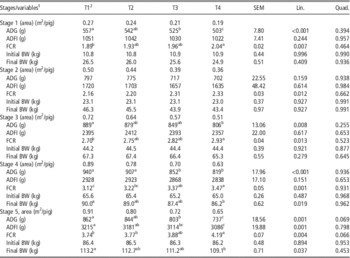
The performance results are shown in Table 3. A significant linear relationship between space allowance and ADG was observed at every growth stage (P<0.01 or 0.001), except for stage 2 (P=0.159). The observed differences in ADG between the highest (T1) and lowest (T4) space allowances were 110.7%, 113.5%, 110.3%, 114.8% and 117.0% for stages 1 to 5, respectively. The difference in ADG between T1 and T4 tended to increase as BW increased. ADFI was not significantly affected by space allowance at stages 1 to 4. However, ADFI showed a linear relationship with space allowance at stage 5 (P=0.001). The pattern of FCR was similar to the pattern for ADG. There was no significant reduction in final BW at stages 1 to 3, but there was a significant negative linear relationship between space allowance and final BW at stages 4 and 5 (P<0.05).
Effect of space allowance on growth performance at different growth stages

Lin.=linear model; Quad.=quadratic model; ADG=average daily gain; ADFI=average daily feed intake; FCR=feed conversion ratio (calculated as ADFI/ADG).
a,b,cValues within a row with different superscripts differ significantly at P<0.05.
1 Stage 1, 11 to 25 kg BW; stage 2, 25 to 45 kg BW; stage 3, 45 to 65 kg BW; stage 4, 65 to 85 kg BW; stage 5, 85 to 115 kg BW.
2 The areas were modified by varying the number of pigs per pen as follows: T1, 22 pigs/pen; T2, 25 pigs/pen; T3, 25 pigs/pen; T4, 31 pigs/pen. All treatments had three replicates.
Serum biochemical parameters
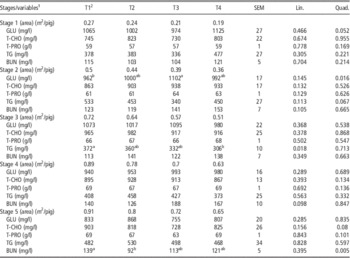
The effect of space allowance on serum biochemical parameters in pigs is shown in Table 4. Space allowance showed a linear relationship with TG at stage 3 (P<0.05). In contrast, space allowance showed a quadratic relationship with GLU at stage 2 (P<0.05) and with BUN at stage 5 (P<0.01). Other than the effects mentioned above, serum concentrations of GLU, T-CHO, T-PRO, TG and BUN were not influenced by space allowance.
Effect of space allowance on serum biochemical parameters at different growth stages

Lin.=linear model; Quad.=quadratic model; GLU=glucose; T-CHO=total cholesterol; T-PRO=total protein; TG=triglyceride; BUN=blood urea nitrogen.
a,bValues within a row with different superscripts differ significantly at P<0.05.
1 Stage 1, 11 to 25 kg BW; stage 2, 25 to 45 kg BW; stage 3, 45 to 65 kg BW; stage 4, 65 to 85 kg BW; stage 5, 85 to 115 kg BW.
2 The areas were modified by varying the number of pigs per pen as follows: T1, 22 pigs/pen; T2, 25 pigs/pen; T3, 25 pigs/pen; T4, 31 pigs/pen. All treatments had three replicates.
Serum immunoglobulin G and cortisol
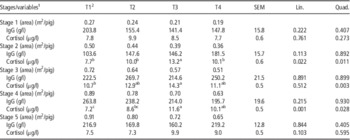
Table 5 presents the effects of different space allowances on serum IgG and cortisol levels. Serum IgG was not influenced by space allowance at any growth stage. Serum cortisol concentrations increased with decreasing space allowances at stages 2 to 5, but there was no significant difference at stage 1. The linear relationships between space allowance and serum cortisol level were 0.022, 0.001 and 0.103 at stages 2, 4 and 5, respectively. In addition, space allowance at stages 2 to 4 showed a quadratic relationship with serum cortisol (P<0.05 at stages 2 and 4; P<0.01 at stage 3). The highest cortisol concentration was observed for T3 at stages 2 to 5.
Effect of space allowance on serum cortisol and immunoglobulin G (IgG) levels at different growth stages

Lin.=linear model; Quad.=quadratic model.
a,b,cValues within a row with different superscripts differ significantly at P<0.05.
1 Stage 1, 11 to 25 kg BW; stage 2, 25 to 45 kg BW; stage 3, 45 to 65 kg BW; stage 4, 65 to 85 kg BW; stage 5, 85 to 115 kg BW.
2 The areas were modified by varying the number of pigs per pen as follows: T1, 22 pigs/pen; T2, 25 pigs/pen; T3, 25 pigs/pen; T4, 31 pigs/pen. All treatments had three replicates.
Proinflammatory cytokines
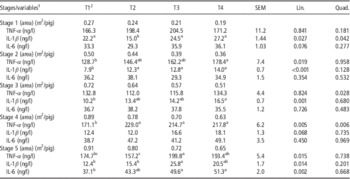
Serum proinflammatory cytokines were measured as an indicator of immune responses resulting from changes in space allowance (Table 6). Serum TNF-α levels showed a significant linear increase in pigs reared with a low space allowance in stages 2, 4 and 5, and a quadratic effect was also observed at stages 3 and 4 (P<0.05). IL-1β levels increased in response to a limited space allowance at all growth stages (linear effect: 0.027, <0.001, 0.001, 0.068 and 0.014 at stages 1 to 5, respectively). However, IL-6 was only found to have a significant relationship with space allowance at stage 5.
Effect of space allowance on serum proinflammatory cytokines at different growth stages

Lin.=linear model; Quad.=quadratic model; TNF-α=tumor necrosis factor-α; IL-1β=interleukin-1β; IL-6=interleukin-6.
a,b,cValues within a row with different superscripts differ significantly at P<0.05.
1 Stage 1, 11 to 25 kg BW; stage 2, 25 to 45 kg BW; stage 3, 45 to 65 kg BW; stage 4, 65 to 85 kg BW; stage 5, 85 to 115 kg BW.
2 The areas were modified by varying the number of pigs per pen as follows: T1, 22 pigs/pen; T2, 25 pigs/pen; T3, 25 pigs/pen; T4, 31 pigs/pen. All treatments had three replicates.
Discussion
In this study, the space allowances were adjusted by changing the number of pigs per pen. This method is common and has been used in many experiments to study the effects of space allowance on pigs (Brumm and Miller, Reference Brumm, Ellis, Johnston, Rozeboom and Zimmerman1996; Edmonds et al., Reference Edmonds, Arentson and Mente1998; Brumm et al., Reference Brumm and Miller2001; Oh et al., Reference Oh, Choi, Ju, Chung and Kim2010). However, because changing the number of pigs per pen alters the group size, it is arguable whether the results obtained from this study are due to effects of the group size or space allowance. The results of McGlone and Newby (Reference McGlone and Newby1994) suggest minimal effects of group size within the ranges of 10, 20 and 40 pigs/pen. Furthermore, Schmolke et al. (Reference Schmolke, Li and Gonyou2003) reported that group sizes of 10, 20, 40 and 80 heads/pen did not affect growth performance in growing–finishing pigs. Thus, it is unlikely that the changes in group sizes (22 to 31 pigs/pen) in this study had a significant effect on the analyzed parameters relating to growth performance and physiological indices, and therefore, we conclude that the results obtained in this study were not affected by group size.
Performance
Decreased space allowances have been associated with decreased gains (Brumm and Miller, Reference Brumm, Ellis, Johnston, Rozeboom and Zimmerman1996; Eisemann and Argenzio, Reference Eisemann and Argenzio1999). In the present study, reduced growth performance, including reduced weight gain and poor feed efficiency, in pigs reared with lower space allowances was observed. The decrease in growth performance associated with decreased space allowances was particularly evident in heavier pigs. This has also been demonstrated by Edmonds et al. (Reference Edmonds, Arentson and Mente1998), who reported that the daily gain for crowded pigs was reduced to 90.5% at the grower stage (18 to 36 kg BW) and to 76.2% at the finisher stage (91 to 127 kg BW), which may be due to the smaller space allowance coefficient for larger pigs. ADFI was not affected by changes in space allowance, except at stage 5. In contrast to the present study, previous studies have reported that limited space allowances reduce feed intake (Hanrahan, Reference Hanrahan1981; Edmonds et al., Reference Edmonds, Arentson and Mente1998). However, a study by Street and Gonyou (Reference Street and Gonyou2008) showed that even when the space allowance is decreased, feed intake does not decrease if the number of pigs per feeder remains the same. The present experiment was designed such that all pigs had free access to feeders and water nipples, which may explain why the changes in space allowance did not affect the ADFI at most stages in this study. Nevertheless, ADFI was decreased at stage 5. This result suggests that pigs with heavier BWs are more affected by reduced space allowances than are lighter pigs. Although there were no significant differences in ADFI at most stages, the decrease in ADG led to a lower final BW and an increased FCR.
Serum biochemical parameters
The biochemical assessment of blood parameters is important for evaluating the health and physiological condition of many organisms. Our experiment shows that most serum biochemical parameters are not influenced by differences in space allowance, although a few parameters showed a linear change (TG at stage 3) or a quadratic relationship (GLU at stage 2, BUN at stage 5) in response to changes in space allowance. TG, GLU and BUN are physiological markers reflecting the metabolism of lipids, insulin levels and energy use, and amino acid and nitrogen metabolism, respectively. However, the effect of changes in space allowance on serum biochemical values were not consistent among the treatments and growth stages in the present study, and unfortunately, these inconsistent results cannot be explained by this study. Blood biochemical values can be affected by various environmental and physiological factors such as age, housing, time of day, feeding time and temperature stress (Dubreuil et al., Reference Dubreuil, Couture, Farmer and Petitclerc1993). Further studies are needed to investigate the effect of space allowance on blood biochemical parameters.
Serum immunoglobulin G, cortisol and proinflammatory cytokines
Antibodies are major components of humoral immunity. IgG, which is created and released by plasma B cells, is the primary type of antibody found in the blood and extracellular fluid. Thus, blood IgG levels can be used to evaluate the humoral immune response in animals exposed to acute and/or chronic stress (Kelly, Reference Kelly1980; Morrow-Tesch et al., Reference Morrow-Tesch, McGlone and Salak-Johnson1994). The present study did not show an effect of space allowance on serum IgG levels (Table 5), which is consistent with the results of Oh et al. (Reference Oh, Choi, Ju, Chung and Kim2010). IgG’s function is to protect the body from infection by binding to various types of pathogens such as viruses, bacteria and fungi. These results suggest that animals were not affected by exogenous infections resulting from low space allowances during this experiment.
Cortisol is a glucocorticoid steroid hormone and is released in response to stress. Various stress factors such as social stress (McGlone et al., Reference McGlone, Salak, Lumpkin, Nicholson, Gibson and Norman1993), feed and water deprivation (Parrott and Misson, Reference Parrott and Misson1989), heat stress (Becker et al., Reference Becker, Nienaber, Christenson, Manak, DeShazer and Hahn1985), and restricted floor space allowances (Hemsworth et al., Reference Hemsworth, Rice, Nash, Giri, Butler, Tilbrook and Morrison2013), can increase plasma cortisol concentrations in pigs (Hicks et al., Reference Hicks, McGlone, Whisnant, Kattesh and Norman1998). Cortisol is secreted from the adrenal cortex into the blood to maintain a physiological equilibrium or homeostasis in response to the effects of an external stimulus. There was a general linear and/or quadratic response of serum cortisol concentrations in relation to restricted space allowances in the present study (Table 5). Although growth stages 1 (linear effect 0.761) and 5 (linear effect 0.103) showed no significant effect of space allowance, serum cortisol concentrations were increased by limited space allowances. In studying serum cortisol levels, it is important to collect blood quickly, painlessly and efficiently because blood collection is an additional stressor. McGlone et al. (Reference McGlone, Salak, Lumpkin, Nicholson, Gibson and Norman1993) investigated the secretion patterns of plasma cortisol during blood collection. In their study, the time from when the technicians entered the room until blood was obtained (~25 min) did not affect plasma cortisol levels. ACTH secreted from the pituitary gland stimulates the adrenal cortex, increasing the secretion of cortisol into the blood. Cook et al. (Reference Cook, Schaefer, Lepage and Jones1996) reported that serum cortisol concentrations in pigs injected with 200 IU of ACTH gradually increased and reached the highest level at 100 min after injection. In another experiment, the highest serum cortisol levels in pigs injected with lipopolysaccharide (LPS) were observed 4 h after injection (Webel et al., Reference Webel, Finck, Baker and Johnson1997). In our experiment, the overall blood collecting procedure was performed within 20 min, and the actual time for blood collection per pig was <2 min. Thus, we conclude that the increases in serum cortisol levels observed in association with restricted space allowances were not affected by handling stress or the blood collecting procedure used in the present study.
Proinflammatory cytokines such as TNF-α, IL-6 and IL-1β are potential outputs of the cellular immune system and can indirectly reflect immune responses due to the activation of T-cells (Fossum, Reference Fossum1998; Colditz, Reference Colditz2002). This study shows that a restricted space allowance increases serum proinflammatory cytokine levels, especially those of TNF-α and IL-1β (Table 6). These results suggest that the environmental stress caused by a limited space allowance can induce a cellular immune response. Excessive proinflammatory cytokines can induce fever, inflammation, tissue destruction (Murtaugh et al., Reference Murtaugh, Baarsch, Zhou, Scamurra and Lin1996), and in some cases, even shock and death (Dinarello, Reference Dinarello2000). As mentioned previously, the function of cortisol is to maintain homeostasis in the body. Thus, cortisol prevents the release of substances in the body that cause inflammation. In this experiment, the increased serum cortisol concentrations were correlated with the increased levels of proinflammatory cytokines. Fan et al. (Reference Fan, Molina, Gelato and Lang1994) studied proinflammatory cytokines that promote the release of stress hormones, such as cortisol, and suppress the secretion of growth hormones. Balaji et al. (Reference Balaji, Wright, Hill, Dritz, Knoppel and Minton2000) also reported that elevated IL-1β levels were closely related to increased serum cortisol levels and reduced IGF-1 levels. This experiment supports their suggestion that reduced space allowances increase the release of proinflammatory cytokines and stimulate the secretion of the stress hormone cortisol.
This study suggests that limited space allowances have no effect on antibody synthesis, as evidenced by similar IgG concentrations in all treatments; however, restricted space allowances stimulate cellular immunity. This experiment confirms that the priorities for nutrient partitioning are shifted from growth to host defense in response to the activation of the immune system caused by environmental stressors (Colditz, Reference Colditz2002). This study also shows that low space allowances decrease the growth performance and feed efficiency of pigs, even though ADFI was not affected (Table 3). These results could be explained by the activation of the immune system resulting from the space allowance, which is supported by Van Heugten et al. (Reference Van Heugten, Coffey and Spears1996), who documented that the activation of the immune system results in reduced growth rates.
This study was performed to determine the optimal space allowances that maximize growth performance and stabilize physiological responses by minimizing environmental stress at the different growth stages in pigs. Our results for growth performance and serum cortisol concentrations confirm that no differences between T1 and T2 were observed across all growth stages. Thus, the T2 space allowance is recommended to improve the economic benefits to pig producers. Overall, our results suggest that the optimal space allowance for each growth stage is 0.24, 0.44, 0.64, 0.78 and 0.80 m2/pig for BWs of 11 to 25, 25 to 45, 45 to 65, 65 to 85 and 85 to 115 kg, respectively. This information can be utilized to optimize pig production systems and enhance the growth performance of pigs subdivided into five growth stages.
Acknowledgments
This work was carried out with the support of the ‘Cooperative Research Program for Agriculture Science & Technology Development (project no. PJ01088201),’ Rural Development Administration, Republic of Korea. This study was supported by the 2016 Postdoctoral Fellowship Program of the NIAS, Rural Development Administration, Republic of Korea.