Fatty acid binding protein 4 (FABP4) is a member of the FABP family (FABP1-FABP9), a group of intra-cellular lipid-binding proteins. The main function of FABP4 is to bind long-chain fatty acids (LCFAs) and transport them within animal cells, including cells in the mammary gland. During bovine lactation, expression of the FABP4 gene (FABP4) is up-regulated over the first 60 d of lactation when body lipid mobilisation is occurring (Bionaz and Loor, Reference Bionaz and Loor2008). Although the expression of FABP4 declines subsequently, its level of expression is still higher than in non-lactating dairy cows. The FABP4 gene has therefore been proposed as a candidate gene-marker for milk production traits and milk FA composition (Khatkar et al., Reference Khatkar, Thomson, Tammen and Raadsma2004).
The FABP4 gene has been mapped to bovine chromosome 14 (BTA 14), and in a region that is rich in quantitative trait loci (QTL) for milk production traits (Khatkar et al., Reference Khatkar, Thomson, Tammen and Raadsma2004) and milk FA components (Nafikov et al., Reference Nafikov, Schoonmaker, Korn, Noack, Garrick, Koehler, Minick-Bormann, Reecy, Spurlock and Beitz2013). The bovine FABP4 gene has four exons and three introns, and nucleotide sequence variation in the gene has been described in dairy cattle (Nafikov et al., Reference Nafikov, Schoonmaker, Korn, Noack, Garrick, Koehler, Minick-Bormann, Reecy, Spurlock and Beitz2013). In New Zealand (NZ) Holstein-Friesian × Jersey (HF × J)-cross dairy cows, Zhou et al. (Reference Zhou, Cheng, Azimu, Hodge, Edwards and Hickford2015) revealed nucleotide sequence variation in the exon 3 and intron 3 region of FABP4, and identified five single nucleotide polymorphisms (SNPs) including three intronic SNPs, one splice-site SNP and one non-synonymous SNP in the exon. Furthermore, they described three FABP4 haplotypes (A, B and C), and how haplotypes A and B (differentiated with the non-synonymous SNP c.328A/G) were associated with variation in some gross milk traits. For example, an increase in milk protein and fat percentage, but decrease in milk yield, was found when haplotype A was present. Zhou et al. (Reference Zhou, Cheng, Azimu, Hodge, Edwards and Hickford2015) did not investigate the effect of this genetic variation on milk FA composition, despite earlier work suggesting that variation in FABP4 affects milk fat traits (Marchitelli et al., Reference Marchitelli, Contarini, De Matteis, Crisà, Pariset, Scatà, Catillo, Napolitano and Moioli2013; Nafikov et al., Reference Nafikov, Schoonmaker, Korn, Noack, Garrick, Koehler, Minick-Bormann, Reecy, Spurlock and Beitz2013).
Marchitelli et al. (Reference Marchitelli, Contarini, De Matteis, Crisà, Pariset, Scatà, Catillo, Napolitano and Moioli2013) demonstrated that the SNP c.328A/G in exon 3 of FABP4 was associated with the medium- and long-chain FA (MCFA and LCFA) composition of early lactation milk in Jersey, Piedmontese and Valdostana cows, while Nafikov et al. (Reference Nafikov, Schoonmaker, Korn, Noack, Garrick, Koehler, Minick-Bormann, Reecy, Spurlock and Beitz2013) suggested that c.328A/G affected the C12:0 and mono-unsaturated FA levels in milk from early in lactation. Further, Nafikov et al. (Reference Nafikov, Schoonmaker, Korn, Noack, Garrick, Koehler, Minick-Bormann, Reecy, Spurlock and Beitz2013) suggested that once cows had passed through early lactation, the effects of FABP4 on milk FA composition did not persist into later lactation. This possibly reflects changes in body fat mobilisation and energy balance at different stages of lactation (e.g. a negative energy balance existing in early lactation) (Soyeurt et al., Reference Soyeurt, Dardenne, Gillon, Croquet, Vanderick, Mayeres, Bertozzi and Gengler2006).
Various studies have revealed other genes that are associated with variation in milk fatty acid composition. Of these, a SNP leading to p.K232A in diacylglycerol O-acyltransferase 1 (DGAT1) has been well documented (Schennink et al., Reference Schennink, Stoop, Visker, Heck, Bovenhuis, Van Der Poel, Van Valenberg and Van Arendonk2007). The milk fat percentage, saturated FA composition and unsaturation rate could be affected by DGAT1, and it is notable that the gene for DGAT1 is co-located on BTA 14 with FABP4.
The current literature describing the likely role of FABP4 in milk FA production, describes predominantly housed dairy cows (Marchitelli et al., Reference Marchitelli, Contarini, De Matteis, Crisà, Pariset, Scatà, Catillo, Napolitano and Moioli2013; Nafikov et al., Reference Nafikov, Schoonmaker, Korn, Noack, Garrick, Koehler, Minick-Bormann, Reecy, Spurlock and Beitz2013), and extrapolation to pasture-based dairy production systems may not be appropriate. The differences in feeding systems, nutrient availability and diet, could affect gross milk traits, such as the content of protein and fat in milk. For example, pasture-based production systems have been suggested to lead to higher levels of polyunsaturated fatty acids (PUFA) and conjugated linoleic acids (CLA) (Dewhurst et al., Reference Dewhurst, Shingfield, Lee and Scollan2006). Furthermore, the effect of FABP4 variation on milk FA levels needs to be analysed against different genetic backgrounds. Therefore, the objective of this study was to investigate the relationships between FABP4 and milk FA composition of HF × J-cross cows in late lactation in the context of DGAT1 p.K232A variation, and in a pasture-based out-door dairy production system.
Materials and methods
Animals and milk sample collection
The Lincoln University Animal Ethics Committee (AEC Number 521) approved this research under the provisions of the Animal Welfare Act 1999 (NZ Government). A total of 407 Holstein-Friesian × Jersey (HF × J)-cross dairy cows of 3 to 10 years of age, and from two herds (113 cows in herd 1, 294 cows in herd 2) were investigated. All the cows were grazed on pasture (a mixture of perennial ryegrass and white clover) on the Lincoln University Dairy Farm (LUDF; Canterbury, NZ). All the cows calved over the months August–September. They were milked twice a day throughout lactation (from calving until the end of May). A milk sample was collected from each cow, in a single afternoon milking in mid-January (days in milk (DIM) = 148 ± 19 d). The milk samples were frozen at −20°C and then freeze-dried, prior to being individually ground to a fine powder for component analysis.
Gas chromatography of the fatty acids in the milk samples
The milk FAs were methylated and extracted in n-heptane, before being analysed by gas chromatography (GC) as FA methyl esters (FAME). The methylation reactions for ester formation were performed in 10-ml Kimax tubes. Individual powdered milk samples (0.17 g), were dissolved in 900 μl of n-heptane (100%, AR grade), before 100 μl of internal standard (5 mg/ml of C21:0 methyl ester in n-heptane) and 4.0 ml of 0.5 m NaOH (in 100% anhydrous methanol) were added. The tubes were vortexed then incubated in a block heater (Ratek Instruments, Australia) at 50°C for 15 min. After cooling to room temperature, another 2.0 ml of n-heptane and 2.0 ml of deionised water was added to each tube. After vortexing, the tubes were centrifuged for 5 min at 1500 g (Megafuge 1.0R, Heraeus, Germany). The top layer of n-heptane was transferred with a Pasteur pipette into a second Kimax tube, and another 2.0 ml of n-heptane was added to each of the original tubes. The extraction was repeated and the n-heptane aspirates were then pooled. Finally, anhydrous sodium sulphate (10 mg) was added to the n-heptane extracts, to remove any residual water. The GC analysis was carried out using a Shimadzu GC-2010 Gas Chromatograph (Shimadzu Corporation, Kyoto, Japan) equipped with a flame ionisation detector and an AOC-20i auto sampler. The output was analysed with GC Solution Software (Shimadzu).
For analysis, 1 μl of the n-heptane sample extract was injected into a 100 m GC column (250 μm × 0.25 μm capillary column, CP-Select, Varian) with a 1:60 split ratio. The separation was undertaken with a pure helium carrier gas and was run for 92 min. The temperature of both the injector and detector were set at 250°C and the thermal profile of the column consisted of 45°C for 4 min, followed by 27 min at 175°C (ramped at 13°C/min), 35 min at 215°C (ramped at 4°C/min), and a final ‘bake-off’ at 250°C for 5 min (ramped at 25°C/min). The individual FAMEs were identified by the peak retention time compared to commercially obtained external standards (ME61, ME93, BR3, BR2, ME100, GLC411 and GLC463; Laroden AB, Sweden). Quantification of the individual FAMEs was based on peak area assessment and comparison with the internal and external standards. The threshold for peak area determination on the chromatogram was a 500-unit count, with peaks that were under 500-unit count, being ignored. The calculated minimum component of an individual FAME was 0.01 g per 100 g of total FA. After individual FA measurement, the FAs were divided into specific groups for further analysis (see online Supplementary File supplementary methods).
PCR-SSCP analysis and genotyping
A blood sample from each cow was collected onto FTA cards and air dried. Genomic DNA was purified from a 1.2-mm punch of the dried blood spot, using a two-step washing procedure, as described by Zhou et al. (Reference Zhou, Hickford and Fang2006). PCR amplification was performed in a 15-μl reaction containing the genomic DNA (punch of FTA paper), 0.25 μm of each primer as described in Zhou et al. (Reference Zhou, Cheng, Azimu, Hodge, Edwards and Hickford2015), 150 μm of each dNTP (Bioline, London, UK), 2.5 mm of Mg2+, 0.5 U of Taq DNA polymerase (Qiagen, Hilden, Germany) and 1 × the reaction buffer supplied with the polymerase enzyme. Amplification was undertaken using S1000 thermal cyclers (Bio-Red, Hercules, CA, USA) and the thermal profile included an initial denaturation for 2 min at 94°C; followed by 35 cycles of 30 s at 94°C, 30 s at 60°C and 30 s at 72°C; with a final extension of 5 min at 72°C. Following amplification, a 0.7-μl aliquot of the PCR products was mixed with 7 μl of loading dye (98% formamide, 10 mm EDTA, 0.025% bromophenol blue, 0.025% xylene-cyanol). After denaturation at 95°C for 5 min and rapid cooling on wet ice, the samples were loaded on 16 cm × 18 cm, 14% acrylamide: bisacrylamide (37.5:1) (Bio-Rad) gels. Electrophoresis was performed using Protean II xi cells (Bio-Rad), at 350 V for 18 h at 4°C in 0.5 × TBE buffer. The method of Byun et al. (Reference Byun, Fang, Zhou and Hickford2009) was used to silver-stain the gels. Using the same blood samples, DGAT1 p.K232A was investigated. The genotyping method for DGAT1 p.K232A was as described by Li et al. (Reference Li, Zhou, Cheng, Edwards and Hickford2019).
Statistical analysis
All statistical analysis was carried out using IBM SPSS version 22 (IBM, NY, USA). Associations between variation in FABP4 and variation in milk fatty acid traits were tested using General Linear Mixed-effects Models (GLMMs). As some measurements were made in percentages, a gamma regression function was adopted in the GLMMs. Single-haplotype presence/absence models (fixed effects: DIM, age, herd and DGAT1 p.K232A) were used to ascertain which haplotypes should be analysed in subsequent multi-haplotype models. The multi-haplotype models included any haplotype that had a haplotype-fatty acid trait association in the single-haplotype presence/absence analysis with a P-value of less than 0.200. The multi-haplotype models were again corrected for the fixed effects of (DIM, age, herd and DGAT1 p.K232A) and with haplotype fitted as a random effect. A GLMM (fixed effect: genotype, DIM, age, herd and DGAT1 p.K232A) and multiple pair-wise comparisons with Bonferroni corrections were used to ascertain the effect of genotypes with a frequency greater than 5% (thus insuring adequate sample size), on milk FA traits.
The effect of cow sire could not be included in the GLMMs. Some semen straws (sire genetics) used in NZ dairy cattle artificial insemination breeding, contain mixed-sire semen purchased from commercial semen producers. In these cases, individual sire identity is impossible to ascertain, but because the straws were mixed-semen straws and because different sires are used for different inseminations in different years, it is unlikely that sire was a strongly confounding effect. Cow age and herd might also be confounded with sire, but this cannot be confirmed.
Results and discussion
The mean levels for the quantity of individual FAs and the grouped FAs are shown in online Supplementary File Tables S1 and S2 respectively. The results for the single-haplotype presence/absence models and multi-haplotype presence/absence models are presented in online Supplementary File Table S3.
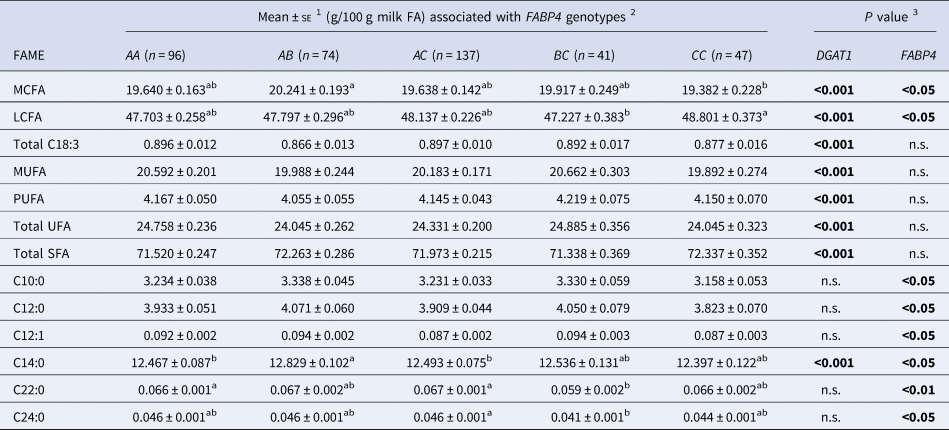
The results for the genotype comparisons are presented in Table 1. As a consequence of the small number of BB cows (n = 14), this genotype was not included in the analyses. Pairwise comparisons, using Bonferroni corrections, revealed that for the five genotypes analysed, the AB cows produced more medium-chain fatty acids (MCFA) than CC cows (P < 0.05) and more C14:0 FA than AA and AC cows (P < 0.05). The AA and AC cows produced less C22:0 FA (P < 0.01) than the BC cows, and the AC cows produced more C24:0 FA (P < 0.05) than was produced by the BC cows. Cows of genotype CC produce more long-chain fatty acid (LCFA), than cows of genotype BC (P < 0.05).
Association between milk fatty acid levels and FABP4 genotypes corrected for DGAT1 genotype

1 Predicted means and standard error of those means derived from GLMM. ‘Cow age’, ‘days in milk (DIM)’, ‘herd’ and ‘DGAT1 p.K232A’ were fitted to the models as fixed effects. Means within a row that do not share a superscript letter were separated by Bonferroni test at P < 0.05.
2 Only the genotypes with a frequency greater than 5% were analysed. BB (n = 14) occurred at a frequency of 3.07% and hence was not analysed.
3 Significant results were in bold type, whereas non-significant results were shown as ‘n.s.’.
Both DGAT1 p.K232A and the variants of FABP4 described here affected the MCFA and LCFA levels, but their effects on the individual FA levels were different, both in terms of the specific FA level affected and the size of the effect. For example, Li et al. (Reference Li, Zhou, Cheng, Edwards and Hickford2019) reported that DGAT1 p.K232A only appeared to affect the C11:0, C13:0, C14:0, C16:0 and C17:0 levels. This suggests the effect of FABP4 variation on C10:0, C12:0, C20:0, C22:0 and C24:0 FA levels described here, are independent effects. The only FA that appeared to be affected by both genes was C14:0. After correction for the influence of DGAT1, differences were only found between the AB cows, and the AC and AA cows (Table 1), with this being supported by the observation that FABP4 haplotype B was responsible for the C14:0 difference (online Supplementary File Table S3).
Nafikov et al. (Reference Nafikov, Schoonmaker, Korn, Noack, Garrick, Koehler, Minick-Bormann, Reecy, Spurlock and Beitz2013) reported that FABP4 variation c. 328G/A affected the levels of C10:0, C12:0, C14:0, SFA, UFA, MUFA and the SFA/UFA ratio, and how cows with haplotype H3 (c.328A, found in cows of genotype AB and BC in this study), had reduced milk C10:0, C12:0 and C14:0 FA levels. This contrasts somewhat with our findings, where while FABP4 variation was associated with variation in C10:0, C12:0 and C14:0 FA levels, the only differences recorded between specific genotypes were between AB cows, and AA and AC cows. Only the C14:0, LCFA and MCFA levels were affected by both FABP4 and DGAT1 and this might suggest that the effect of FABP4 variation may not be specific to DGAT1, but to lactation stage or DIM, cattle breed, feeding system, or a combination of all these factors.
In the context of the stage of lactation or DIM, the AB and BC cows (haplotype B present) in this study appeared to have a higher milk content of C10:0, C12:0 and C14:0 at DIM = 148 ± 19 d, but the cows with haplotype H3 described by Nafikov et al. (Reference Nafikov, Schoonmaker, Korn, Noack, Garrick, Koehler, Minick-Bormann, Reecy, Spurlock and Beitz2013) had a lower concentration of C10:0, C12:0 and C14:0 in early lactation (1 to 90 DIM). Other studies have also reported that the composition of MCFAs changes at different stages of lactation. For example, Garnsworthy et al. (Reference Garnsworthy, Masson, Lock and Mottram2006) described variation in milk FA composition, with the levels of C10:0, C12:0 and C14:0 being lower for early lactation cows (4 to 29 DIM), than at the other stages of lactation, although the FA levels were similar when comparing between mid (103 to 156 DIM) and late lactation cows (265 to 306 DIM). Nafikov et al. (Reference Nafikov, Schoonmaker, Korn, Noack, Garrick, Koehler, Minick-Bormann, Reecy, Spurlock and Beitz2013) did not find any association between H3 and medium chain FAs in the later stages of lactation stage (90 to 300 DIM), but it is possible, and might be consistent with what is reported in this study, that a different effect under-pinned by FABP4 variation, occurs at different stages of lactation.
The influence of lactation stages might not, however, affect LCFA levels. Marchitelli et al. (Reference Marchitelli, Contarini, De Matteis, Crisà, Pariset, Scatà, Catillo, Napolitano and Moioli2013) reported that their ‘major’ FABP4 allele, which corresponds to both haplotypes A and B here, had a positive effect on C18:0 levels and LCFA levels, and that the effect could be observed in Jersey, Piedmontese and Valdostana cows at three different stages of lactation: before the 60th DIM, between 100 to 140 DIM and around the 210th DIM. The C18:0 FA levels did not change significantly in Piedmontese and Valdostana cows and the LCFA levels didn't change significantly in Jersey cows throughout lactation. In this study, AA and AC cows produced more C22:0 FA than BC cows, and AC cows produced more C24:0 than BC cows. In addition, the haplotype A (c.328G) and B (c.328A) had a positive and negative effect respectively on C20:0, C22:0 and C24:0 levels at 148 ± 19 DIM (online Supplementary File Table S3). Garnsworthy et al. (Reference Garnsworthy, Masson, Lock and Mottram2006) also reported that the stage of lactation stage didn't affect milk C18:0 and C20:0 levels significantly in non-pasture fed Holstein cows.
The effect of breed differences were not fully interrogated by Marchitelli et al. (Reference Marchitelli, Contarini, De Matteis, Crisà, Pariset, Scatà, Catillo, Napolitano and Moioli2013), despite reporting on three breeds: Jersey, Piedmontese and Valdostana cows. The effects of their major allele on C8:0, C10:0, C12:0, C14:0 and C18:1 FA levels, were not significant in all breeds, and possibly because the milk FA composition was different in the different breeds. Soyeurt et al. (Reference Soyeurt, Dardenne, Gillon, Croquet, Vanderick, Mayeres, Bertozzi and Gengler2006) describe significant differences in C10:0, C14:0, C16:0 and C18:0 levels between Holstein-Friesian cows and Jersey cows. Contrastingly, Palladino et al. (Reference Palladino, Buckley, Prendiville, Murphy, Callan and Kenny2010) reported that the C8:0, C10:0, C12:0, C14:0, C18:0 and LCFA levels were similar when comparing Holstein-Friesian and Jersey dairy cows, and their F1 hybrid. In this context, therefore, breed may not be of consequence in understanding the effect of FABP4 variation in the HF × J-cross cows in this study. Marchitelli et al. (Reference Marchitelli, Contarini, De Matteis, Crisà, Pariset, Scatà, Catillo, Napolitano and Moioli2013) also described significant positive effects from their major allele on C18:0 and LCFA levels in all three breeds they studied. Taken together, the effect of FABP4 variation on C20:0, C22:0 and C24:0 levels identified in this study, may not appear to be a consequence of, or affected by breed variation.
The wholly pasture-based dairy production system described here, is a different feeding system to the system used in the studies of Marchitelli et al. (Reference Marchitelli, Contarini, De Matteis, Crisà, Pariset, Scatà, Catillo, Napolitano and Moioli2013) and Nafikov et al. (Reference Nafikov, Schoonmaker, Korn, Noack, Garrick, Koehler, Minick-Bormann, Reecy, Spurlock and Beitz2013). Differences in how the cows in the different studies were fed might lead to the differing results observed. However, some studies suggest that certain FA levels are not changed significantly when diet is changed. For example, Schwendel et al. (Reference Schwendel, Morel, Wester, Tavendale, Deadman, Fong, Shadbolt, Thatcher and Otter2015) compared milk FA composition between a conventional pasture-based diet (year-round pasture-based grazing) and an organic diet, where cattle were also fed 10 mg of garlic oil per cow per day, and 18 g fish oil per day. They found that there wasn't a difference on milk C8:0, C10:0, C12:0 and C14:0 levels in the conventional herd (at 100 and 212 DIM) and the organic herd (at 90 and 202 DIM).
Marchitelli et al. (Reference Marchitelli, Contarini, De Matteis, Crisà, Pariset, Scatà, Catillo, Napolitano and Moioli2013) fed corn, silage and concentrates to their cows. The effects of FABP4 variation on milk LCFAs when comparing the results described by Marchitelli et al. (Reference Marchitelli, Contarini, De Matteis, Crisà, Pariset, Scatà, Catillo, Napolitano and Moioli2013) with the results of our study, might reflect differences in how the cows were fed. Schwendel et al. (Reference Schwendel, Morel, Wester, Tavendale, Deadman, Fong, Shadbolt, Thatcher and Otter2015) describe how milk long chain FAs can be affected by feeding systems, but it would be difficult to suggest which nutrient(s) lead to this difference, because there are seemingly inconsistent results in the previous studies.
Taken together, while FABP4 appears to affect milk FA component levels, deciphering its effects in the context of differences stages of lactation, cow parity, possible breed differences, and the effect of different cattle feeding systems, will require further investigation.
Supplementary material
The supplementary material for this article can be found at https://doi.org/10.1017/S0022029920000011.
Acknowledgements
Financial support from the Ministry of Science and Innovation (DRCX 0802; Dairy Systems for Environmental Protection; NZ) and Lincoln University Gene-Marker Laboratory are acknowledged. We thank Helen Hague from Lincoln University for sampling. We also thank the manager and staff of LUDF for their supports.