The basic story of China's coal safety since 2003, at least as evidenced in fatalities in mining accidents, has been one of massive, continuous, uniform and sustained improvement. This has been insufficiently recognized and some still argue that China's record remains appalling, sometimes citing pre-2005 evidence to support present-tense statements. This paper will outline and evaluate China's record and then, given that in 2004 the author expected any progress to be gradual,Footnote 1 examine those factors in the broader political economy and in state policy that contributed to the improvement. Far more scholars have tried to explain why accidents did happen rather than why they did not, but some possible reasons why safety might have improved include social and economic modernization, the operation of the business cycle, legislation and state regulation, concentration of output in safer enterprises, technological progress, better training and the existence of strong unions.Footnote 2
The Record
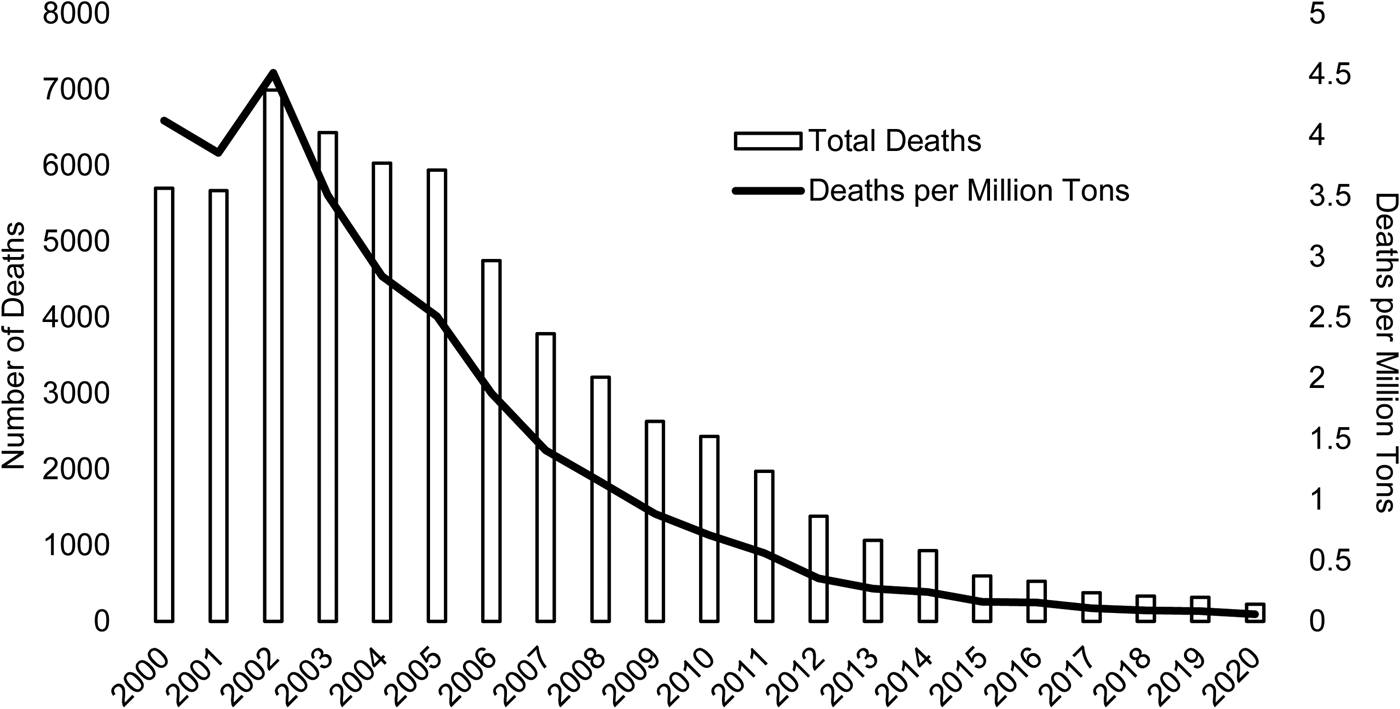
In the early 2000s, around 6,000 Chinese coal miners were killed each year in accidents – more than four for every million tons of coal extracted.Footnote 3 This record compared very badly with those of other countries and embarrassed China's leaders and people.Footnote 4 By 2020, however, as Figure 1 shows, the number of deaths had fallen by over 95 per cent and the death rate by over 98 per cent. By any standards, this was a very substantial achievement.Footnote 5
Fatalities in Chinese Coal Mines, 2000–2020
Sources:
SACMS 2010, 88–89; Zhongguo anquan shengchan nianjian various years; NBS various years. Detailed sources for all the data in the figures are available online at https://doi.org/10.1017/S0305741021000941.

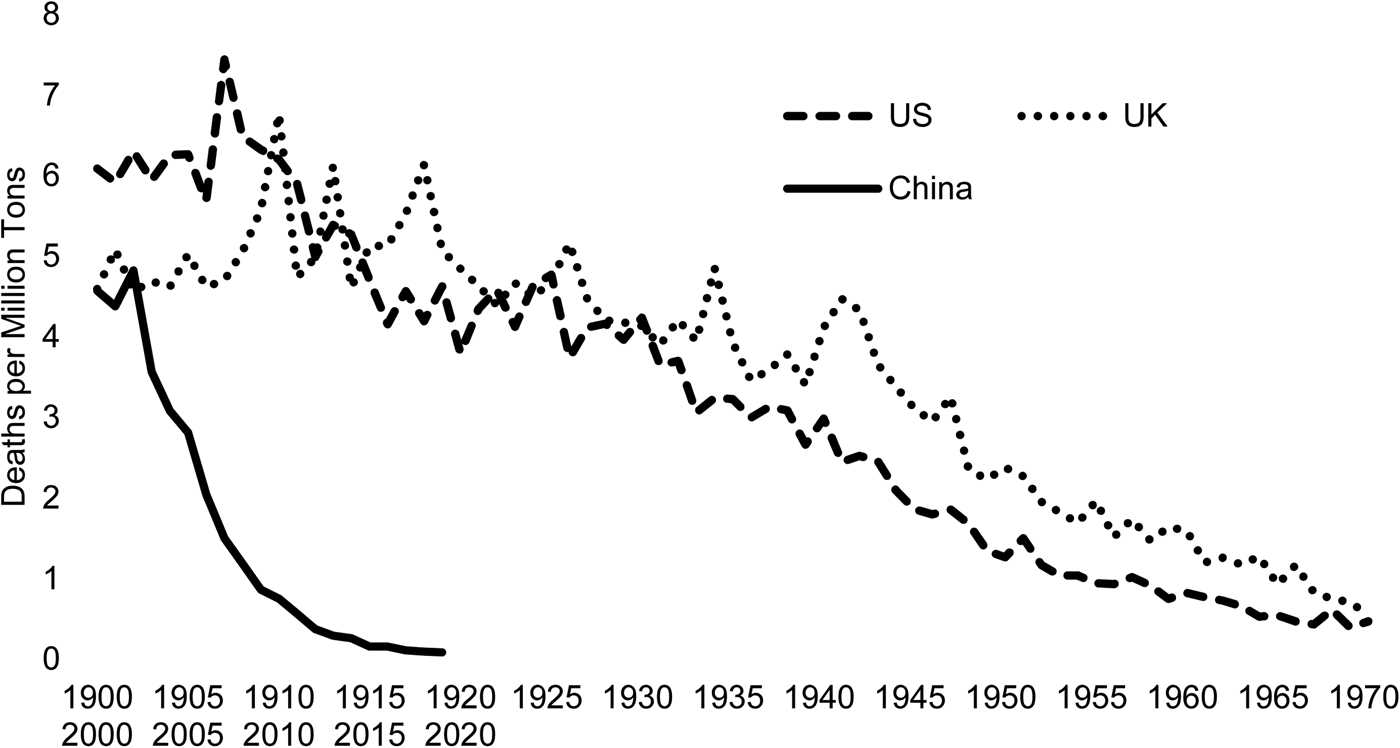
Some international comparisons illustrate the magnitude of the improvement. Figure 2 shows death rates in the UK and the US, 1900–1970, and in China, 2000–2020. In each case, the rate started out at over four. But in China, it fell further in 19 years than it did in the UK or the US in 70 years.
Deaths per Million Tons in the US and UK, 1900–1970, and China, 2000–2020
Sources:
Durham Mining Museum, n.d; NCB various years; NCB 1979, 3–4; US Department of Labor n.d.

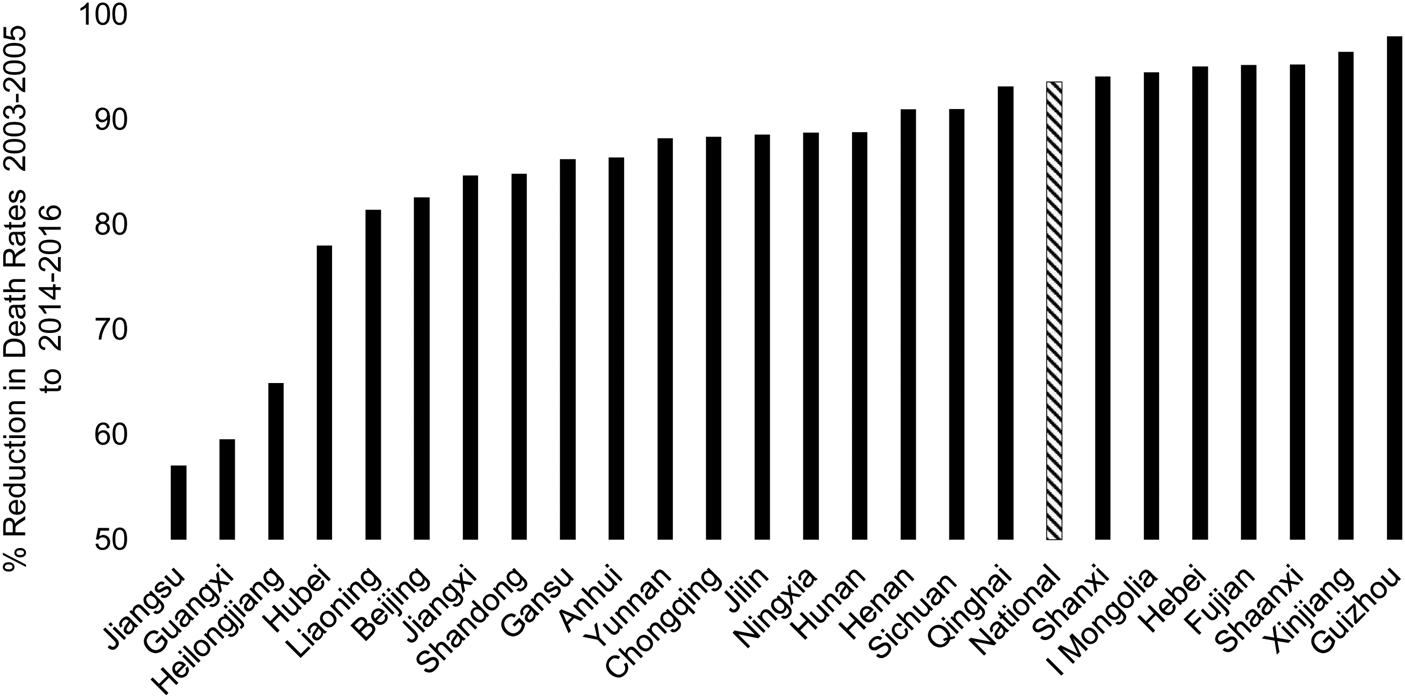
The improvement was sector wide. In geographical terms, the rate fell nationally by about 94 per cent between 2003–2005 and 2014–2016. Figure 3 shows that every province-level unit also improved dramatically. Guizhou recorded the highest reduction of 98 per cent, but even the least successful, Jiangsu, Guangxi and Heilongjiang, still managed around 60 per cent.
Reduction in Coal Mine Death Rates between 2003–2005 and 2014–2016, by Province (%)
Sources:
Zhongguo meitan gongye nianjian 2004; 2005; Zhongguo anquan shengchan nianjian 2014; 2015; 2016.
Notes:
Provinces not producing coal or ceasing production are excluded. There are some small other omissions. Availability of reliable statistics determines the periods chosen.

Nor was the improvement limited to particular types of mining enterprise. Available national figures show that death rates fell by 70 per cent between 2002 and 2009 in the large state-owned mines, 80 per cent in the generally medium-sized mines run by local states and almost 85 per cent (95 per cent by 2014) in the mostly small township and village mines (TVMs).Footnote 6 More partial provincial figures suggest that they continued to fall after 2009. The official figures do not, therefore, support Fan Geng and Joseph Saleh's argument that deaths declined solely because of small mine closures, whereas deaths in operating mines remained constant.Footnote 7
Three factors qualify – although do not negate – China's achievement. First, up until the early 2000s, fatalities were excessive given existing levels of technology, and the gap between actual practice and evolving best practice was greater for China in 2000 than it was for the UK or US in 1900. So, as with economic growth, China's progress involved considerable catching up, and a lot of low-hanging fruit was waiting to be picked. Nevertheless, the fruit had to be picked, and the situation has improved continuously since 2003.
Second, fatalities, as the least ambiguous and most easily quantifiable measure of safety, are obvious objects for government action.Footnote 8 In target-driven systems, problems less easily quantified or monitored tend to attract less attention. Little is known about non-fatal injuries in Chinese coal mines, although evidence elsewhere suggests a relatively constant relationship between serious injuries and fatalities,Footnote 9 and it is likely that non-fatal injuries in China also fell. Likewise, less progress has been made with occupational diseases, notably pneumoconiosis. In fact, just as accidents were declining in number, new pneumoconiosis cases were increasing sharply (although, given the latency period, that reflected the situation 20 years earlier).Footnote 10 Half of China's pneumoconiosis cases were coal miners, and the number of diagnosed cases increased by 85 per cent between 2005 and 2013, and deaths increased by 119 per cent.Footnote 11
Finally, for all the improvement, over 200 miners are still dying each year, and substantial work remains to be done. China still lags behind many other major coal producers, partly because it is less able to use open-cast methods. China's average death rate in 2017–2019 was 0.093 per million tons, marginally better than India at 0.096, but considerably higher than the US at 0.019.Footnote 12
Can We Believe the Figures?
One objection must be confronted immediately: this picture relies on official figures, a factor which some might argue invalidates the conclusions drawn.Footnote 13 There are indeed reasons for caution, but it remains almost impossible that the figures conceal a situation where safety has not dramatically improved.
No one believes that the official figures include every fatality. Even apart from the limitations of statistical collection, fatalities have been deliberately concealed by both managers and local officials who face penalties if such deaths are recorded. In fact, the incentives for concealment increased in the 2000s. The state raised the amount of compensation enterprises had to pay to bereaved families as well as the penalties for serious accidents and made accident prevention a higher priority in cadres’ assessment. No doubt, these measures incentivized safety improvement but, if an accident did occur, they also gave greater reason to conceal the fact – for example, by bribing or threatening journalists to prevent them reporting the incident.Footnote 14
A second reason for caution is that the system has become less transparent over the last decade. The publication of data has become sparser. Up until 2009, the government published detailed statistics which disaggregated accidents and fatalities for each province by different forms of ownership. They ceased to do this from 2010, reflecting in part the decline of the TVM model but also the greater efforts by the state to control information. Although the State Administration of Coal Mine Safety (SACMS) has established a (non-public) database of accidents, which Chinese scholars use, it seems incomplete, delivering substantially lower totals for fatalities than even the SACMS communiqués.
Moreover, the state has restricted investigative journalism. In the early 2000s, journalists, most notably those working for the Southern Weekend group, highlighted the causes and outcomes of mining disasters. From around 2011, however, predating even Xi Jinping's 习近平 installation as general secretary, the Party began to tighten its control of the press, targeting Southern Weekend in 2013–2015. By the late 2010s, investigative journalism had become much more difficult, with far fewer controversial stories coming to light.Footnote 15 Reporting on accidents in large state-owned mines was always problematic and the increasing concentration of production in such mines has made things more difficult for journalists.Footnote 16 State organs now face less pressure for transparency about mining accidents or other social problems.
Finally, anomalies in the official figures provide evidence of underreporting, particularly before 2007.Footnote 17 Observers have noted the large number of disasters with nine fatalities: “major” accidents with ten or more deaths were handled by the centre and those with fewer deaths at the provincial level, involving lower fines.Footnote 18 Figure 2 also shows that whereas in the UK and the US substantial annual fluctuations complicated an overall downward trend, in China deaths and death rates have declined every single year from 2003. In part, the lack of fluctuations was probably owing to the law of large numbers – the Chinese industry was much larger and total deaths around four times higher – and data from individual provinces do show much more variation.Footnote 19 Nevertheless, to sceptics these anomalies suggest that the official figures have been massaged.
Despite these caveats, it is almost certain that coal safety has dramatically improved, even if we cannot trust all the details. Some simple arithmetic illustrates the point. Around 2002, official figures reported about 6,000 deaths a year. Assuming that a further 2,000 were concealed (probably a reasonable estimate, although within limits the exact figure does not matter), then there would have been 8,000 deaths in all, 25 per cent of which were concealed. Fast forward to 2020, when 225 deaths were reported. If actual fatalities were still 8,000 (or any remotely similar number), then around 97 per cent would have been concealed. Therefore, one must go beyond giving evidence for underreportingFootnote 20 and demonstrate that the rate of concealment has vastly increased. Even given the tighter controls over information, it is highly unlikely that, in an age of mobile phones and digital media, local or central states could have concealed all major disasters (no disaster involving more than 50 fatalities has been reported since 2009, when there were three) and nearly all mine deaths. Although we never hear about successful concealment, any such success was probably neither frequent nor easily achieved.
Finally, even if fatalities are underreported by three to five times (which I very much doubt),Footnote 21 that would still leave the number of fatalities in 2020 at only one-fifth of the official figures for the early 2000s, even without making similar adjustments to those earlier figures. So, although they point to real problems, Geng and Saleh are unsuccessful in challenging the broad narrative of safety improvement.
Modernization and Economic Growth
The safety improvement has taken place amid the rapid modernization of Chinese society. Modernization and economic growth produce the resources to address work safety, if it is a high enough priority.Footnote 22 They also change the perception of risk in that, as the marginal returns to economic growth decline, risks that were apparently tolerable in earlier stages of development cease to be so.Footnote 23 Safety, therefore, tends to improve – albeit not in a unidirectional fashion – at higher levels of development.Footnote 24 In his 2007 report, the minister of the State Administration of Work Safety (SAWS) used GDP as a rough proxy for development to put China's record in comparative context and argued that the developed countries had generally suffered high death rates earlier in their history.Footnote 25 In one view, accidents frequently occur when per capita GDP is around US$1,000–3,000, but occur less frequently when it reaches US$5,000.Footnote 26 China probably approached the US$5,000 mark in the mid-2000s at purchasing power parity and in the early 2010s using market exchange rates, just as death rates were falling.
As development proceeds, supplies of surplus rural labour often begin to dry up and the economic (although not, in the case of China, the political) position of labour tends to improve. Workers are less able to demand a safe work environment when they lack alternative sources of employment. In 2002, a Chinese worker lamented after an accident, “If we complain, they can always find someone else to work.”Footnote 27 However, labour in China became scarcer from the mid-2000s, first in the south-east and then more broadly across the country, as reflected in accelerating wage rises.Footnote 28 In the 2010s, coal companies found it particularly difficult to recruit workers to a dirty and dangerous occupation as parents of only children became averse to the risk that employment in mines involves.Footnote 29 The tightened labour supply gave workers more options and employers fewer, improving workers’ bargaining position in respect of wages and conditions.Footnote 30
These factors affected all sectors across the economy, but coal mining performed substantially better than others. Between 2002 and 2016, the proportion of work fatalities it accounted for declined from over 30 per cent to 6 per cent, as deaths declined by 91 per cent in coal mining, and 55 per cent overall. Fatalities in the (rapidly growing) construction industry actually increased.Footnote 31 In the chemical industry, deaths fell sharply in 2007 but later fluctuated with a slightly rising trend – clearly a much inferior record to that of the coal sector, although the industry's growth meant that deaths per unit of output fell.Footnote 32 Factors specific to coal must, therefore, have also played a role.
Boom and Bust
The economic health of the industry itself has had an impact on safety, although that impact has been neither simple nor one way. In the short term, when capacity is fixed, safety tends to decline in boom times (because of the pressure to increase production) but improves somewhat during slumps.Footnote 33 But in the long term, high profits create resources that can be used to improve safety.
In the short term, the SAWS identified the key cause of China's high accident rate to be mines exceeding their production capacity because of booming business.Footnote 34 Overcapacity working was relatively “normal” throughout the early reform period,Footnote 35 and remained common during the boom of the “ten golden years” (2002–2011), with mines working at 30–80 or even 100 per cent over capacity.Footnote 36 For every 1 per cent that capacity was exceeded in the early 2000s, the death rate increased by 1.8 per cent.Footnote 37 After the boom ended, China Labour Bulletin thus interpreted better safety figures as partly reflecting the industry's (relatively) depressed state.Footnote 38 However, the major improvement in safety during the boom makes this an unconvincing explanation of the long-term trends.
In the longer term, high prices and profits improved safety. Lack of investment had been a major factor behind high death rates in the 1990s and early 2000s, as low prices and competitive pressures induced mines to economize on apparently non-productive safety expenditures. Safety investments fell close to zero in the late 1990s, even in large state-owned mines, leading to “safety shortfalls” of 150 billion yuan or more.Footnote 39 As a result, equipment became obsolescent and dangerous: in four major north-eastern coal corporations, 40 per cent of equipment in the 2000s was obsolescent, with 30 per cent of it dating from the 1950s.Footnote 40 Chinese mines, especially but not only the smaller mines, suffered from safety hazards long overcome elsewhere: in 2007, the SAWS was still calling on mines to cease using shafts for both ventilation and transporting miners.Footnote 41
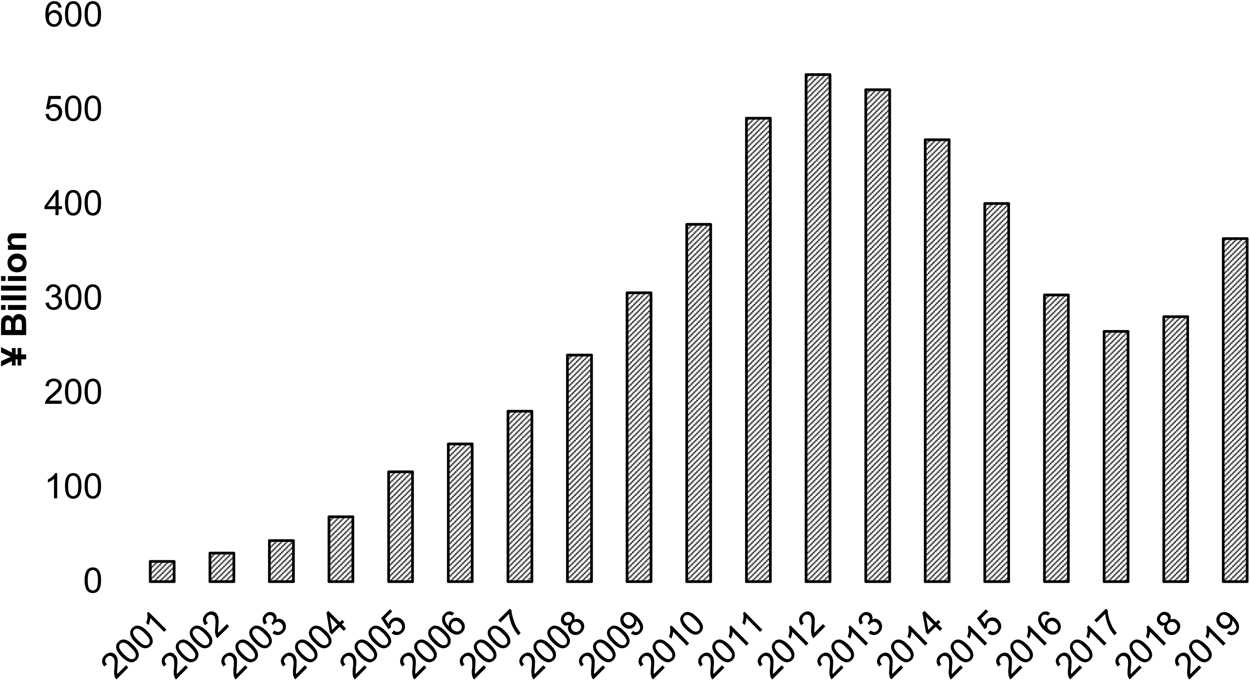
The boom, however, enabled many coal enterprises to increase safety investments and replace outdated machinery.Footnote 42 Figure 4 shows that total investment increased very sharply from 21 billion yuan in 2002 to 537 billion yuan in 2012. Much of this investment did not go directly towards improving safety but rather to fund large increases in capacity.Footnote 43 Nevertheless, government policy mandated that any productive investment be accompanied by appropriate safety measures.Footnote 44 Therefore, even capacity-building investment improved safety, as newer mines tended to be larger and safer. The volume of investment directed specifically towards safety likewise increased massively up until the early 2010s, closely shadowing profits.Footnote 45 The decline in profits from 2012 put an end to this rapid growth: in Changzhi 长治 (Shanxi), after increasing from just over 100 million yuan in 2000 to almost 700 million yuan in 2012, such investments tailed off and made no further progress.Footnote 46 The state again became worried about the emergence of “safety shortfalls” and the weakening of the safety infrastructure.Footnote 47

State Commitment
China's system has long focused on centralized mechanisms to deal with risk and, despite the broader economic factors, state commitment has been crucial to the speed and magnitude of the safety improvement.Footnote 48 Richard Suttmeier argues that the state's attention is a scarce resource because it has multiple and often conflicting priorities. A focus on safety is, therefore, often short-lived, and decentralized social mechanisms are also necessary.Footnote 49 Nevertheless, for China's coal safety, there is much more evidence for state-led action than for broader social changes such as autonomous labour organizations, a free press or the rule of law.
State commitment can be attested in several ways. The Fifth Plenum of the 16th Central Committee in 2005 highlighted work safety as part of “economical, clean, safe, and sustainable development.”Footnote 50 In 2006, Premier Wen Jiabao 温家宝 laid out a detailed strategy,Footnote 51 and, from 2007, specific coal safety programmes were developed within the Five-Year Plans.Footnote 52 Financially, government bond issues promoted coal safety and the 15 billion yuan raised between 2006 and 2010 leveraged 88 billion yuan of investment by enterprises and local governments.Footnote 53 More broadly, mentions of “coal safety” in the People's Daily increased very steeply in the early 2000s, reflecting increased attention to an existing problem rather than a suddenly worsened situation. These mentions peaked in 2005–2006, later falling off, no doubt partly because there were fewer disasters, and stabilizing in the 2010s at a level far higher than in the 1990s.Footnote 54
The commitment reflected the state's priorities under Hu Jintao 胡锦涛 and Wen Jiabao, typifying the “protective authoritarianism” theorized by Jude Howell and Tim Pringle, whereby the state attempts to limit exploitation of workers, an ambition that was carried over into the harder authoritarianism of Xi Jinping.Footnote 55 Priorities shifted from a sole focus on growth to some concern with key social problems, including work – and especially coal – safety. A safe work environment was one of the aspirations of Hu Jintao's “harmonious society,” as encapsulated in the oft-cited slogan yi ren wei ben 以人为本 (people-oriented).Footnote 56 Economic policies increasingly favoured a more intensive mode of growth, with many observers linking China's previously disastrous safety record to its extensive growth model.Footnote 57 These new priorities led the state for a while to allow reporters to cover the darker side of society,Footnote 58 and the popular unease created by frequent press reports of disasters – and the corrupt relationships underlying them – in turn put further pressure on the state.Footnote 59
Any commitment to safety stopped well short of changing the nature of the party-state. Many observers elsewhere argue that only with autonomous worker organizations, particularly unions, can real progress be made.Footnote 60 As Michael Wallace writes of the US, “the union gives miners the collective strength to resist unsafe conditions at the point of production without fear of reprisal by the operators.”Footnote 61 Likewise, Helen and Baron Duckham identify independent labour organization as a key factor behind progress in the UK.Footnote 62 In China, however, no evidence suggests that autonomous worker organizations have been allowed to grow, or that they underlie the improvement in safety. Lip service was paid to “mass supervision,” in which the union (which is little more than a branch of the bureaucracy) was allocated a key role, and to the need for worker representation. The State Council stipulated the appointment of worker representatives in the TVMs, which does seem to have happened at least in some areas such as Yunnan.Footnote 63 Nationally, however, implementation was very uneven, and union activities limited;Footnote 64 problems ranged from a failure of management to take the issue seriously to low “quality” of, and low rewards for, the representatives.Footnote 65 Nor does it seem that labour NGOs played a major role, although the relatively open authoritarianism of the Hu–Wen era allowed China to absorb international best practice by collaborating with foreign experts, with involvement by the United States, Japan and the European Union particularly, but not exclusively, in developing training programmes.Footnote 66
Nor did the state follow the advice of liberal economists to resolve the conflict between its responsibilities for safety and for coal production by further marketizing the industry.Footnote 67 On the contrary, as outlined below, production became increasingly concentrated in the largest state-owned, or at least state-controlled, companies. Persisting conflicts of interest are indicated even in the laws, which foreground promoting economic development as well as work safety.Footnote 68
Rather, the state's actions remained squarely within the ambit of an “illiberal regulatory state.”Footnote 69 First, it strengthened the legal and regulatory framework.Footnote 70 Important milestones included the 2002 Work Safety Law, the revised coal safety regulations in 2004, and the 2015 document on coal safety permits.Footnote 71 An American lawyer concluded in 2009, “The PRC has a comprehensive, sophisticated and complex legal regime dealing with coal mine safety,” a regime which contributed to the decline in fatalities.Footnote 72 Nevertheless, the key issue was not the law but rather its enforcement. Even in the 1990s, if the laws had been enforced, the prerequisites for better safety already existed, but other issues took a higher priority and attempts to address safety issues were dogged by weak accountability and conflicts of interest.Footnote 73
In order to remedy some of the implementation problems, the state aimed to bolster the institutional basis for coal safety. It at least partially separated safety from production responsibilities by establishing a new organization in 2000, the SAWS, and, within that, the SACMS, the only sector-specific safety body. These institutions reported to the State Economic and Trade Commission separately from the Coal Industry Bureau. In practice, however, the coal and safety bureaucracies remained closely connected (the Coal Industry Publishing House publishes the Work Safety Yearbook) and the state itself retained ultimate responsibility for both production and safety.Footnote 74
The state signalled increased priority for safety from 2003 by upgrading the rank of the SAWS so that it reported directly to the State Council, first at vice-ministerial level and then, from 2005 following a series of horrific mine disasters, at ministerial level.Footnote 75 In contrast, the 2018 merger of the SAWS into a new Ministry of Emergency Management was widely perceived as indicating a reduction in commitment.Footnote 76 No systematic statistics show how far the earlier upgrading was reflected in increased funding and staffing, but by 2019 there were 26 provincial-level and 76 branch bureaus, and a total of 2,762 coal mine safety inspectors in the central system, almost all of whom had been educated at college level or higher, with three-quarters having specialized qualificationsFootnote 77 and a further 40,000 in local institutions.Footnote 78
Insufficient vertical control over local safety institutions was a further cause of implementation problems, reflecting the conflicts of incentives between the tiao 条 (branches, directly responsible to the central, or at least higher-level, authorities) and kuai 块 (areas, horizontally responsible to the local government). The resistance of local governments to directives that impacted negatively on local incomes or employment caused many accidents.Footnote 79 The state, therefore, instituted a vertical and centralized system of inspection in explicit imitation of the US, although local organs retained a role in implementation, and it is unclear how far the system went to resolving the tiao/kuai issue. In other sectors, centralization operated more at the sub-provincial level than between the centre and province.Footnote 80 For coal safety, while semi-official sources emphasized that the centre controlled the funding and hiring of staff in local institutions (as happened elsewhere only with the General Administration of Customs),Footnote 81 others argued that there remained contradictions between central and local priorities.Footnote 82
The state also boosted implementation by strengthening accountability for safety, both before and after accidents, to ensure that the enterprises and their owners and managers bore the cost of safety failures, rather than offloading them as external costs on to the affected miners.Footnote 83 In the US, safety improved when the switch from employer liability (if employers could be proven to be at fault) to workers compensation (in the case of any accident) ensured that enterprises bore the costs.Footnote 84 In China, the state began to enforce higher compensation payments to bereaved families. Before 2000, these sums were trivial, up to 30–40,000 yuan, neither providing any real support for the families nor creating incentives to improve safety. After that, provincial governments rapidly increased required payments. A major landmark came in 2004 when Shanxi, the largest coal producer, set a level of 200,000 yuan.Footnote 85 Thereafter, the general standard increasingly became 20 times the average local urban disposable income or average local net rural income (of course, these two measures could be substantially different).Footnote 86
In addition, when accidents occurred, penalties were imposed on stakeholders. When ten miners were killed at Danshuigou 担水沟 (Shanxi) in January 2017, the SACMS blamed overcapacity production and the management's delayed response to increased pressure on the roof. It imposed penalties on 33 responsible personnel: the police detained five managers for prosecution and investigated three others, and the Party or government disciplined 25 persons (for example, by demotion). The SACMS levied a fine of 5 million yuan on the company, which also faced two further 2 million yuan fines for exceeding capacity and for illegally outsourcing work to an insufficiently experienced organization. In addition, it ordered a thorough audit of the local government.Footnote 87
Local officials, including but not only those in safety institutions, were also held accountable. From 2004, the SAWS began to issue maximum permitted numbers of accidents and deaths for each province, both overall and for key industries, which the provinces then devolved to lower-level units.Footnote 88 Importantly, the limits were prioritized in the assessment and promotion of local officials.Footnote 89
Perhaps even more significantly, the SACMS imposed substantial penalties even without there being an accident. It enjoined inspectors to eliminate mine hazards, and between 2012 and 2019, made 155,000 mine inspections, uncovering 947,000 hazards of which 5,951 were particularly serious.Footnote 90 Companies failing to control hazards faced fines. In the first half of 2019, the 73,181 hazards uncovered by the SACMS generated 4,629 penalties, to a total of 542 million yuan, and the 241,000 uncovered by local organizations led to fines totalling 214 million yuan.Footnote 91
More specifically, the state prioritized three key areas for change: the elimination of small-scale mines; improvement in technology, especially for ventilation; and the training of the workforce.
Concentration of Production
In general, regulation can improve safety by raising standards in all enterprises and/or by compelling, deliberately or as a by-product of enforcing higher standards, less safe mines to close.Footnote 92 Safety tends to be positively related to scale, with smaller coal mines being more dangerous.Footnote 93 In China, scale tended to vary with form of ownership and technological level. The smaller (TVM) mines were mostly technologically more primitive, the medium (local-state owned) mines semi-mechanized, and the large (central-state owned) mines highly mechanized.Footnote 94 The safety records of the three groups differed substantially: between 1992 and 2002, their death rates were 9.57, 4.30 and 1.11, respectively.Footnote 95 The state aimed to improve safety by closing small and backward mines or forcing them to consolidate into larger units.Footnote 96
After an earlier largely unsuccessful campaign around 1999 to close small mines,Footnote 97 in 2005 the State Council set a target to “basically solve” the problem within three years, starting by targeting unregistered mines.Footnote 98 The following year and during the 2009–2010 “coal reform,” it also targeted mines deemed undesirable for other reasons.Footnote 99 These campaigns apparently have had greater success. Although such figures must be viewed with considerable caution, the number of mines nationally fell from 82,000 in 1997 to 5,300 in 2019.Footnote 100 In Shanxi, over ten months in 2009, the number of enterprises fell from 2,200 to 130, and more than half of all mines were shut; 70 per cent of those surviving had an annual capacity of over 900,000 tons.Footnote 101
Technical upgrading and increasing the scale of surviving TVMs was as important as any contraction in their number (TVM total output continued to grow up to 2012).Footnote 102 Both processes took place in Hunan, where numbers declined steeply (from over 3,000 in 1991 to 159 in 2018) as the state continually adjusted the minimum permitted size, closing down any mine with a capacity of under 90,000 tons and putting strict conditions on any under 300,000. At the same time, local governments, keen to protect coal supplies and employment, offered incentives to owners to upgrade and expand: one county offered 2 million yuan for upgrading to fully mechanized mining, and 1.2 million yuan for a high-grade conventional coal face.Footnote 103 TVM status became less associated with excessively small scale, and average scale increased across the industry. Nationally, mines with a capacity of under 300,000 tons contributed 45 per cent of total production in 2005, 22 in 2010 and 5 in 2018, while between 2010 and 2018 mines producing more than 1.2 million tons annually increased their share from just under 60 to close to 80 per cent.Footnote 104
Geng and Saleh argue that mine closures were wholly responsible for the decline in fatalities, but this seems to go too far.Footnote 105 As outlined above, death rates declined across all types of mining enterprise, and some rough calculations holding death rates at 2005 levels suggest that the closure or restructuring of small mines probably saved around 2,500 lives, about half of the total decrease in fatalities.
Technology
Technological change – partly in response to state pressure, partly autonomous, but generally within the existing technological frontier – has everywhere been an important contributor to better safety.Footnote 106 In China, the technology most directly relevant and at the forefront of state concern involved ventilation to control gas and reduce the incidence of explosions, although mechanization and a shift towards open-cast mining have also played a role.
Even though roof falls often account for as many fatalities overall, most political attention, in China and elsewhere, is paid to the largest disasters, which are typically triggered by explosions, mostly of gas, sometimes of coal dust.Footnote 107 In 2007, the SAWS made gas control a top priority,Footnote 108 and the State Council confronted the issue in annual conferences from 2005 to 2011.Footnote 109 Between 2005 and 2007, 3 billion yuan was allocated annually for this purpose to large state-owned mines hampered by economic difficulties.Footnote 110 Moreover, permitted production levels were set according to a mine's ventilation capacity.Footnote 111
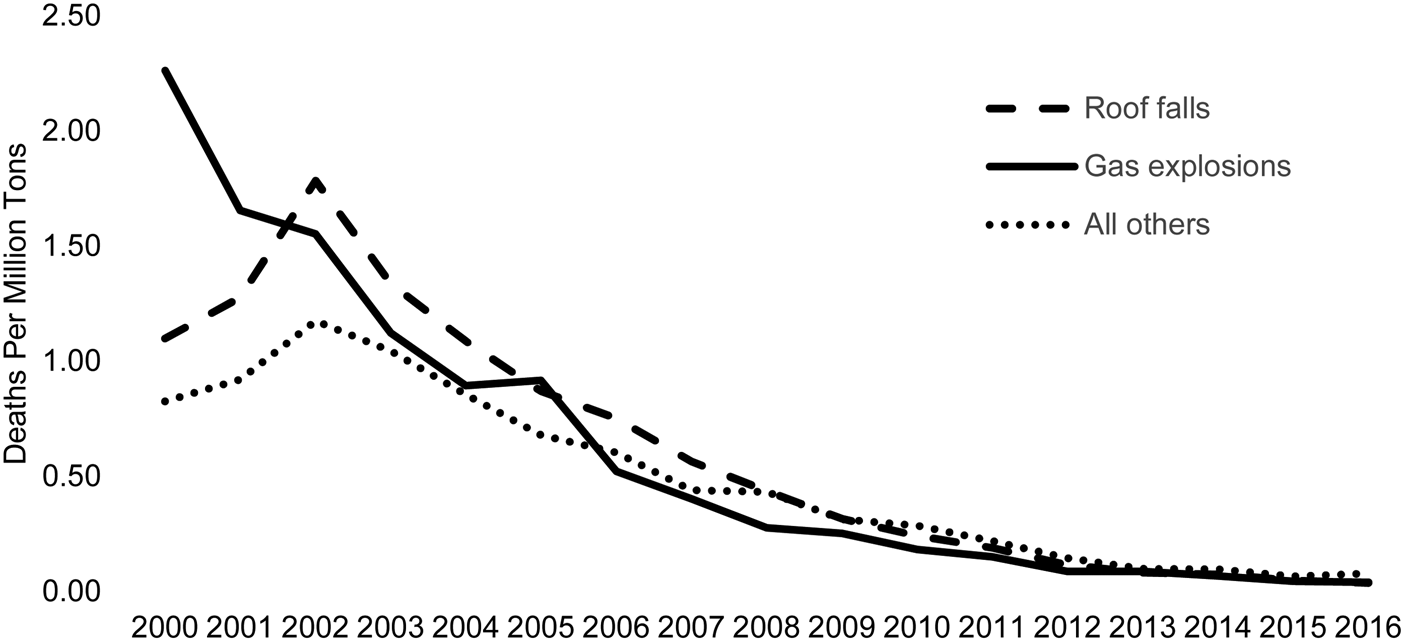
These measures yielded clear results. Increased mine gas extraction – from 2.3 billion cubic metres in 2005 to 8.8 billion in 2010 and 17 billion in 2017 – reduced the number of explosions.Footnote 112 Figure 5 shows both the high toll from and the rapid improvement in gas explosions, the number of which declined substantially (in fact beginning from the late 1990s), and no major disaster costing 50 lives or more occurred between 2010 and 2020. However, whereas in the US the number of explosions clearly declined before a decrease in other smaller accidents occurred,Footnote 113 in China fatalities from roof falls fell between 2002 and 2016 by almost the same degree as deaths from explosions (94 per cent).
Deaths Rates from Different Causes, 2000–2016
Sources:
CNCA 2006, 676; Zhongguo meitan gongye nianjian 2005, 565; Liu, Yanliang Reference Liu2018, 66.

In general, open-cast mining (albeit environmentally problematic) tends to be much safer than underground mining. Over the past two decades, China has seen a significant increase in open-cast production, from 30–40 million tons (around 5 per cent of total output) throughout the 1990s to 90 million in 2004.Footnote 114 During the boom, new open-cast mines were established, particularly in Inner Mongolia, and output reached 528 million tons in 2017, about 14 per cent of the total.Footnote 115 Nevertheless, even if open-cast mines were completely safe, a 10 percentage point increase in their share would not itself contribute more than a similar fall in fatalities. In fact, open-cast mines supply a far smaller proportion of output in China than in the next three largest producers: India (70 per cent), the US (over 60 per cent) and Australia (80 per cent).Footnote 116 This constrains any attempts to improve China's safety to global levels.
Changes (in particular, mechanization) in underground mines were more important. Mechanization improves safety by reducing the labour intensity of extraction, exposing fewer workers to hazards. In the late 1990s, non-mechanized mining in China had a fatality rate six times that of fully mechanized mining and 2.5 to 4.3 times that of partially mechanized mining.Footnote 117 The industry therefore embarked on a programme of “replacing human labour with machines,” so that, by 2019, 98.03 per cent of coal from large mines was cut by machine.Footnote 118 The SAWS also introduced policies specifically to reduce numbers underground: all 48 pits employing over 1,000 miners per shift in 2016 had reduced their shift sizes to under that number by 2019.Footnote 119 From 1992, state policy promoted mines with high levels of both safety and technology, whose number increased from 12 in 1993 to 763 in 2017, bringing about a general improvement in technological levels.Footnote 120 Foreign observers confirmed that the best Chinese mines matched the standards anywhere in the world.Footnote 121 However, although mechanization undoubtedly made a contribution, in 2002 – the year before the improvement started – the proportion of mechanized extraction in the large mines was already 78 per cent.Footnote 122 So, the relatively limited increase was probably not the main factor behind better safety.
Training and the Workforce
Whatever the underlying reasons for accidents, the proximate cause is often human error, and policymakers everywhere have foregrounded upgrading the safety consciousness of workers, foremen and managers through training and the development of a “safety culture.”Footnote 123 From 2003 onwards, the SACMS developed programmes to train work teams in safety, introducing a project in 2009 to upskill 10,000 foremen.Footnote 124 As a result of such policies (and also of higher levels of education as society modernized), the quality of both managers and ordinary miners improved. By 2016, 97 per cent of managers had specialist training, while the proportion of miners with qualifications at or below lower middle school level fell from 60 per cent in 2012 to just over 50 in 2017.Footnote 125
Training was the focus of many cooperation schemes with foreign experts. One project involved 1,292 technicians, managers and safety inspectors being sent to Japan for training, while 60 Japanese experts ran more than a hundred on-site training courses in China. The students trained in Japan won promotion to many senior and important positions after their return.Footnote 126 A general strategy, as in a US programme with the Yangquan Mining Group 阳泉煤业集团 in Shanxi, was to target a pilot mine and then to cascade that experience down to other mines and areas.Footnote 127
The idea of a “safety culture” in which all stakeholders contribute to promoting safe work practices focuses on instilling a strong safety awareness throughout the workforce. Accident prevention is a key aspect, with a zero-tolerance attitude towards violations of safety procedures.Footnote 128 Again, international best practice and collaboration played an important role, as Chinese mines adopted from their Japanese counterparts concepts such as “safety first, production second” as well as more specific techniques for confirming the safety of the production process.Footnote 129
Conclusion
This article has argued that the dramatic improvement in China's coal safety shown in the official statistics is real, not just apparent, even if the details are open to question. It has offered a relatively state-focused explanation. While structural factors played an important role and were no doubt leading to a secular decline in fatalities, it is unlikely that the decline would have been so rapid without the active agency of the state.
This particular case lends little support to political economy approaches that stress the political balance between labour and capital or that focus on independent labour organization as a key prerequisite for improving safety.Footnote 130 The party-state made coal safety a high priority, but not one nearly high enough to outweigh the overwhelming requirement to maintain its monopoly on power. There is no sign of autonomous labour organizations playing any part in the improvement in safety nor of the decentralized mechanisms that Suttmeier believes are necessary conditions for progress.Footnote 131
What the story does show is that the Chinese state is able to effect change in a largely top-down fashion if it prioritizes that change. Just as with air safety in the 1990s, the adverse publicity within and outside China about the high coal fatality rate at the beginning of the century gave the state the impetus to devote financial and organizational resources to addressing the issue. In both cases, the aim was relatively clear – the reduction of fatalities in mine disasters or aircraft crashes – and could be addressed in a target-based system. Absent the specific conditions, however, a broader improvement in workplace health and safety would almost certainly require both greater empowerment of workers and the decentralized mechanisms suggested by Suttmeier.
Acknowledgements
The author would like to thank Stephen Dobbs, Beverley Hooper and Yingchi Chu for their comments and contribution to the paper.
Supplementary material
Supplementary material is available online at https://doi.org/10.1017/S0305741021000941.
Conflicts of interest
None.
Biographical note
Tim WRIGHT is professor emeritus at the University of Sheffield and honorary research fellow in the School of Humanities, University of Western Australia. He is currently editor-in-chief of the Chinese studies module of the Oxford Bibliographies. His research focuses on the political economy and development of China, both before the 1949 revolution and in the contemporary period. His publications include The Political Economy of the Chinese Coal Industry: Black Gold and Blood Stained Coal (Routledge, 2012) and “Workers’ peril in the ‘workers’ state’: the Laobaidong colliery disaster of 1960” in Ivan Franceschini et al. (eds.), Proletarian China: A Century of Chinese Labour (Verso, forthcoming).