





Impact statement
This study demonstrates how large, heterogeneous experimental datasets can be systematically leveraged to improve predictive modeling in sustainable construction materials. By compiling and curating a high-quality database of 582 self-compacting concrete mixes incorporating recycled aggregates, the study shows that ensemble learning—particularly XGBoost—can achieve both high predictive accuracy and interpretability. Beyond performance, the study emphasizes data-centric practices such as robust preprocessing, cross-validation, and feature importance analysis to enhance model generalizability and engineering trust. The proposed framework supports data-driven mix design optimization, enabling more reliable adoption of recycled materials in structural concrete while reducing experimental trial-and-error. More broadly, the study illustrates how data-centric machine learning can bridge experimental materials science and practical engineering decision-making.
1. Introduction
The construction sector is a cornerstone of global development, but is also responsible for an alarming share of natural resource depletion and environmental degradation (Liu et al., Reference Liu, Alam, Zhu, Zheng and Chi2021; Ridho et al., Reference Ridho, Ngamkhanong, Wu and Kaewunruen2021). Cement production alone contributes nearly 8% of global CO2 emissions, while aggregate extraction and concrete manufacturing strain ecosystems and deplete non-renewable resources (Khan et al., Reference Khan, Naveed, Rasheed and Miao2023a). With the surge in infrastructure development, especially in rapidly urbanizing regions, these environmental concerns are intensifying. In this context, there has been a significant push toward sustainable construction practices, with a particular focus on resource conservation, emission reduction, and the implementation of a circular economy (Khan et al., Reference Khan, Rasheed, Naveed and Pimanmas2026a). One promising approach is the reuse of construction and demolition waste (CDW), particularly recycled aggregates, in new concrete applications (Gontia et al., Reference Gontia, Thuvander, Ebrahimi, Vinas, Rosado and Wallbaum2019).
Recycled aggregates—comprising crushed concrete, bricks, and other demolition byproducts—have been increasingly investigated as partial or full replacements for natural coarse and fine aggregates (Xiao et al., Reference Xiao, Li and Poon2012; Saha and Rajasekaran, Reference Saha and Rajasekaran2016; Bui et al., Reference Bui, Satomi and Takahashi2017). This approach significantly reduces the demand for pure materials and mitigates the environmental burden of waste disposal. Moreover, the use of recycled concrete aggregate supports sustainable construction by lowering the carbon footprint and promoting closed-loop material cycles (Poon et al., Reference Poon, Shui, Lam, Fok and Kou2004a; McNeil and Kang, Reference McNeil and Kang2013). However, recycled aggregates are often characterized by inferior mechanical and physical properties compared to natural aggregates. These include higher water absorption, increased porosity, variable strength, and the presence of adhered old mortar, all of which pose challenges in maintaining consistent performance in structural concrete, especially in high-performance or flow-critical applications such as self-compacting concrete (SCC) (Etxeberria et al., Reference Etxeberria, Vázquez, Marí and Barra2007; Rahal, Reference Rahal2007).
SCC is a highly flowable, non-segregating concrete that can fill formwork under its own weight without the need for vibration (Khan et al., Reference Khan, Muhammad, Raza and Pimanmas2025a). Developed in Japan in the late 1980s, SCC is particularly suited for precast applications, densely reinforced sections, and architectural elements requiring excellent surface finishes (Ahmad, Reference Ahmad2008). Its fresh state properties, high filling ability, passing ability, and segregation resistance are achieved through careful mix proportioning and the use of superplasticizers and viscosity-modifying agents (Shi et al., Reference Shi, Wu, Lv and Wu2015). However, SCC’s unique rheological requirements make it sensitive to variations in material properties, especially when recycled aggregate is introduced. The unpredictable moisture content and rough surface texture of recycled aggregates impact workability, leading to inconsistent placement and compaction. More critically, the compressive strength of SCC containing recycled aggregates can vary widely due to multiple interacting parameters, including binder content, water-to-binder ratio, aggregate gradation, admixture dosage, and curing conditions (Bui et al., Reference Bui, Satomi and Takahashi2017).
Predicting the compressive strength of SCC with recycled aggregates using traditional empirical methods or linear regression models has proven unreliable, especially when extended across diverse datasets or mix compositions (Chaabene et al., Reference Chaabene, Flah and Nehdi2020; Nunez et al., Reference Nunez, Marani, Flah and Nehdi2021). These classical models often fail to capture the nonlinearities and interaction effects present in concrete systems with recycled constituents. In recent years, machine learning (ML) has emerged as a powerful alternative for material property prediction due to its ability to learn complex patterns from data without being constrained by rigid assumptions (Khan et al., Reference Khan, Muhammad, Raza, Chaimahawan and Pimanmas2025b, Reference Khan, Muhammad, Raza and Pimanmas2026b). Unlike traditional statistical methods, ML algorithms can model high-dimensional relationships and are adaptable to large, heterogeneous datasets typical of real-world experimental research in concrete materials (Nafees et al., Reference Nafees, Amin, Khan, Nazir, Ali, Javed, Aslam, Musarat and Vatin2021).
Numerous studies have demonstrated the potential of ML in predicting the mechanical and durability properties of concrete. Techniques such as Artificial Neural Networks (ANNs), Support Vector Regression (SVR), and Ensemble Learning methods (e.g., Random Forests and Gradient Boosting Machines) have been employed to predict compressive strength, modulus of elasticity, split tensile strength, and durability indices like carbonation depth and chloride penetration (Asteris et al., Reference Asteris, Skentou, Bardhan, Samui and Pilakoutas2021; Huang et al., Reference Huang, Dai and Yu2023). For example, Khan et al. (Reference Khan, Awan, Rasul, Siddiqi and Pimanmas2023b) and Nasir et al. (Reference Nasir, Gazder, Maslehuddin, Al-Amoudi and Syed2020) developed ANN-based models for predicting compressive strength in conventional and modified concrete, demonstrating improved performance over regression methods. More recently, the use of ensemble learning, particularly XGBoost, CatBoost, and Extra Trees, has shown superior accuracy and generalization capability due to their ability to handle feature interactions and reduce overfitting through built-in regularization techniques (de-Prado-Gil et al., Reference de-Prado-Gil, Palencia, Silva-Monteiro and Martínez-García2022; Rajakarunakaran et al., Reference Rajakarunakaran, Lourdu, Muthusamy, Panchal, Jawad Alrubaie, Musa Jaber, Ali, Tlili, Maseleno, Majdi and Ali2022).
However, several limitations persist in existing literature. Many studies focus on conventional concrete or use datasets limited in size, diversity, or feature space (de-Prado-Gil et al., Reference de-Prado-Gil, Palencia, Silva-Monteiro and Martínez-García2022; Jagadesh et al., Reference Jagadesh, de Prado-Gil, Silva-Monteiro and Martínez-García2023). Others evaluate only a single ML algorithm without comparison to alternative approaches, which limits generalizability and practical guidance for model selection. Importantly, very few studies have applied ML to predict the compressive strength of SCC containing recycled aggregates, despite the increasing relevance of such systems in sustainable infrastructure. Furthermore, interpretability remains a concern. Most ML models, particularly black-box types such as neural networks, offer little insight into which input variables most significantly affect the predictions, making it difficult for engineers to trust or apply these models in practical design workflows (Liu et al., Reference Liu, Alam, Zhu, Zheng and Chi2021).
To bridge these gaps, this study makes three distinct contributions relative to prior ML studies on SCC. First, it employs a substantially larger and more heterogeneous database—582 unique mixes compiled from more than 35 independent experimental studies—than the single-source or limited datasets used in earlier work. Second, rather than evaluating a single algorithm, it systematically benchmarks seven models spanning three algorithmic families (bagging, boosting, and instance-based) under an identical training and validation protocol, providing direct guidance for model selection. Third, it integrates Permutation Feature Importance (PFI) to convert the best-performing model into an interpretable, engineering-relevant tool rather than a black-box predictor. A large-scale database comprising 582 unique SCC mix designs with recycled aggregates was utilized, representing a broad spectrum of input variables, including binder content, water content, fine and coarse aggregates, recycled aggregate proportion, superplasticizer dosage, and curing time. The study evaluates and compares the performance of seven ML algorithms, including bagging-based models (Bagging Regressor and Extra Trees Regressor), boosting-based models (XGBoost, CatBoost, AdaBoost), and instance-based models (K-Nearest Neighbors (KNN) and Radius Neighbors (RN)). Each model was rigorously trained and validated using stratified data splits and optimized through a grid search and cross-validation process to ensure robust generalization. Model performance was assessed using standard metrics—coefficient of determination (R 2), root mean squared error (RMSE), and mean absolute error (MAE)—across training, validation, and testing datasets. Beyond predictive accuracy, the study employed PFI to quantify the contribution of each input variable toward the predicted compressive strength, offering transparency and aiding mix design decisions. By systematically comparing multiple ML algorithms and interpreting their outputs through both statistical and engineering lenses, this study contributes a robust and interpretable predictive model for the compressive strength of SCC with recycled aggregates.
2. Ml models and evaluation metrics
2.1. ML models
In artificial intelligence, ML is a fundamental method allowing computers to learn from data without explicit programming (Khan et al., Reference Khan, Rasul and Pimanmas2026c). Jovel and Greiner (Reference Jovel and Greiner2021) and Saraswat and Raj (Reference Saraswat and Raj2021) classify ML techniques as supervised, unsupervised, and reinforcement learning. While unsupervised learning identifies trends in unlabeled data (Jovel and Greiner, Reference Jovel and Greiner2021), supervised learning trains models on labeled data to provide predictions. In several sectors, including biological research and drug discovery, ML algorithms can analyze vast amounts of data and produce faster and more accurate results (Khan et al., Reference Khan, Naveed, Rasheed and Pimanmas2025c). Classification and regression challenges provide additional divisions of supervised learning (Bakshi and Bakshi, Reference Bakshi and Bakshi2018). The effectiveness of ML models depends on factors such as data quality, algorithm selection, and proper training to avoid issues like overfitting (Khan et al., Reference Khan, Naveed, Rasheed and Pimanmas2024). ML provides robust tools for leveraging extensive data and addressing complex issues across various fields as it continues to evolve.
2.1.1. Bagging-based models
Bagging embodies an ensemble learning approach that enhances the effectiveness of unstable estimators or classifiers, especially in the context of high-dimensional data (Bühlmann and Yu, Reference Bühlmann and Yu2002). The method operates by generating several bootstrap samples from the training data, utilizing the learning algorithm on each sample, and subsequently averaging the predictions that result from this process (Buja and Stuetzle, Reference Buja and Stuetzle2002). Bagging serves to diminish variance and mean squared error by softening difficult decisions; however, it simultaneously introduces an increase in bias (Bühlmann and Yu, Reference Bühlmann and Yu2002; Buja and Stuetzle, Reference Buja and Stuetzle2002). A more cost-effective approach known as subagging, which relies on subsampling, demonstrates comparable accuracy to bagging (Bühlmann and Yu, Reference Bühlmann and Yu2002). Bagging has found extensive application in the field of remote sensing, serving important roles in areas such as crop yield prediction, estimation of forest structure parameters, mapping of natural hazards, and the spatial downscaling of climate parameters and land surface temperature (Zhang et al., Reference Zhang, Liu and Shen2022). It is noteworthy that both bagging with replacement and without replacement can yield comparable outcomes when suitable resample sizes are selected (Buja and Stuetzle, Reference Buja and Stuetzle2002).
Extra Trees represent a collective ML approach specifically designed to address supervised classification and regression challenges. This approach expands upon the concept of random forests by incorporating additional randomization into the construction of trees (Geurts et al., Reference Geurts, Ernst and Wehenkel2006). This algorithm effectively randomizes the selection of attributes and cuts points while splitting tree nodes, which may lead to entirely randomized trees that operate independently of the output values (Geurts et al., Reference Geurts, Ernst and Wehenkel2006). Like other tree-based approaches, Extra Trees can handle various types of predictor variables, address missing data, and inherently account for interaction effects among predictors (Elith et al., Reference Elith, Leathwick and Hastie2008). This approach demonstrates computational efficiency and resilience to overfitting (Liaw and Wiener, Reference Liaw and Wiener2002). Ensemble methods such as Extra Trees and other techniques like random forests and boosted regression trees typically demonstrate superior predictive performance compared to conventional single-tree models (Elith et al., Reference Elith, Leathwick and Hastie2008; Loh, Reference Loh2011). Applying these methods is especially beneficial for representing intricate and nonlinear relationships within various ecological and scientific fields.
2.1.2. Boosting-based models
XGBoost (eXtreme Gradient Boosting) embodies a robust ML algorithm known for its exceptional prediction accuracy, interpretability, and versatility in classification tasks (Ali et al., Reference Ali, Abduljabbar, Tahir, Bibo Sallow and Almufti2023). This method is an ensemble approach that constructs decision trees incrementally, focusing on the optimization of a chosen differentiable loss function (Fafalios et al., Reference Fafalios, Charonyktakis and Tsamardinos2020). The advantages of XGBoost are evident in its ability to scale, its portability, and its capacity for distributed processing, which enables it to manage billions of instances with remarkable efficiency (Chen and Guestrin, Reference Chen and Guestrin2016). The algorithm utilizes innovative methods, including a sparsity-aware approach designed for handling sparse data and a weighted quantile sketch for approximate tree learning (Chen and Guestrin, Reference Chen and Guestrin2016). XGBoost has gained significant popularity in addressing regression and classification challenges, especially within the realms of scientific computing, data science, and ML applications (Ali et al., Reference Ali, Abduljabbar, Tahir, Bibo Sallow and Almufti2023). The increasing popularity of this approach in ML competitions has played a significant role in its widespread adoption in recent years (Fafalios et al., Reference Fafalios, Charonyktakis and Tsamardinos2020). XGBoost integrates both L1 (Lasso) and L2 (Ridge) regularization terms into its objective function, which helps mitigate overfitting and improve the model’s generalization, making it especially suitable for high-dimensional and noisy datasets, such as those encountered in concrete material research.
The objective function in XGBoost is composed of two key elements: a differentiable convex loss function l(yi, yi), which quantifies the discrepancy between the predicted and actual values, and a regularization term Ω(f), which penalizes the model’s complexity. The regularization component serves to mitigate the formation of excessively complex trees by imposing constraints on both the number of leaves and the magnitude of leaf weights, as illustrated in Eq. (1):

where T refers to the total count of leaves, while ω signifies the vector comprising the weights assigned to each leaf, the symbol λ indicates the coefficient associated with L2 regularization, and γ denotes the cost incurred in terms of complexity for each additional leaf introduced. In order to enhance the efficiency of this function, XGBoost employs a second-order Taylor expansion of the loss function. This approach transforms the problem into a format that is amenable to quadratic optimization, as illustrated in Eq. (2):

In this expression, g 𝑖 and ℎ𝑖 represent the first- and second-order gradients of the loss function concerning the predicted output for the i-th instance.
This formulation enables an accurate assessment of tree structure and leaf weights. Additional simplification is attained by consolidating gradients across the instances 𝑖 ∈ I j that are categorized within leaf j. The function is presented in a more concise manner, as illustrated in Eq. (3).

This regularized formulation enhances computational efficiency while also improving generalization by reducing overfitting.
CatBoost is an ensemble ML model that utilizes gradient-boosted decision trees and demonstrates a remarkable ability to manage categorical features (Dorogush et al., Reference Dorogush, Ershov and Gulin2018). The findings indicate that it has exhibited remarkable performance across a range of applications, characterized by notable accuracy (Joshi et al., Reference Joshi, Saggar, Jain, Sharma, Gupta and Khanna2021). CatBoost demonstrates notable efficacy in handling large-scale data challenges that encompass diverse and categorical datasets (Hancock and Khoshgoftaar, Reference Hancock and Khoshgoftaar2020). CatBoost, functioning as a boosting algorithm, integrates predictions from various base models to attain exceptional performance across a range of machine-learning applications (Mienye and Sun, Reference Mienye and Sun2022). The model demonstrates notable strengths, particularly in its Graphics Processing Unit (GPU) implementation for learning and Central Processing Unit (CPU) implementation for scoring, both of which offer considerable speed advantages over other gradient-boosting libraries (Dorogush et al., Reference Dorogush, Ershov and Gulin2018). Nonetheless, the effectiveness of CatBoost is notably influenced by the tuning of hyperparameters, highlighting the critical role of optimization (Hancock and Khoshgoftaar, Reference Hancock and Khoshgoftaar2020).
AdaBoost (Adaptive Boosting) embodies a significant advancement in ML, as it systematically improves the performance of weak learners by concentrating on instances that have been misclassified (Freund and Schapire, Reference Freund and Schapire1999). The process involves allocating weights to training instances, which are subsequently adjusted based on the performance of each weak learner. This method culminates in integrating these learners into a robust classifier (Schapire, Reference Schapire1999). The effectiveness of AdaBoost can be attributed to its capacity to mitigate overfitting and its connection to support vector machines (Freund and Schapire, Reference Freund and Schapire1999). AdaBoost was specifically designed to filter out instances that exhibit high relative estimation errors (Solomatine and Shrestha, Reference Solomatine and Shrestha2004). This model has enhanced performance relative to other boosting methods, bagging, and ANNs across various applications, including hydrological modeling (Solomatine and Shrestha, Reference Solomatine and Shrestha2004). The adaptability and efficacy of AdaBoost have contributed to its widespread adoption within ML (Tu et al., Reference Tu, Liu and Xu2017).
2.1.3. Instance-based models
KNN represents a straightforward yet powerful ML algorithm that is employed for both classification and regression tasks (Taunk et al., Reference Taunk, De, Verma and Swetapadma2019). The system functions by retaining all accessible data points and categorizing new instances according to their resemblance to the pre-existing dataset (Gangula and Venkateswarlu, Reference Gangula and Venkateswarlu2024). The strength of KNN is found in its straightforwardness and efficiency, especially when applied to large datasets characterized by low dimensions (Kramer and Kramer, Reference Kramer2013). The algorithm’s performance is shaped by various factors, including the selection of the k value, the method used for distance calculation, and the suitability of the predictors (Zhang, Reference Zhang2016). Although KNN finds extensive use in numerous fields, it is essential to acknowledge its limitations (Gangula and Venkateswarlu, Reference Gangula and Venkateswarlu2024). In response to these limitations, scholars have created enhanced iterations of the KNN algorithm (Taunk et al., Reference Taunk, De, Verma and Swetapadma2019). The algorithm demonstrates a remarkable adaptability, applicable to various tasks such as multi-label classification, regression, and semi-supervised learning challenges (Kramer and Kramer, Reference Kramer2013). Although KNN is straightforward in its approach, it holds significant value within the dynamic field of ML and artificial intelligence (Gangula and Venkateswarlu, Reference Gangula and Venkateswarlu2024).
The RN algorithm is a supervised, instance-based ML approach that combines simplicity with effectiveness in analyzing extensive datasets, while ensuring rapid execution and minimal use of runtime space (Rossikova et al., Reference Rossikova, Li, Morreale and Qiu2016). This approach exhibits parallels with the KNN algorithm. This method is extensively used in pattern recognition and ML for classification and regression (Kramer and Kramer, Reference Kramer2013). Both methods rely on classification based on proximity, where available data points are stored, and new cases are classified according to their similarity to the existing data (Gangula and Venkateswarlu, Reference Gangula and Venkateswarlu2024). KNN and RN demonstrate notable effectiveness when applied to large datasets with low dimensionality (Kramer and Kramer, Reference Kramer2013). Careful consideration of various factors is essential for these algorithms, including the number of neighbors, methods for calculating distance, and selecting suitable predictors, all of which contribute to optimizing model performance (Zhang, Reference Zhang2016). Although KNN and RN find utility in various fields, their performance may be affected by the particular nature of the problem and the attributes of the dataset involved.
2.2. Evaluation metrics for the performance of ML models
Performance metrics play a crucial role in evaluating ML models. Although metrics such as RMSE and MAE are frequently employed, they possess certain limitations regarding their interpretability (Chicco et al., Reference Chicco, Warrens and Jurman2021). R
2 is suggested as a more insightful and accurate measure for assessing regression analysis (Chicco et al., Reference Chicco, Warrens and Jurman2021). The frameworks in question enable a comprehensive evaluation of models, assist in the development of tailored regression models, and provide support for the processes of model selection, parameter tuning, and optimization (Van Thieu, Reference Van Thieu2024). Various metrics enable researchers to assess, compare, and refine ML algorithms and models in a meaningful way. In Eqs. (4–6), where n represents the total number of datasets, the predicted values are denoted by
$ {\hat{y}}_i $
 and the actual values
$ {y}_i $
 , with
$ \overline{y} $
 represents the mean of the actual values.


The RMSE and MAE have the same units (MPa) as the compressive strength. In contrast, R 2 is represented as a unitless value. The lower values of RMSE and MAE, alongside the higher values of R 2, suggest an outstanding accuracy in the predictive outcomes of ML models.
3. Research methodology
The primary objective of this study is to develop a robust data-driven model for predicting the compressive strength of recycled aggregate-based SCC. As illustrated in Figure 1, the methodology begins with the establishment of a comprehensive experimental database, which involves selecting relevant input parameters and collecting data from previous experimental studies. These parameters include binder content, water, coarse aggregate, fine aggregate, recycled aggregate, superplasticizer, and curing time. Following the formulation of the dataset, a series of supervised ML models are trained and evaluated, including ensemble models from the boosting and bagging families as well as instance-based algorithms. The performance of these models is rigorously assessed using statistical metrics, including R 2, RMSE, and MAE. After model evaluation, a comparative analysis is conducted within each algorithmic group to identify the model with the best generalization performance. Subsequently, PFI is employed to quantify the relative contribution of each input variable toward strength prediction. The final stage involves selecting the most accurate and stable prediction model, which provides a reliable tool for optimizing mix designs and promoting the sustainable use of recycled materials in concrete construction.
Methodological framework.

Figure 1. Long description
The flowchart consists of five main stages connected by downward-pointing arrows.
1. At the top, a white box defines the objective: Prediction of compressive strength of recycled aggregate-based concrete.
2. A grey section follows, starting with Establish a dataset, which branches into two sub-steps: Select input parameters and Collect experimental data.
3. A blue section follows for Train M L models. This branches into three categories: Bagging-based models, Boosting-based models, and Instance-based models.
4. A green section follows for Model evaluation. This branches into three comparative tasks: Comparison among Bagging-based models, Comparison among Boosting-based models, and Comparison among Instance-based models.
5. An orange box follows for Permutation feature importance analysis.
6. The final white box at the bottom represents the outcome: Final prediction model.
3.1. Dataset compilation and description
The foundation of this study lies in the development of a comprehensive and diverse experimental dataset for modeling the compressive strength of SCC incorporating recycled aggregates. A total of 582 unique SCC mix designs were compiled from over 35 peer-reviewed publications spanning the last two decades. The number of records contributed by each source ranges from 1 to 80 (median ≈ 10); the five largest sources account for approximately 43% of the records and the ten largest for approximately 64%, reflecting the concentration of SCC-with-recycled-aggregate testing within a limited number of research groups. The record-level source attribution for all 582 mixes is provided in the publicly available dataset to ensure full transparency of the dataset composition (Lam et al., Reference Lam, Wong and Poon1998; Poon et al., Reference Poon, Lam and Wong2000, Reference Poon, Azhar, Anson and Wong2001, Reference Poon, Kou and Lam2002, Reference Poon, Shui, Lam, Fok and Kou2004a, Reference Poon, Shui and Lam2004b, Reference Poon, Kou and Lam2007; sun Poon and Azhar, Reference sun Poon and Azhar2003; Poon and Ho, Reference Poon and Ho2004; Kou et al., Reference Kou, Poon and Chan2007, Reference Kou, Poon and Agrela2011; Kou and Poon, Reference Kou and Poon2008; Güneyisi et al., Reference Güneyisi, Gesolu and Özbay2010; Schoppe, Reference Schoppe2011; Uysal and Sumer, Reference Uysal and Sumer2011; Ali and Al-Tersawy, Reference Ali and Al-Tersawy2012; Revathi et al., Reference Revathi, Selvi and Velin2013; Gesoglu et al., Reference Gesoglu, Güneyisi, Öz, Taha and Yasemin2015; Kou and Poon, Reference Kou and Poon2015; Ranjbar and Mousavi, Reference Ranjbar and Mousavi2015; Yang et al., Reference Yang, Yue, Liu and Tong2015; Sadrmomtazi et al., Reference Sadrmomtazi, Dolati-Milehsara, Lotfi-Omran and Sadeghi-Nik2016; Aslani et al., Reference Aslani, Ma, Wan and Muselin2018; Duan et al., Reference Duan, Liao, Ma, Cheng, Fang, Gao and Yang2018; Fiol et al., Reference Fiol, Thomas, Muñoz, Ortega-López and Manso2018; Hilal and Kareem, Reference Hilal and Kareem2018; Mohamed, Reference Mohamed2018; Wan et al., Reference Wan, Aslani and Ma2018; Chunchu and Putta, Reference Chunchu and Putta2019; Mohammed et al., Reference Mohammed, Al-Hadithi and Mohammed2019; Sadeghi-Nik et al., Reference Sadeghi-Nik, Berenjian, Alimohammadi, Lotfi-Omran, Sadeghi-Nik and Karimaei2019; Sasanipour and Aslani, Reference Sasanipour and Aslani2019; Bidabadi et al., Reference Bidabadi, Akbari and Panahi2020; Duan et al., Reference Duan, Singh, Xiao and Hou2020; Poongodi et al., Reference Poongodi, Murthi, Awoyera, Gobinath and Olalusi2021; Faraj et al., Reference Faraj, Mohammed, Mohammed, Omer and Ahmed2022; Mohammed et al., Reference Mohammed, Asaad and Al-Hadithi2022). These sources were selected to ensure diversity in material types, mix proportions, testing methods, and geographic conditions, thereby capturing a broad range of real-world scenarios. We note, however, that although more than 35 studies are represented, a portion of the records originates from a smaller number of research groups, reflecting the concentration of SCC-with-recycled-aggregate testing in the literature. A breakdown of the number of records per source is provided to make this composition transparent. Each mix entry in the dataset includes corresponding input variables and target output values derived from laboratory testing of hardened concrete. The resulting database of 582 records is larger than, and at least comparable in breadth to, the datasets used in most prior ML studies on SCC with recycled aggregates, which typically draw on a few hundred records from a smaller number of sources. More importantly, its wide coverage of binder, water, aggregate, admixture, and curing ranges ensures that the parameter space relevant to practical SCC mix design is well represented, supporting the development of generalizable models.
The input parameters extracted from the literature include binder content (kg/m3), fine aggregate (kg/m3), coarse aggregate (kg/m3), recycled aggregate (kg/m3), water content (kg/m3), superplasticizer dosage (kg/m3), and curing time (days). These seven features were selected based on their established influence on concrete workability and mechanical properties, particularly in SCC mixtures, where flow characteristics and segregation resistance are highly sensitive to material ratios. The compressive strength (MPa), measured at various curing ages (ranging from 7 to 400 days), serves as the dependent variable in the modeling process. Curing age is incorporated explicitly as one of the seven input features (curing time, in days); consequently, the model accounts directly for the influence of age on strength development, and the same mix design tested at different ages is represented as distinct records with their respective measured strengths.
The collected data was carefully curated to eliminate inconsistencies and ensure dimensional uniformity. Units were standardized across all sources, and mix designs with missing or incomplete strength measurements were excluded. When available, mixtures tested under standard curing conditions (20 ± 2 °C, 95% relative humidity) were prioritized to maintain consistency. Special attention was given to maintaining the full heterogeneity of the input variables in order to improve the generalizability of the ML models across different concrete compositions and performance ranges. Because the database aggregates results from more than 35 laboratories, variability in raw-material sources, specimen geometry, and testing protocols inevitably introduces a degree of inter-study noise. Unit standardization, exclusion of incomplete or inconsistent records, prioritization of standard curing conditions, and training-set-only normalization were applied to reduce systematic inconsistencies, while genuine physical variability was deliberately preserved so that the models learn relationships that hold across diverse practical conditions rather than the idiosyncrasies of a single source.
Table 1 presents a sample of the compiled dataset, illustrating the range and variety of SCC-based mix designs included in this study. The table reflects significant variation in key input parameters: binder content ranged from 300 to 702 kg/m3, water content from 112 to 271 kg/m3, superplasticizer dosage from 0 to 35.1 kg/m3, and curing time from 7 to 400 days. This variation is crucial for training robust models that can handle the complex interactions inherent in recycled concrete systems.
Sample entries from the dataset

Table 1. Long description
The table consists of nine columns: Binder content (k g / m super 3), Fine aggregate (k g / m super 3), Coarse aggregate (k g / m super 3), Recycled aggregate (k g / m super 3), Water (k g / m super 3), Superplasticizer (k g / m super 3), Curing time (Days), Compressive strength (M P a), and References.
Key data entries include:
* Row 1: 500 binder, 725 fine aggregate, 1087 coarse aggregate, 0 recycled aggregate, 150 water, 0.5 superplasticizer, 28 days curing, 77.2 M P a strength (Poon et al. 2002).
* Row 8: 410 binder, 642 fine aggregate, 0 coarse aggregate, 1017 recycled aggregate, 225 water, 0 superplasticizer, 28 days curing, 30.48 M P a strength (Kou et al. 2007).
* Row 18: 550 binder, 784 fine aggregate, 745 coarse aggregate, 14 recycled aggregate, 176 water, 7 superplasticizer, 28 days curing, 76.4 M P a strength (Faraj et al. 2022).
* Row 28: 550 binder, 866 fine aggregate, 775 coarse aggregate, 0 recycled aggregate, 181.5 water, 8.8 superplasticizer, 400 days curing, 101.8 M P a strength (Uysal and Sumer Reference Uysal and Sumer2011).
* Row 37: 615 binder, 660 fine aggregate, 585 coarse aggregate, 195 recycled aggregate, 246 water, 1.53 superplasticizer, 28 days curing, 40.73 M P a strength (Duan et al. 2020).
To further understand the statistical characteristics of the dataset, Table 2 summarizes the mean, standard deviation, minimum, and maximum values of each input and output parameter. For instance, the average compressive strength across all mixes was 48.84 MPa, with a standard deviation of 20.32 MPa, highlighting the broad strength spectrum, from early-age low-strength SCC to high-performance concrete exceeding 100 MPa. Similarly, the recycled aggregate content ranged from 0 to 1642 kg/m3, indicating that the dataset covers mixtures with partial to complete replacement of recycled aggregate. The records with zero recycled aggregate content correspond to control (reference) mixtures produced entirely with natural aggregate; these were intentionally retained so that the models learn behavior across the full range of replacement levels, from conventional SCC to fully recycled-aggregate mixes, and do not indicate a dataset inconsistency.
Descriptive statistics of the input and output variables used in model training
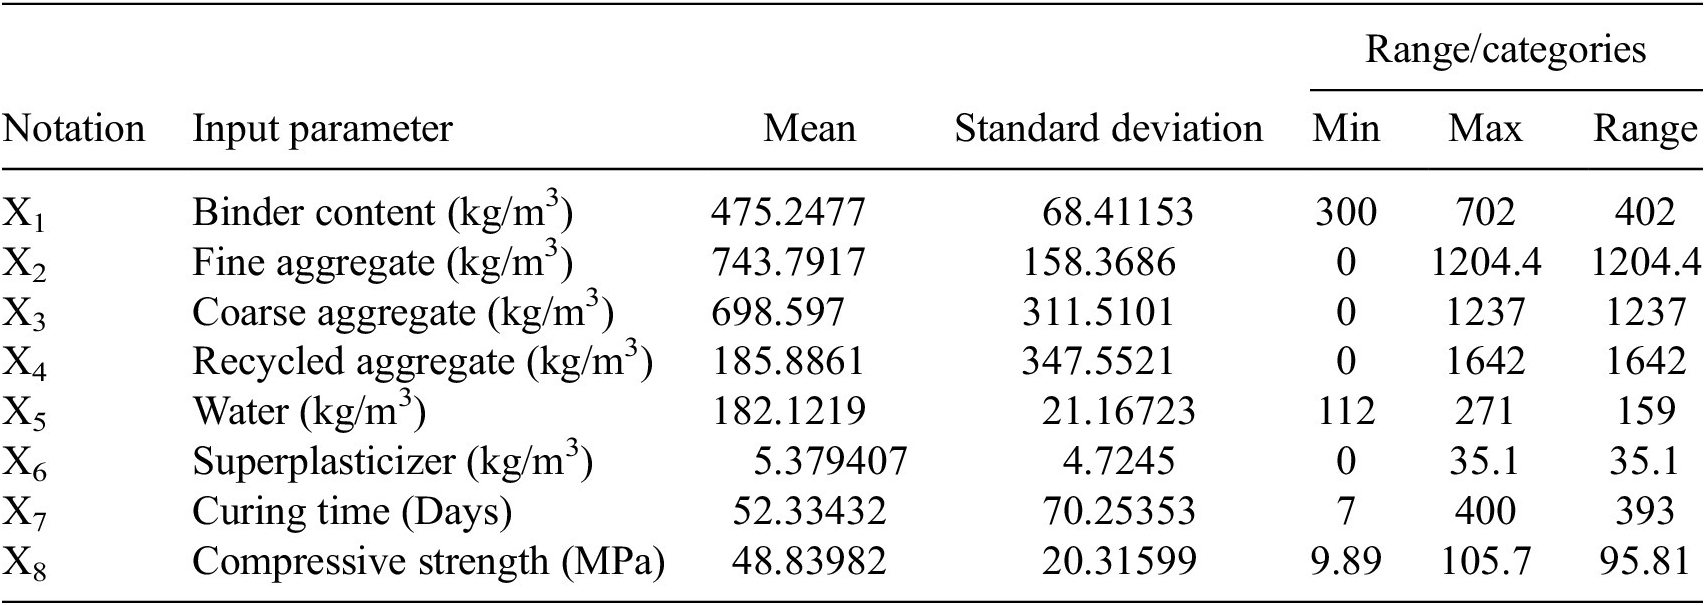
Table 2. Long description
The table consists of seven columns: Notation, Input parameter, Mean, Standard deviation, and a Range/categories section subdivided into Min, Max, and Range.
* X sub 1: Binder content (kg/m super 3). Mean 475.2477, Standard deviation 68.41153, Min 300, Max 702, Range 402.
* X sub 2: Fine aggregate (kg/m super 3). Mean 743.7917, Standard deviation 158.3686, Min 0, Max 1204.4, Range 1204.4.
* X sub 3: Coarse aggregate (kg/m super 3). Mean 698.597, Standard deviation 311.5101, Min 0, Max 1237, Range 1237.
* X sub 4: Recycled aggregate (kg/m super 3). Mean 185.8861, Standard deviation 347.5521, Min 0, Max 1642, Range 1642.
* X sub 5: Water (kg/m super 3). Mean 182.1219, Standard deviation 21.16723, Min 112, Max 271, Range 159.
* X sub 6: Superplasticizer (kg/m super 3). Mean 5.379407, Standard deviation 4.7245, Min 0, Max 35.1, Range 35.1.
* X sub 7: Curing time (Days). Mean 52.33432, Standard deviation 70.25353, Min 7, Max 400, Range 393.
* X sub 8: Compressive strength (M P a). Mean 48.83982, Standard deviation 20.31599, Min 9.89, Max 105.7, Range 95.81.
The wide dispersion and variability of the dataset not only support the development of generalizable ML models, but also provide a realistic representation of challenges faced in the practical design of SCC using recycled materials. The dataset’s heterogeneity ensures that the trained models are applicable across different mix proportions, materials, and curing conditions, making the predictive framework developed in this study valuable for both academic research and industrial implementation in sustainable concrete design.
3.2. Data splitting and preprocessing
To ensure unbiased model training and accurate performance evaluation, the compiled dataset comprising 582 SCC mix designs was systematically partitioned into three subsets: training (70%), validation (15%), and testing (15%). This stratified split ensures that each subgroup maintains the statistical diversity and distribution of the original dataset, including a broad range of compressive strengths and input variable combinations. The training set was used to develop and fit the models, the validation set was employed for hyperparameter tuning and model selection, and the testing set was reserved for final performance evaluation on unseen data.
Prior to model development, the dataset underwent essential preprocessing steps to improve model robustness and computational efficiency. All input variables were standardized using z-score normalization, which transforms each feature to have a mean of zero and a standard deviation of one. This step is critical for distance-based algorithms, such as KNN and RN, and also enhances the convergence and stability of gradient-based models, including XGBoost and CatBoost. The standardization was performed using statistics computed from the training set and applied consistently to the validation and testing sets to prevent data leakage.
During the preprocessing phase, the dataset was also examined for missing values, outliers, and redundancies. Entries with missing values or inconsistent units were excluded to ensure data integrity and accuracy. The database was additionally screened for exact duplicate records (entries identical across all input variables and the measured compressive strength); only a negligible number were identified (approximately 0.7% of records), which does not materially affect the reported results. Records sharing identical input values but differing in measured strength were retained, as they correspond to the same mix design tested at different curing ages or to replicate specimens rather than to true duplicates. While no significant outliers were removed, extreme values were retained to preserve the natural variability in concrete mix design parameters, thereby enhancing the model’s ability to generalize across a wide range of practical mix conditions.
The dataset encompasses a diverse range of mix characteristics, including binder content ranging from 300 to 702 kg/m3, water content from 112 to 271 kg/m3, recycled aggregate content from 0 to 1642 kg/m3, and compressive strength values from 9.89 to 105.7 MPa (Figure 2). Such variability ensures that the ML models are trained on a sufficiently broad parameter space, allowing them to learn both linear and nonlinear relationships among input features.
Distribution histograms of all input variables and output.

Figure 2. Long description
A multi-panel figure containing eight histograms labeled a through h. All histograms use Frequency on the Y-axis.
Panel a, Binder content, shows a normal distribution centered around 450 to 500 k g per m super 3.
Panel b, Fine aggregate, shows a peak between 750 and 850 k g per m super 3.
Panel c, Coarse aggregate, shows a primary peak at 850 k g per m super 3 and a smaller secondary peak near 0.
Panel d, Recycled aggregate, is heavily skewed right with a massive peak at 0 to 200 k g per m super 3.
Panel e, Water, shows a bimodal distribution with peaks near 175 and 200 k g per m super 3.
Panel f, Superplasticizer, is skewed right with most values between 0 and 10 k g per m super 3.
Panel g, Curing time, is skewed right with a dominant peak at 0 to 50 Days.
Panel h, Compressive strength, shows a broad distribution peaking between 25 and 40 M P a, tapering off toward 100 M P a.
To assess model generalizability, all performance metrics—R 2, RMSE, and MAE—were calculated separately for the training, validation, and testing subsets. This approach allowed the evaluation of each model’s fitting behavior, overfitting tendencies, and real-world predictive capability. Furthermore, five-fold cross-validation was performed on the training set during hyperparameter optimization to reduce variance in performance estimates further.
Through careful data preprocessing and dataset splitting, this study aims to train and evaluate the ML models under realistic conditions. It should be noted that, because the database aggregates records from multiple source studies, observations originating from the same study may be correlated; the reported metrics therefore reflect performance under a random-split protocol and may be optimistic relative to a source-independent (grouped) evaluation. As the full dataset is publicly available, performance under alternative splitting schemes can be independently assessed, which we identify as a valuable direction for future work.
3.3. Model development
The development of ML models in this study was structured around three algorithmic categories: bagging-based, boosting-based, and instance-based models. Each model was trained using the standardized dataset and optimized through grid search and five-fold cross-validation (Table 3). The primary objective during model development was to minimize prediction errors while maintaining generalizability across the wide variability of SCC mix designs with recycled aggregates.
Optimized hyperparameters for all machine learning models

Table 3. Long description
The table is organized into three columns: Model, Hyperparameter, and Value.
* Bagging: max_features is 0.75, max_samples is 1, and n_estimators is 100.
* Extra trees: max_depth is 30, max_features is sqrt, min_samples_leaf is 1, min_samples_split is 2, and n_estimators is 150.
* CatBoost: depth is 6, iterations is 300, and learning_rate is 0.1.
* AdaBoost: estimator__max_depth is 7, learning_rate is 0.1, and n_estimators is 150.
* XGBoost: colsample_bytree is 0.8, learning_rate is 0.05, max_depth is 7, n_estimators is 150, and subsample is 1.
* K N N: n_neighbors is 9, weights is distance, and metric (p) is manhattan (p = 1).
* R N: radius is 5.0, weights is distance, and metric (p) is manhattan (p = 1).
Model training was conducted on the 70% training subset, and hyperparameters were tuned using the 15% validation set. Following optimization, the models were assessed on the independent 15% test set to evaluate their real-world predictive capacity. All models were developed using Python’s scikit-learn and XGBoost libraries, and their predictions were compared against experimental compressive strength values using R 2, RMSE, and MAE.
3.3.1. Bagging-based Models
Bagging demonstrated optimal performance using 100 estimators, incorporating 75% of the features at each split (“max_features = 0.75”) and employing the complete dataset for each base learner (“max_samples = 1.0”). This approach effectively enhanced ensemble diversity and the stability of the model. Lastly, the grid search for the Extra Trees identified an optimal maximum depth of 30, accompanied by 150 estimators. The model utilized the square root of the total number of features for each split (“max_features = sqrt”), establishing a minimum sample requirement of 2 for splitting nodes and 1 for leaf nodes. The implemented settings proved to be effective in utilizing the model’s randomization capabilities to minimize variance.
3.3.2. Boosting-based models
The grid search process for the AdaBoost model identified an optimal learning rate of 0.1, 150 estimators, and a maximum depth of 7 for the base estimator. This approach enabled the model to identify nonlinear patterns while successfully managing the risk of overfitting. Similarly, CatBoost exhibited notable efficiency when configured with 300 boosting iterations, a depth of 6, and a learning rate of 0.1. The parameters facilitated precise learning on tabular data while minimizing the need for extensive preprocessing. The optimal configuration for the XGBoost model was identified as a learning rate of 0.05, a maximum depth of 7, and 150 estimators. Furthermore, the model demonstrated optimal performance when utilizing a column subsampling rate of 0.8 (“colsample_bytree”) alongside a row subsampling rate of 1.0 (“subsample”). These hyperparameters played a significant role in improving generalization while simultaneously minimizing the risk of overfitting.
3.3.3. Instance-based models
In addition to the ensemble models, two instance-based learning algorithms were developed and refined to enhance the prediction of the compressive strength of concrete made from recycled aggregates. The KNN model demonstrated optimal performance with the utilization of neighbors (n_neighbors = 9), the application of the Manhattan distance metric (p = 1), and the implementation of a distance-based weighting scheme (weights = “distance”). This configuration enabled the algorithm to place greater emphasis on closer neighbors, thereby enhancing the local interpolation of compressive strength values. Similarly, the RN model demonstrated optimal performance when utilizing a fixed radius of 5.0, while also incorporating the Manhattan distance (p = 1) alongside distance-based weighting. The chosen hyperparameters enabled both models to effectively adjust to the spatial distribution of data points, particularly in areas with varying densities, thereby improving their predictive accuracy.
4. Results and discussion
This study systematically evaluated the predictive capabilities of seven ML models: Extra Trees, Bagging, XGBoost, CatBoost, AdaBoost, KNN, and RN, in estimating the compressive strength of SCC that incorporates recycled aggregates. Previous studies have indicated that R 2 values falling between 0.60 and 0.75 are typically considered satisfactory. Values ranging from 0.75 to 0.95 suggest good predictive ability, while those exceeding 0.95 demonstrate excellent prediction performance. On the other hand, values that fall below 0.60 are regarded as indicative of unsatisfactory model performance (Marani and Nehdi, Reference Marani and Nehdi2020). The established thresholds served as benchmarks for evaluating the accuracy and reliability of the models developed in this study. Alongside the performance evaluation, a sensitivity analysis utilizing the PFI was conducted to assess the relative impact of each input variable on the predicted compressive strength. The results of the model performance metrics and the sensitivity analysis are thoroughly presented and discussed in the following sections. Figure 3 provides an overall comparison of all seven models across R 2, RMSE, and MAE, and is introduced here to give the reader a consolidated overview before the category-wise analysis that follows.
Comparison of model performance across three categories using R 2, RMSE, and MAE.

Figure 3. Long description
Three vertical panels compare model performance. Each chart has a primary Y-axis on the left for M A E and R M S E ranging from 0 to 10, and a secondary Y-axis on the right for R super 2 ranging from 0.0 to 1.0. Bars are color-coded: grey for M A E, orange for R M S E, and green for R super 2.
Panel a, Bagging-based models:
* Extra Trees: M A E 2.74, R M S E 3.73, R super 2 0.97.
* Bagging: M A E 2.90, R M S E 3.97, R super 2 0.96.
Panel b, Boosting-based models:
* XGBoost: M A E 1.97, R M S E 2.87, R super 2 0.98.
* CatBoost: M A E 2.48, R M S E 3.41, R super 2 0.97.
* AdaBoost: M A E 2.94, R M S E 3.96, R super 2 0.96.
Panel c, Instance-based models:
* K N N: M A E 3.15, R M S E 4.90, R super 2 0.94.
* R N: M A E 6.54, R M S E 9.94, R super 2 0.78.
4.1. Predictive performance of bagging-based models
This study investigated two widely used ensemble learning models under the bagging paradigm: the Bagging Regressor and the Extra Trees Regressor. Both models are designed to reduce the variance of predictions by combining multiple decision tree learners; however, they differ in their approach to handling randomness during training. The Bagging Regressor aggregates predictions from various decision trees trained on bootstrapped samples, whereas the Extra Trees algorithm introduces additional stochasticity by also randomizing the splitting thresholds during node formation. This distinction plays a crucial role in predictive performance.
Based on the results in Table 4, the Extra Trees consistently exhibited superior performance across the training, validation, and testing datasets. On average, it achieved an R 2 of 0.9668, an RMSE of 3.7294 MPa, and an MAE of 2.742 MPa. In comparison, Bagging yielded slightly lower performance, with R 2 = 0.962, RMSE = 3.9743 MPa, and MAE = 2.8985 MPa. These results demonstrate the improved generalization of Extra Trees in modeling the compressive strength of SCC containing recycled aggregates.
Model performance comparison using R 2, RMSE, and MAE

Table 4. Long description
The table compares seven models categorized into three groups: Bagging-based models (Extra Trees, Bagging), Boosting-based models (XGBoost, CatBoost, AdaBoost), and Instance-based models (K N N, R N). Performance is measured by R super 2, R M S E, and M A E across Training, Validation, Testing, and Average datasets.
* Training Dataset: XGBoost shows high accuracy with R super 2 of 0.9756 and R M S E of 3.0593. K N N and R N show the highest R super 2 at 0.9782 and 0.9783 respectively.
* Validation Dataset: XGBoost performs best with R super 2 of 0.9887 and the lowest R M S E of 2.3718. R N shows a significant drop in performance with R super 2 of 0.6922 and R M S E of 12.3939.
* Testing Dataset: XGBoost maintains the lead with R super 2 of 0.9754 and R M S E of 3.1183. R N remains the lowest performer with R super 2 of 0.6601.
* Average Performance: XGBoost is the most consistent model overall with an average R super 2 of 0.9799, R M S E of 2.8699, and M A E of 1.967. CatBoost follows as the second-best performer with an average R super 2 of 0.9719.
The performance trends are visually confirmed in Figure 4a,b, which present predicted versus actual compressive strength values for Extra Trees and Bagging Regressors, respectively. The Extra Trees plot shows a tighter clustering of points along the ideal diagonal line, especially for mid- to high-strength concretes (40–80 MPa). Furthermore, Figure 4a displays a more uniform distribution of residuals, indicating the absence of significant underestimation or overestimation zones. The Bagging model, while generally effective, exhibits slightly more dispersion in the low and high strength ranges, suggesting a minor predictive bias under extreme mixing conditions.
Predicted versus actual compressive strength plots for bagging-based models.

Figure 4. Long description
The image consists of two vertically stacked scatter plots, labeled a Extra Trees and b Bagging. Both plots share identical axes: the x-axis represents Actual value in M P a and the y-axis represents Predicted value in M P a, both ranging from 0 to 120.
Each plot features a solid diagonal line representing the identity line where predicted equals actual. Two dashed lines flank the identity line, representing minus 20 percent and plus 20 percent error margins. Data points are categorized into three groups:
* Training data: represented by grey circles.
* Validation data: represented by orange triangles.
* Testing data: represented by green diamonds.
In panel a Extra Trees, the data points are tightly clustered along the identity line across the entire range from 10 to 100 M P a, with very few points falling outside the 20 percent error dashed lines.
In panel b Bagging, the distribution is similar to the first plot, showing a strong linear correlation. The points are concentrated between 20 and 100 M P a, maintaining a high degree of accuracy with most values contained within the plus or minus 20 percent error bounds.
From an engineering perspective, these results highlight the benefits of enhanced randomization in high-dimensional concrete datasets. The Extra Trees model effectively captures the intricate nonlinear behavior and interaction effects inherent in SCC mixtures containing recycled aggregates. Notably, SCC mixes with higher curing times or elevated binder content—which tend to produce more dispersed strength outcomes—are more accurately modeled by Extra Trees, owing to its ability to avoid overfitting while maintaining precision in regression splits.
4.2. Predictive performance of boosting-based models
The boosting-based models examined in this study include XGBoost, CatBoost, and AdaBoost, each representing state-of-the-art ensemble learning techniques that can capture complex, nonlinear relationships in engineering data. These models improve prediction accuracy by sequentially training a series of weak learners—typically decision trees—where each subsequent model attempts to correct the errors of its predecessor. As shown in Table 4, among the boosting models, XGBoost demonstrated the highest overall accuracy across all three data subsets. It achieved an average R 2 of 0.9799, with an RMSE of 2.8699 MPa and an MAE of 1.967 MPa, outperforming both CatBoost and AdaBoost. XGBoost’s predictive superiority is attributed to its use of second-order gradient optimization, regularization techniques (L1 and L2), and internal mechanisms to handle sparse data. These features enable it to generalize effectively across diverse mix design scenarios.
The CatBoost model also demonstrated strong predictive capability, with an average R 2 of 0.9719, RMSE of 3.4061 MPa, and MAE of 2.4778 MPa. Although slightly less accurate than XGBoost, CatBoost’s competitive performance is noteworthy, especially given its built-in handling of categorical data and resistance to overfitting through ordered boosting. However, in this case, since all input variables are continuous and normalized, the edge CatBoost usually has with categorical inputs may not be fully leveraged.
AdaBoost, while demonstrating acceptable accuracy (R 2 = 0.9623, RMSE = 3.9554 MPa, and MAE = 2.9368 MPa), was clearly outperformed by XGBoost and CatBoost. AdaBoost’s strategy of focusing on hard-to-predict samples can lead to overfitting in noisy datasets or when the weak learners (decision stumps or shallow trees) fail to capture high-order interactions. This is evident in Figure 5c, where AdaBoost predictions exhibit greater variance and larger residuals at both low and high compressive strength ranges.
Predicted versus actual compressive strength plots for boosting-based models.

Figure 5. Long description
A multi-panel figure containing three vertically stacked scatter plots labeled a, b, and c.
All three plots share identical axes. The x-axis is Actual value M P a and the y-axis is Predicted value M P a, both ranging from 0 to 120. A solid black diagonal line represents the perfect prediction identity line. Two dashed lines represent the minus 20 percent and plus 20 percent error boundaries.
Each plot contains three data series. Training data is represented by grey circles, Validation data by orange triangles, and Testing data by green diamonds.
Panel a, X G Boost. The data points are tightly clustered along the identity line with very few outliers outside the 20 percent error bands. The distribution is linear from 10 to 100 M P a.
Panel b, CatBoost. The data shows a slightly wider dispersion compared to panel a, particularly in the 40 to 80 M P a range, though most points remain within the dashed error boundaries.
Panel c, AdaBoost. The data distribution is similar to panel b, with a dense concentration of points along the identity line and a few grey training data points falling slightly below the plus 20 percent boundary in the lower range.
Visual comparisons are presented in Figure 5a–c. Figure 5a (XGBoost) illustrates an almost perfect alignment between the predicted and actual compressive strengths, with the majority of points tightly clustered around the ideal 1:1 line. The plot also reveals consistent performance across strength levels (10–100 MPa), emphasizing the model’s ability to generalize across varied mix designs. Figure 5b (CatBoost) displays a similarly tight pattern, though with slightly more scatter, especially in the mid-strength range (30–60 MPa). In contrast, Figure 5c (AdaBoost) reveals larger prediction errors, especially in mixes with higher recycled aggregate content and extended curing times.
From an engineering standpoint, the exceptional performance of XGBoost confirms its suitability for modeling the complex relationships between concrete constituents and resulting compressive strength. The regularization terms in XGBoost prevent overfitting, making it especially effective when dealing with datasets collected from various sources with different experimental setups and material characteristics. This robustness is vital in practice, where mix design data often exhibits heterogeneity due to variations in recycled aggregate quality, moisture absorption, and curing environments.
4.3. Predictive performance of instance-based models
The supervised instance-based models evaluated in this study include the KNN algorithm and its variant, the RN model. Unlike ensemble models, supervised instance-based approaches are non-parametric and rely directly on the training dataset during prediction. According to Table 4, the KNN model demonstrated moderately strong predictive performance, achieving an average R 2 of 0.9435, RMSE of 4.9034 MPa, and MAE of 3.1527 MPa. The model performed well in the training phase (R 2 = 0.9782 and MAE = 0.9284 MPa), indicating high fit to known data. However, performance deteriorated during validation and testing, particularly in terms of error magnitudes, suggesting signs of overfitting and limited generalization. KNN’s reliance on local neighbors makes it prone to error when faced with sparsely populated or highly nonlinear input regions—a common issue when modeling SCC mixes with extreme proportions of recycled aggregate or unusually long curing durations.
The RN model, in contrast, yielded substantially lower predictive power. Its average R 2 was only 0.7768, with an RMSE of 9.9408 MPa and an MAE of 6.5444 MPa, indicating that the model struggled to produce accurate predictions across all datasets. This poor performance is likely due to inconsistent neighborhood density within the high-dimensional feature space. Many test points either had too few neighbors within the fixed radius or encountered overly heterogeneous local patterns, leading to unstable predictions. In some cases, the RN model effectively defaulted to averaging weakly related points, amplifying noise and bias.
Figure 6a,b offer visual validation of these observations. In Figure 6a, the KNN-predicted strengths align reasonably with actual values in the mid-strength range (30–70 MPa), but outliers become more pronounced at both ends of the spectrum. The RN model (Figure 6b) exhibits a more dispersed pattern, with many predictions deviating significantly from the ideal 1:1 line, particularly in mixes with high recycled aggregate content, where material heterogeneity leads to significant local variance.
Predicted versus actual compressive strength plots for instance-based models.

Figure 6. Long description
A two-panel vertical arrangement of scatter plots.
Panel a is labeled K N N. The x-axis is Actual value in M P a and the y-axis is Predicted value in M P a, both ranging from 0 to 120. A solid black diagonal line represents the perfect prediction identity. Two dashed lines represent minus 20 percent and plus 20 percent error margins. Data points are categorized as grey circles for Training data, orange triangles for Validation data, and green diamonds for Testing data. The points are tightly clustered along the identity line across the entire range.
Panel b is labeled R N. It uses the same axes, legend, and error lines as Panel a. In this plot, the Training data remains tightly clustered on the identity line, but the Validation and Testing data points show significantly higher dispersion, particularly between 40 and 100 M P a, with many points falling below the identity line toward the plus 20 percent error boundary.
From an engineering perspective, while KNN may be adequate for exploratory analysis or cases where rapid prediction from well-clustered data is required, it does not offer the level of reliability necessary for robust prediction of compressive strength across diverse SCC mix designs. The weakness of RN further reinforces this conclusion, showing that instance-based models are ill-suited for tasks where data heterogeneity, interaction effects, and nonlinearity dominate—conditions typical in recycled aggregate concrete design.
4.4. Predictive performance of optimal ML models
To identify the most accurate and reliable predictive model for predicting the compressive strength of SCC with recycled aggregates, a comparative evaluation of the top-performing algorithms was conducted. This included the best bagging-based model (Extra Trees), the leading boosting-based model (XGBoost), and the strongest instance-based model (K-Nearest Neighbors), as summarized in Table 5.
Summary of top-performing models by category and their prediction accuracy

Table 5. Long description
The table is structured with five columns: Datasets, Metrics, and three Best models: Extra trees, XGBoost, and K N N.
* Training Dataset:
- R super 2: Extra trees 0.9648, XGBoost 0.9756, K N N 0.9782.
- R M S E: Extra trees 3.6788, XGBoost 3.0593, K N N 2.8937.
- M A E: Extra trees 2.4158, XGBoost 1.5967, K N N 0.9284.
* Validation Dataset:
- R super 2: Extra trees 0.974, XGBoost 0.9887, K N N 0.949.
- R M S E: Extra trees 3.6015, XGBoost 2.3718, K N N 5.0431.
- M A E: Extra trees 2.7087, XGBoost 1.8896, K N N 3.7867.
* Testing Dataset:
- R super 2: Extra trees 0.9615, XGBoost 0.9754, K N N 0.9032.
- R M S E: Extra trees 3.9014, XGBoost 3.1183, K N N 6.1906.
- M A E: Extra trees 3.1016, XGBoost 2.4148, K N N 4.7431.
* Average:
- R super 2: Extra trees 0.9668, XGBoost 0.9799, K N N 0.9435.
- R M S E: Extra trees 3.7294, XGBoost 2.8699, K N N 4.9034.
- M A E: Extra trees 2.742, XGBoost 1.967, K N N 3.1527.
Among these, XGBoost emerged as the overall best performer, consistently delivering superior results across the training, validation, and testing phases. Specifically, XGBoost achieved:
-
• R 2 = 0.9756 (training), 0.9887 (validation), and 0.9754 (testing)
-
• RMSE = 3.0593 MPa, 2.3718 MPa, and 3.1183 MPa, respectively
-
• MAE = 1.5967 MPa, 1.8896 MPa, and 2.4148 MPa, respectively
This level of performance reflects XGBoost’s ability to model complex, nonlinear relationships and subtle interaction effects between input variables, which is critical in SCC systems with recycled aggregates, where compressive strength is influenced by interdependent factors such as binder type, recycled aggregate content, curing conditions, and superplasticizer dosage.
The Extra Trees, although slightly less accurate, maintained high performance with an average R 2 of 0.9668 and low error metrics (RMSE = 3.7294 MPa and MAE = 2.742 MPa). It proved more stable than KNN and less sensitive to data scaling. Its advantage lies in its randomized tree splits and efficient ensemble averaging, which provide robustness against noisy data. On the other hand, the KNN model, while demonstrating strong training accuracy (R 2 = 0.9782), suffered from notable performance degradation in the validation and testing subsets (R 2 = 0.949 and 0.9032, respectively), with corresponding increases in RMSE and MAE. This overfitting tendency reflects KNN’s sensitivity to the density and distribution of training samples. Its reliance on local proximity without a generalized learning framework restricts its utility for high-dimensional, heterogeneous SCC datasets.
Figure 3 illustrates the overall comparison across all models, while Figures 4–6 provide predicted versus actual plots highlighting the precision of each model’s outputs. Notably, Figure 5a (XGBoost) shows nearly perfect alignment along the 1:1 line, while Figures 4a (Extra Trees) and 6a (KNN) exhibit more spread in residuals, particularly in regions corresponding to low- or high-strength mixes. Sample-wise prediction errors (Figure 7) support this conclusion, as XGBoost consistently maintains low error magnitudes, whereas KNN and, especially, RN exhibit high variability.
Sample-wise prediction errors for top models in each category.

Figure 7. Long description
A three-panel vertical stack of line graphs. Each graph shares the same axes: the x-axis is Sample from 0 to 600. The left y-axis is Compressive strength in M P a from 0 to 120. The right y-axis is Error in M P a from -20 to 100. Vertical dashed lines divide each graph into Training, Validation, and Testing phases at approximately sample 410 and 500.
* Panel a, Extra Trees: Shows a high degree of overlap between the orange Actual line and green Predicted line. Error bars at the bottom fluctuate mostly between -10 and 10 M P a.
* Panel b, XGBoost: Displays similar trends to Extra Trees with the green Predicted line closely following the orange Actual line across all three phases.
* Panel c, K N N: Shows slightly more divergence between Actual and Predicted values compared to the previous models, particularly in the Validation and Testing phases, with error spikes reaching closer to 20 M P a.
In all panels, the data is highly volatile, oscillating rapidly between 20 and 100 M P a. The error is represented by a grey bar chart along the bottom baseline of each plot.
In practical engineering terms, the superiority of XGBoost translates to more reliable performance under varying mix designs, including:
-
• High variability in recycled aggregate quality
-
• Diverse curing durations (ranging from 7 to 400 days)
-
• Mixes with and without superplasticizer use
-
• Wide binder content range (300–702 kg/m3)
The regularization capabilities of XGBoost (through L1 and L2 penalties), its ability to handle collinearity and noise, and its gradient-based optimization make it a fit-for-purpose tool in real-world applications where data inconsistencies and multidimensionality are typical. Moreover, its minimal tuning overhead and high interpretability, thanks to built-in feature importance metrics, make it highly suitable for deployment in design-stage decision support systems for sustainable SCC production. In practice, the model can be applied in two ways. First, at the mix-design stage, it serves as a rapid screening tool, allowing engineers to estimate the compressive strength of candidate proportions and narrow the design space before committing to laboratory trials. Second, because it relies on only seven routinely available mix-proportion inputs, the trained model can be integrated directly into a spreadsheet or a lightweight software tool to provide instant strength estimates within an existing mix-design workflow.
In summary, XGBoost is the recommended model for predicting the strength of SCC with recycled aggregates, offering a balance of predictive power, robustness, and practical utility across diverse material and environmental conditions. It should be emphasized that the model is intended for use within the documented range of the training data (e.g., binder 300–702 kg/m3, recycled aggregate 0–1642 kg/m3, and curing 7–400 days). As the ensemble models cannot reliably extrapolate beyond these bounds, predictions for inputs outside the training domain should be regarded as indicative only and verified experimentally.
5. Input parameters and their effects
5.1. Feature importance analysis
To further understand the underlying relationships between input parameters and the predicted compressive strength of SCC containing recycled aggregates, a PFI analysis was conducted using the XGBoost model, which was previously identified as the most accurate among the ML models evaluated. The PFI technique involves systematically shuffling each input variable and quantifying the resulting increase in prediction error, thus indicating how heavily the model relies on each feature for accurate predictions. PFI was chosen because it is model-agnostic, directly grounded in predictive performance, computationally efficient, and readily interpretable by practitioners. It should be noted, however, that PFI can be affected by correlation among input variables, since permuting one feature may create physically implausible combinations and redistribute importance among correlated predictors; results are therefore interpreted at the level of broad parameter influence rather than exact rank order. Alternative attribution methods such as SHAP offer additive, locally consistent explanations but at higher computational cost and under their own dependence assumptions, and represent a worthwhile direction for future work.
According to the results summarized in Table 6 and visualized in Figure 8, binder content was by far the most influential variable, producing a permutation-induced MAE increase of approximately 11.05 MPa (normalized PFI = 0.633)—more than 1.4 times the effect of the next most important feature. Water content (≈ 7.49 MPa; 0.256) and coarse aggregate (≈ 7.43 MPa; 0.245) followed at comparable levels, while curing time (≈ 5.00 MPa; 0.135) and recycled aggregate content (≈ 4.69 MPa; 0.092) had moderate influence. Fine aggregate (≈ 4.26 MPa; 0.069) and superplasticizer dosage (≈ 3.08 MPa; 0.028) were the least influential, each contributing well below half the effect of binder content. This is consistent with conventional concrete mix design knowledge, as the binder governs paste volume and directly affects hydration reactions, strength development, and microstructural densification. In SCC mixes using recycled aggregates, which often have irregular surfaces and lower intrinsic strength, the role of binder becomes even more critical in compensating for potential weaknesses in the interfacial transition zone (ITZ).
PFI results showing the effect of individual input variables on compressive strength prediction

Table 6. Long description
The table consists of three columns: Input parameter, P F I, and M A E sub Perm. The data is organized as follows:
* Binder content (kg/m super 3): P F I 0.633420435, M A E sub Perm 11.05359394.
* Water (kg/m super 3): P F I 0.256107346, M A E sub Perm 7.492656324.
* Coarse aggregate (kg/m super 3): P F I 0.244573898, M A E sub Perm 7.431748137.
* Curing time (Days): P F I 0.135342857, M A E sub Perm 5.004351431.
* Recycled aggregate (kg/m super 3): P F I 0.092099077, M A E sub Perm 4.692300509.
* Fine aggregate (kg/m super 3): P F I 0.068643885, M A E sub Perm 4.258144094.
* Superplasticizer (kg/m super 3): P F I 0.027678152, M A E sub Perm 3.083275328.
PFI results showing the relative impact of each input variable on compressive strength prediction.

Figure 8. Long description
A multi-panel figure containing seven scatter plots labeled a through g. All plots share a common Y-axis representing Compressive strength in M P a, ranging from 0 to 120 in increments of 20. The X-axis for panels a through f is Value in k g per m cubed. Panel g uses Value in Days.
* Panel a, Binder content: X-axis from 300 to 700. Data shows a positive linear trend where strength increases as binder content rises.
* Panel b, Fine aggregate: X-axis from 0 to 1250. Data is concentrated between 600 and 1000, showing a dense vertical cluster around 750.
* Panel c, Coarse aggregate: X-axis from 0 to 1250. Data is widely dispersed with a high concentration between 750 and 1000.
* Panel d, Recycled aggregate: X-axis from 0 to 1600. Most data points are clustered near 0, with a sparse horizontal distribution as values increase.
* Panel e, Water: X-axis from 100 to 300. Data is concentrated between 150 and 225, showing a dense vertical band near 180.
* Panel f, Superplasticizer: X-axis from 0 to 40. Data shows a dense cluster between 0 and 10, with scattered points extending to 35.
* Panel g, Curing time: X-axis from 0 to 400. Data is organized into distinct vertical columns at specific intervals, such as 28, 90, and 365 days, showing strength gain over time.
The second most important variable was water content. Its strong influence on the model reflects the well-established importance of the water-to-binder ratio in determining porosity, workability, and ultimately strength. Especially in SCC, where high flowability is required, water content must be carefully balanced to avoid excessive bleeding and segregation, both of which can degrade mechanical properties. The model’s high sensitivity to this parameter indicates its role not just in fresh concrete behavior but also in the development of compressive strength.
Coarse aggregate content followed closely in importance. Its impact is rooted in its function as the primary load-bearing component in concrete. In the case of SCC with recycled aggregates, the variability in recycled coarse aggregate properties, such as residual mortar and water absorption, complicates predictions. Nevertheless, the model was able to account for these complexities effectively. Curing time was also recognized as a significant contributor to prediction accuracy. This is particularly notable for SCC, which incorporates recycled materials, where strength gain can be delayed or exhibit non-standard behavior due to the influence of RA on hydration kinetics and internal curing dynamics.
The content of recycled aggregate itself was found to have a moderate but meaningful influence. While high levels of recycled aggregates are generally associated with reduced strength due to weaker aggregate-matrix bonds and elevated porosity, the model’s ability to compensate for these effects through other parameters such as binder and water content suggests a nuanced interaction that traditional empirical models may fail to capture. It should also be noted that binder content, water content, and recycled aggregate content are physically interrelated rather than independent: the high water absorption of recycled aggregate modifies the effective water available for hydration, coupling its effect with both the water content and the binder demand needed to preserve the effective water-to-binder ratio. Although PFI reports the marginal influence of each variable and does not isolate such interactions explicitly, the tree-ensemble models capture them implicitly through hierarchical splitting, consistent with the models’ ability to offset high recycled aggregate content through binder and water adjustments. Fine aggregate content and superplasticizer dosage were among the least important variables. Fine aggregates, while important for rheology and particle packing, play a relatively minor role in determining the strength of hardened concrete. Superplasticizer, although vital for flowability in SCC, typically has an indirect effect on strength unless overdosed, which can lead to segregation or unexpected reductions in water content.
From an engineering perspective, these findings provide valuable insights into which mix parameters should be prioritized during SCC design involving recycled aggregates. The model not only affirms established concrete science but also reveals the complex interplay between variables, enabling data-driven optimization of sustainable concrete mixes. The apparent dominance of binder, water, and coarse aggregate content in governing strength confirms the central role of paste quality and aggregate interactions, particularly in recycled systems. The application of PFI thus provides a transparent and interpretable approach to understanding and refining ML predictions in concrete engineering.
5.2. Engineering interpretation and literature comparison
The results of this study offer several valuable engineering insights into the behavior of SCC incorporating recycled aggregates, particularly in relation to how ML models capture and interpret the underlying physical mechanisms that influence compressive strength. The superior performance of ensemble models, especially XGBoost, demonstrates that data-driven approaches can successfully model the complex, nonlinear interactions among binder content, aggregate proportions, water dosage, curing time, and admixtures. From an engineering standpoint, this is particularly significant for recycled aggregate concrete, where variability in material properties and deviations from traditional mix designs present challenges to conventional empirical or semi-empirical models.
The prominence of binder content in the feature importance analysis aligns with the long-established role of paste quality and volume in determining concrete strength, especially in SCC, where the mix must flow without segregation. This finding is consistent with those of Dinakar et al. (Reference Dinakar, Sethy and Sahoo2013) and Kou and Poon (Reference Kou and Poon2008), who observed that increasing the binder fraction can mitigate the adverse effects of using recycled aggregates by enhancing matrix density and improving the quality of the ITZ. Likewise, the strong influence of water content and curing time observed in this study supports the work of Saha and Rajasekaran (Reference Saha and Rajasekaran2016), who reported that recycled aggregates’ mixes are particularly sensitive to variations in moisture conditions and curing periods due to the porous nature and high water absorption capacity of recycled aggregates.
The model’s nuanced treatment of recycled aggregate content, where it is neither the most dominant nor negligible, reflects the balancing act between sustainability goals and structural performance. Prior studies, such as those by Jagadesh et al. (Reference Jagadesh, Juan-Valdés, Guerra-Romero, Pozo, García-González and Martínez-García2021) and Bui et al. (Reference Bui, Satomi and Takahashi2017), reported that while increased recycled aggregate content typically reduces strength, its effects can be effectively managed through proportioning and supplementary cementitious materials. The ML models in this study appeared to capture this compensatory mechanism, particularly in scenarios where high binder content and proper curing neutralized the potential strength loss due to recycled aggregates.
When comparing model performance across the literature, this study’s XGBoost model achieved an average R 2 of 0.9799 and MAE as low as 1.96 MPa, outperforming the ANN models reported by Gesoglu et al. (Reference Gesoglu, Güneyisi, Öz, Taha and Yasemin2015) and Ridho et al. (Reference Ridho, Ngamkhanong, Wu and Kaewunruen2021), which typically yielded R 2 values in the range of 0.90–0.95 with higher error margins. Moreover, unlike many previous works that focused on a narrow dataset or a single ML algorithm, this research incorporates 582 diverse mix designs sourced from over 35 independent studies. This provides robustness and generalizability, making the findings applicable across a broad spectrum of real-world SCC applications.
In addition, this study supports the growing consensus in the literature, as highlighted by de Prado-Gil et al. (Reference de-Prado-Gil, Palencia, Silva-Monteiro and Martínez-García2022) and Ekanayake et al. (Reference Ekanayake, Meddage and Rathnayake2022)—that ensemble learning techniques, particularly gradient boosting methods, offer superior accuracy and interpretability for concrete property prediction. The integration of PFI further enhances transparency, allowing engineers to understand and trust the model’s decision-making process—a critical step toward the widespread adoption of ML tools in structural material design.
6. Conclusion
This study presented a comprehensive approach for predicting the compressive strength of SCC incorporating recycled aggregates using multiple supervised ML models. A large and diverse experimental database of 582 SCC mix designs was employed, capturing a wide range of binder compositions, aggregate proportions, curing times, and admixture dosages. Seven ML models, belonging to bagging, boosting, and instance-based families, were trained and evaluated using standard performance metrics including R 2, RMSE, and MAE.
Among all models, XGBoost demonstrated the highest predictive accuracy and consistency across training, validation, and testing datasets, achieving an average R 2 of 0.9799 and MAE of just 1.97 MPa. The model not only outperformed other boosting techniques, such as CatBoost and AdaBoost, but also surpassed the performance of bagging-based models, like Extra Trees, and instance-based models, like KNN. The XGBoost model’s strength lies in its ability to capture nonlinear relationships and interactions among variables while maintaining robustness and generalizability through embedded regularization techniques.
The feature importance analysis, performed using PFI, revealed that binder content, water content, and coarse aggregate quantity were the most influential parameters affecting compressive strength predictions. This finding is consistent with established engineering knowledge, reaffirming that strength in SCC mixes is highly dependent on paste quality and aggregate packing. Curing time and recycled aggregate content also played meaningful roles, highlighting the delayed hydration characteristics and material variability associated with the use of recycled aggregates.
By integrating advanced ML with domain-specific understanding of concrete technology, this study illustrates the practical value of data-driven tools in guiding sustainable construction practices. The XGBoost model, in particular, offers a reliable framework for predicting SCC strength across a wide range of mix compositions, thereby facilitating more efficient, economical, and environmentally responsible mix design processes.
Several limitations should be acknowledged. The framework predicts compressive strength only and does not capture durability parameters, and it does not explicitly represent supplementary cementitious materials or mineral admixtures. Because the dataset is compiled from more than 35 independent studies, it carries inherent inter-study heterogeneity in materials and testing protocols; predictions are valid only within the documented range of the training data; and, as the models were evaluated using a random data partition, performance under a source-independent (grouped) validation scheme may differ. A portion of the records originates from a limited number of research groups, which may bias the models toward the mix-design conventions and testing practices of those groups and could affect generalization to mixtures produced under different conditions; source-aware validation is identified as a means of evaluating this in future work. Future work may explore the incorporation of additional input features such as mineral admixtures, curing temperature, and durability indices, the adoption of source-aware validation, or the extension of the model to forecast other mechanical and durability properties of SCC containing recycled aggregates, including multi-output prediction.
Data availability statement
The dataset supporting the findings of this study, including all input parameters and output variables required to reproduce the reported results, is publicly available in the Zenodo repository at: https://doi.org/10.5281/zenodo.18459938 (Khan et al., Reference Khan, Rasheed, Naveed and Pimanmas2026d).
Author contribution
Conceptualization: A.Q.K.; Data curation: A.Q.K., M.D.R.; Formal analysis: A.Q.K, M.H.N.; Investigation: A.Q.K., M.H.N.; Methodology: A.Q.K., M.D.R.; Project administration: M.H.N., A.P.; Resources: A.P.; Supervision: A.P.; Visualization: A.Q.K., M.D.R.; Writing – original draft: A.Q.K., M.D.R.; Writing – review & editing: M.H.N., A.P.
Funding statement
This research received no specific grant from any funding agency in the public, commercial, or not-for-profit sectors.
Competing interests
The authors have no relevant financial or non-financial interests to disclose.


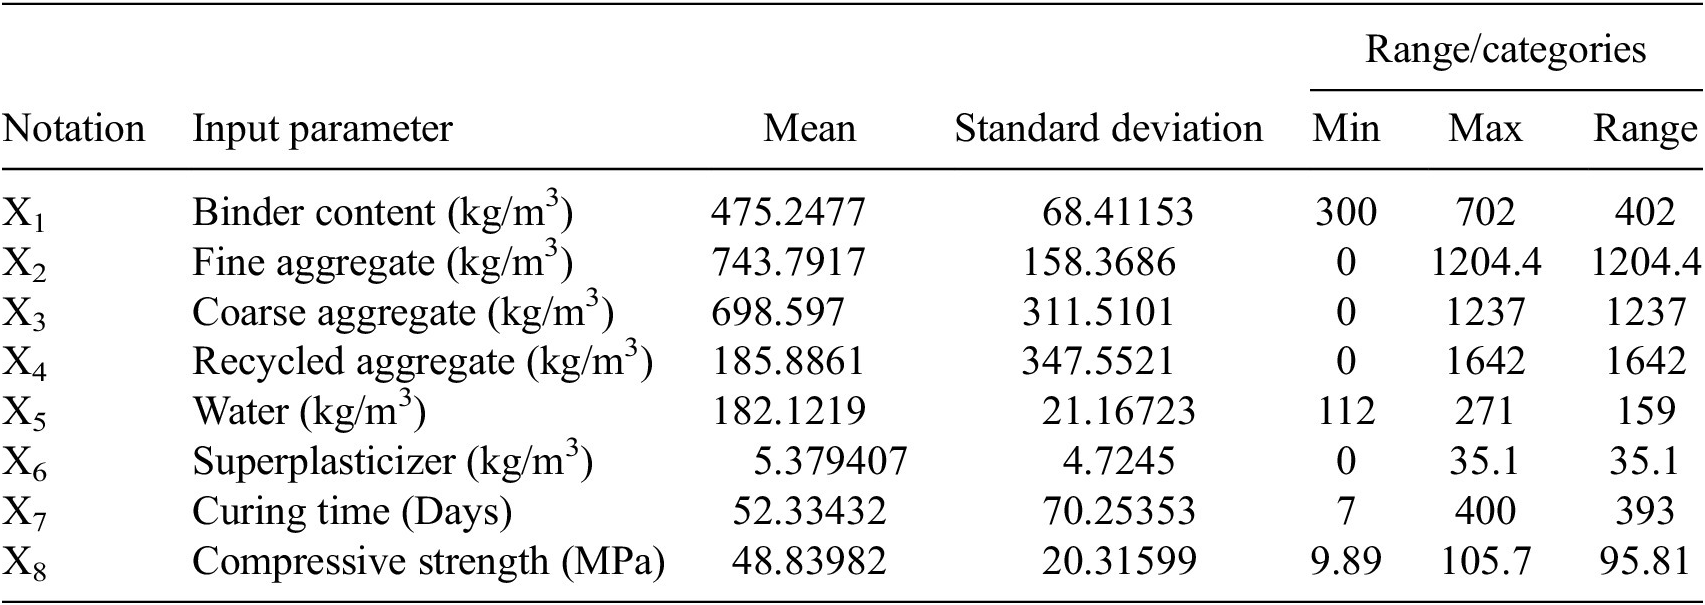
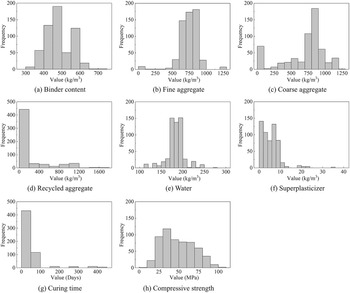
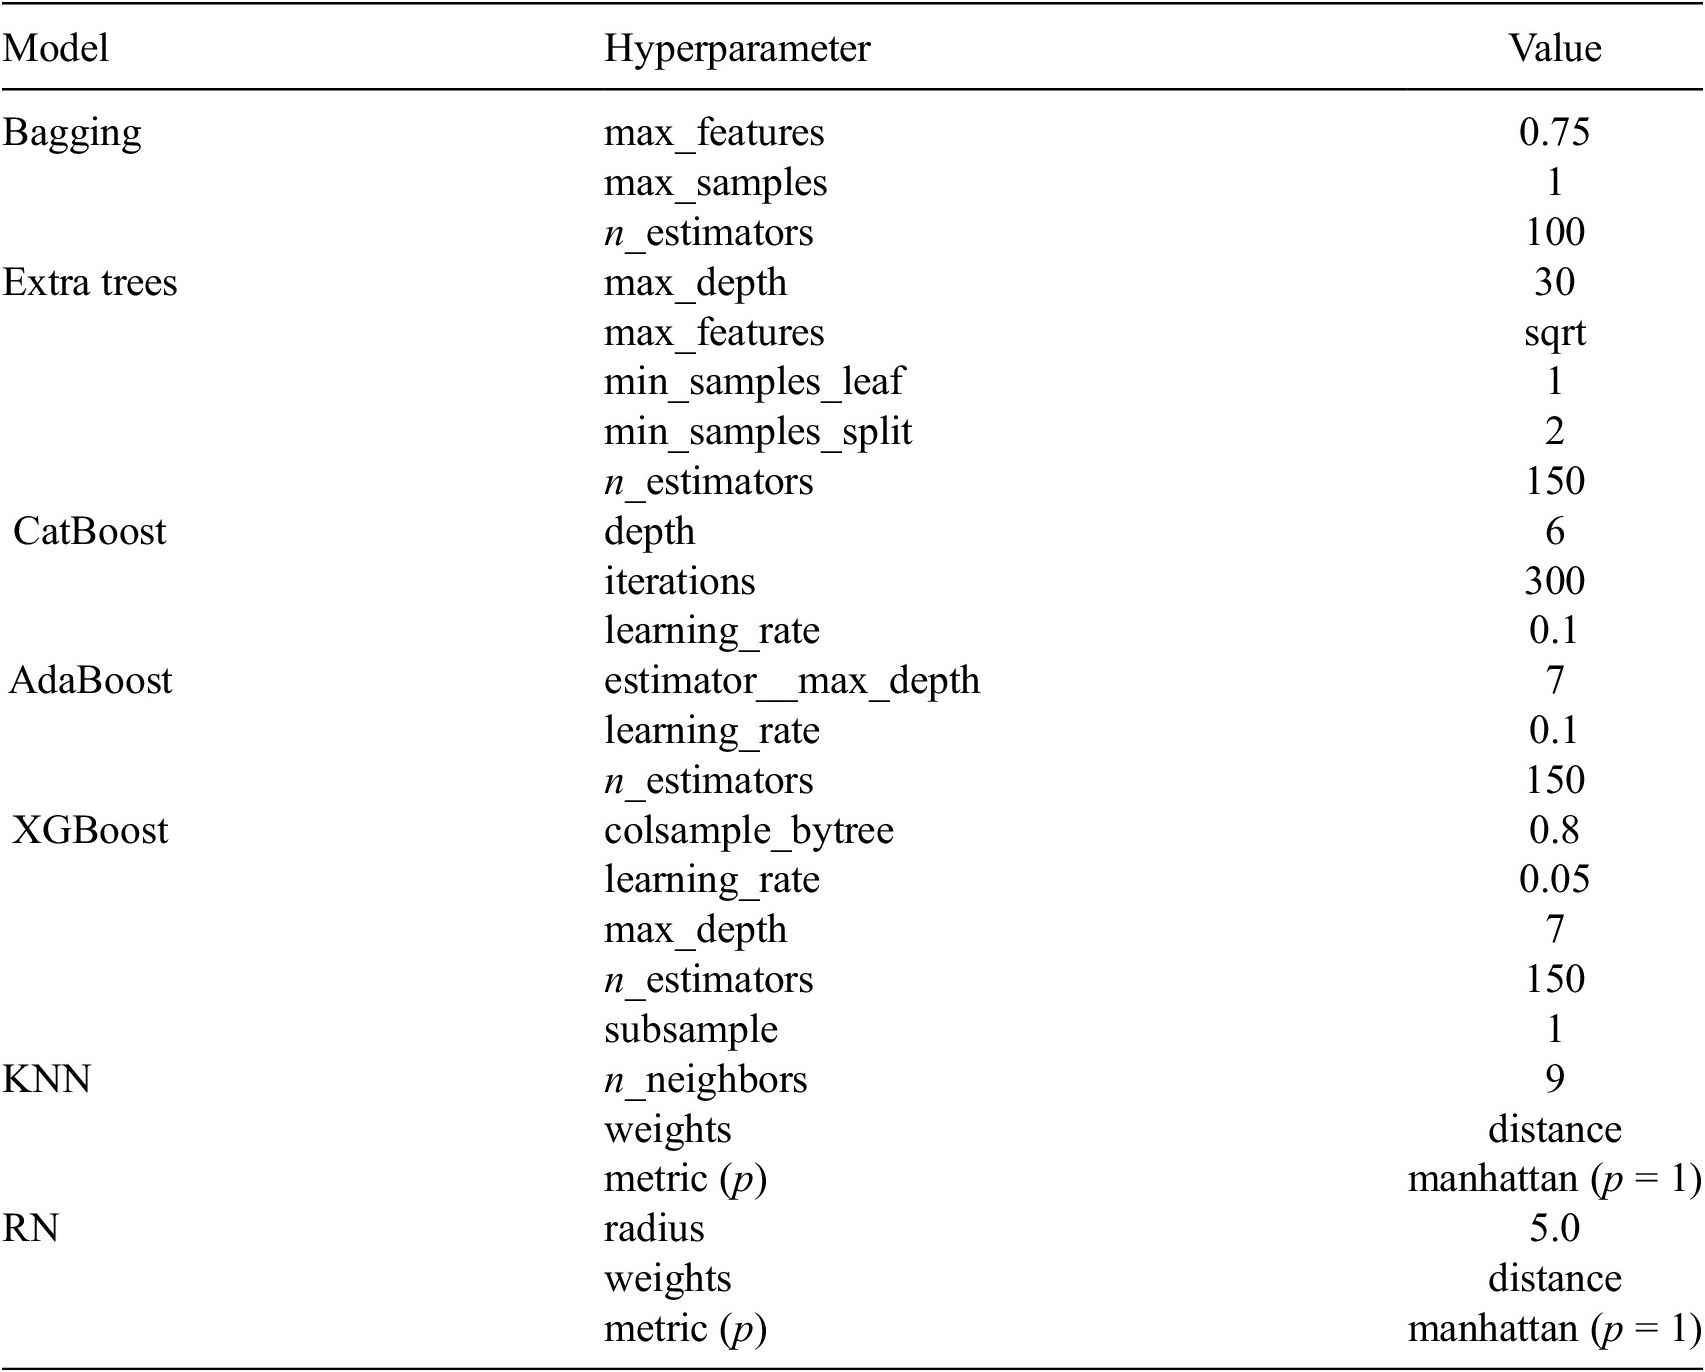


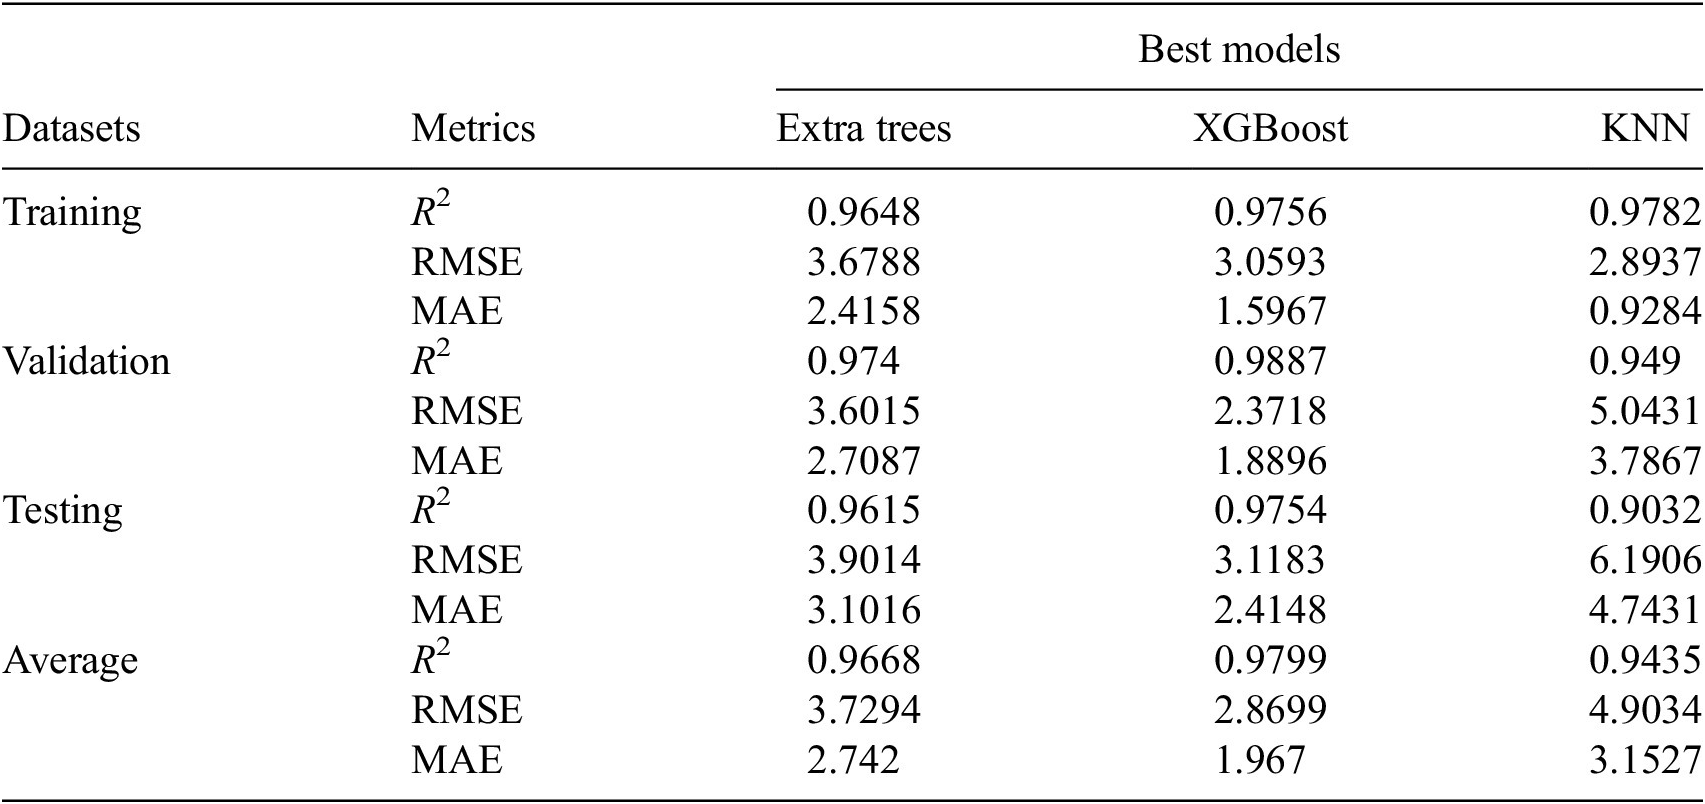

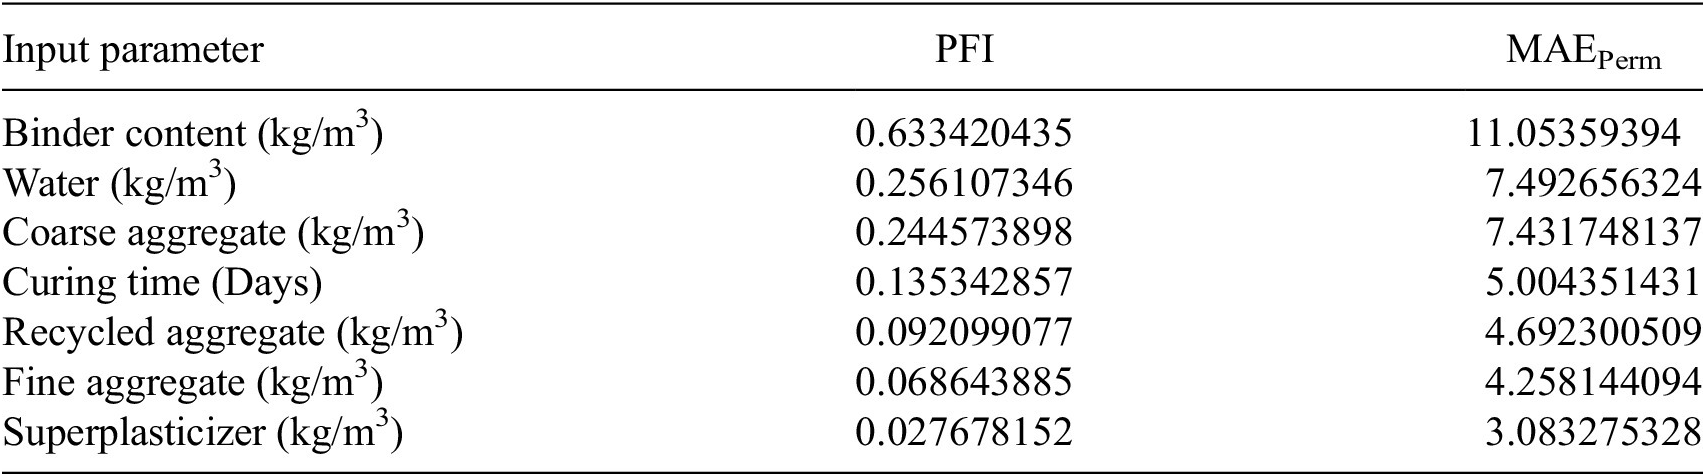


 Open access


Comments
No Comments have been published for this article.