I. INTRODUCTION
Selective laser melting (SLM) has shown to be a promising additive manufacturing (AM) technology for a wide range of metal alloys. Components with significant design freedom can in fact be produced close to their net shape leading to significant savings of raw material and energy consumption. Reference Baumers, Tuck, Wildman, Ashcroft and Hague1 In the case of Ti alloys, which have been extensively used in the aerospace industry often in the form of components with high buy-to-fly ratio, SLM represents an attractive alternative potential manufacturing process. Reference Qiu, Adkins and Attallah2 The major challenge for SLM of Ti alloys, and in particular Ti–6Al–4V, is the possibility to manufacture fully dense components with mechanical properties comparable with those of conventionally made counterparts. Reference Qiu, Adkins and Attallah2–Reference Vilaro, Colin and Bartout4
Recent studies have shown that although as-built SLM Ti–6Al–4V exhibits strength comparable or superior to HIPed cast or wrought corresponding materials, it suffers from poor ductility. Reference Qiu, Adkins and Attallah2–Reference Chlebus, Kuźnicka, Kurzynowski and Dybała5 This is due to the fact that the microstructure of the as-built SLM Ti–6Al–4V consists entirely of acicular α′ martensitic phase, that originates from the high cooling rates experienced by the deposited layers (∼104 K/s Reference Vilaro, Colin and Bartout4 ). The plastic deformation associated with this microstructure is thus confined to single α′ lath slip length as no α colonies or slip transfer between the α and β phases can occur. The superior mechanical performance of Ti–6Al–4V with α + β microstructure is well documented Reference Banerjee and Williams6,Reference Lütjering7 as the existence of β phase improves the ductility of the sample compared with the typical fully martensitic SLM Ti–6Al–4V. Reference Facchini, Magalini, Robotti, Molinari, Höges and Wissenbach3,Reference Vrancken, Thijs, Kruth and Humbeeck8 For this reason, being able to manufacture SLM Ti–6Al–4V with a controlled α + β microstructure is highly desirable and subject of current research.
The origin of the SLM Ti–6Al–4V microstructure is well understood. Reference Thijs, Verhaeghe, Craeghs, Humbeeck and Kruth9–Reference Simonelli, Tse and Tuck11 In principle, during the formation of a single layer of Ti–6Al–4V, the laser hits the pre-deposited powder bed and creates a liquid melt pool. As the melt pool cools down to room temperature, it solidifies in the β phase field. Heat is then lost vertically and columnar β grains form. Finally, the β phase transforms entirely into acicular α′ martensitic phase because of the high cooling rates which are typical of the SLM process. Recent efforts have been focused on specific post-SLM heat treatments that modify the martensitic microstructure toward equilibrium α + β phase mixtures. Reference Qiu, Adkins and Attallah2–Reference Vilaro, Colin and Bartout4,Reference Vrancken, Thijs, Kruth and Humbeeck8 Although the ductility of the heat-treated SLM Ti–6Al–4V has shown to be improved, post-processing heat treatments decrease the cost benefits associated with SLM, require dedicated furnace that operate with protective atmospheres to avoid potential contamination of the built material, and are not always possible to carry out. The typical thermal stresses built up during SLM can cause the sample to deform during the process and their interruption resulting in an unfinished part. Research on processing conditions that minimize thermal gradients during solidification of the melt pool or can anneal the deposited layers during the process is thus fundamental.
The objective of the present study was to investigate the possibility of manufacturing Ti–6Al–4V with a microstructure that comprises retained β phase directly during SLM. No studies have fact reported on the possibility to fabricate Ti–6Al–4V with an α + β microstructure using SLM or any laser powder bed system Reference Qiu, Adkins and Attallah2–Reference Vilaro, Colin and Bartout4,Reference Vrancken, Thijs, Kruth and Humbeeck8,Reference Thijs, Verhaeghe, Craeghs, Humbeeck and Kruth9 but it is the coexistence of α + β microstructure that is desirable to improve the mechanical properties of the alloy. The approach chosen in this research was that of using a set of process parameters characterized by long laser-material interaction time to reduce the thermal gradients and cooling rates experienced by the material compared with what occurs during typical SLM processing. The microstructure of SLM Ti–6Al–4V was then characterized and discussed in relation to the adopted process parameters. To the authors’ knowledge, this study is the first evidence of Ti–6Al–4V processed by SLM (or any laser powder bed system) that presents an α + β microstructure in the as-fabricated condition.
II. EXPERIMENTAL PROCEDURE
The powder material used in this study is pre alloyed Ti–6Al–4V grade 23 plasma-atomized particles supplied by LPW Technology, UK. The measured particle size distribution ranges from 15 to 75 µm, with about 75% of the distribution comprised between 25 and 50 µm. The chemical composition of the powders is reported in Table I.
Chemical composition of the powders used in this study.

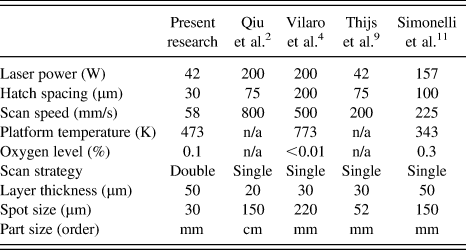
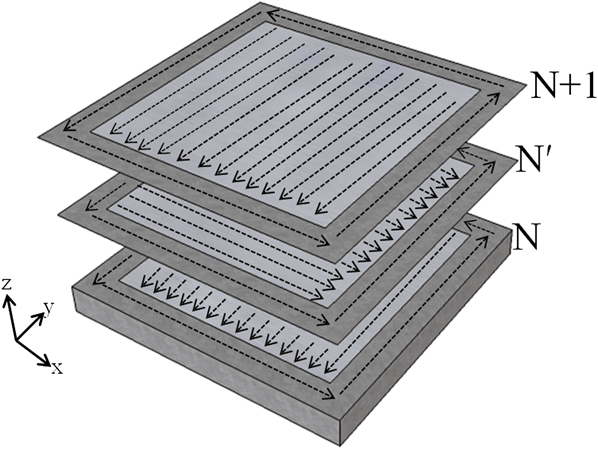
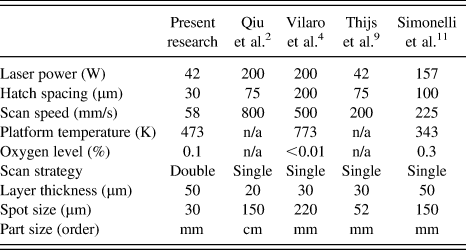
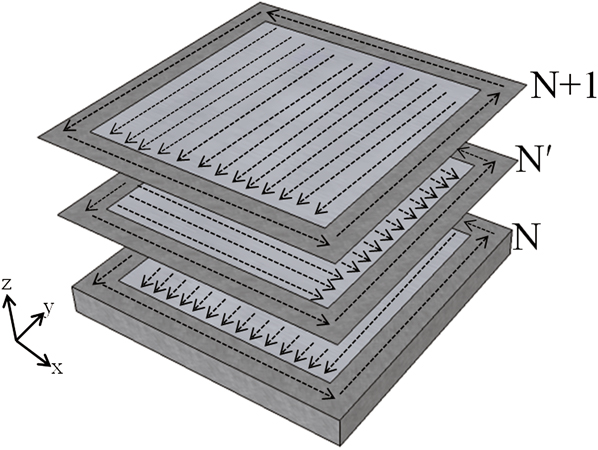
The study was conducted on four cubic samples (125 mm3) built using a SLM50 (ReaLizer GmbH, Borchen, Germany). The samples were built without interruption in a protective Ar atmosphere. The process parameters used in this study are listed in Table II. Table II also lists the typical processing conditions for SLM of Ti alloys obtained from the literature. The SLM50 is equipped with a continuous YLM-100-AC ytterbium fiber laser. In the present research, the laser was focused on the powder bed, producing a spot size (beam diameter where the intensity is higher or equal to 1/e 2 of the chosen intensity Reference Thijs, Verhaeghe, Craeghs, Humbeeck and Kruth9 ) of 30 μm. The speed of the laser was controlled specifying the point distance, i.e., the distance between two successive points in a straight line, and the exposure time, i.e., the duration of time during which the laser dwells on each point. The scan strategy used in this study is schematized in Fig. 1. In practice, each powder layer was scanned twice. The fiber laser initially scanned the edges of the square area corresponding to the cross section of the desired part. In sequence, the square powder bed was scanned with alternating scan vector parallel to the x-axis starting from the left-hand side corner of the component. The second scan of the same layer consisted of alternating vectors rotated by 90° with respect to the first scan, i.e., the scan vectors were parallel to the y-axis as illustrated in Fig. 1. During the second scan, the fiber laser scanned the designated area from the back to the front of the building chamber. The choice of this scan strategy derives from the fact that remelting of the same layer has proven to be beneficial for the density of the samples. Reference Yasa and Kruth12 The set of process parameters used in the present research differs from the typical SLM conditions reported in the literature in two main aspects: (i) it used a low laser power and low scan speed that enable a long laser-material interaction time and thus encourage the decomposition of the α′ martensitic phase; (ii) each layer was melted twice (double scan strategy) in an attempt to improve the density of the parts.
Comparison of the process parameters used in this research and those typical used for SLM of Ti–6Al–4V.
Schematic diagram of the scan strategy. Each layer (N) is scanned twice. During the remelting of the same layer (N′), the scan direction is rotated by 90°.
The leveling system in the ReaLizer SLM50 consists of a double bladed level bar. The level bar wipes the powder bed twice to improve the leveling of the layer of powder. The recoating time between successive layers was approximately 10 s. The blocks were built on teeth supports to ease their detachment from the platform once the building process was completed. The supports were generated automatically using the software Magics (Materialise, Belgium). The overall height of the supports was 3 mm, whereas the nominal thickness of the individual teeth was 0.2 mm. The build platform was kept at a temperature of 200 °C (473.15 K).
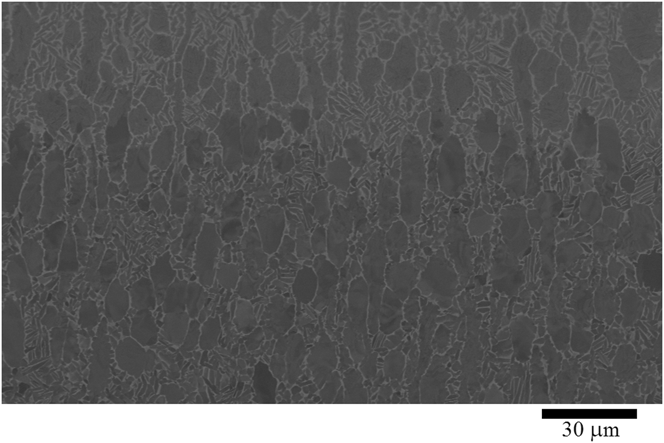
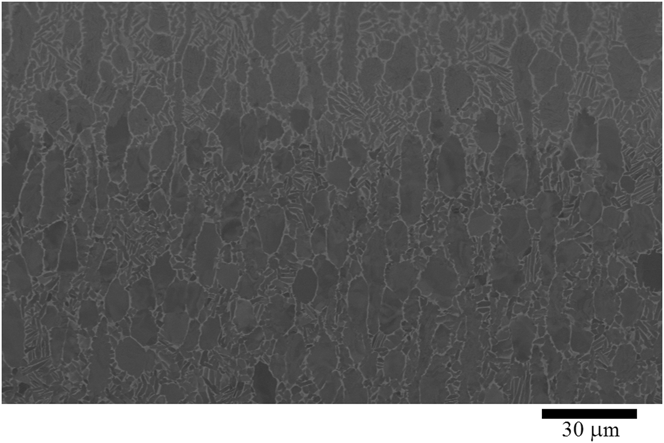
The microstructure of the samples was investigated by optical microscopy, backscatter imaging, and EBSD using a Nova 600 Nanolab Dual Beam (FEI, Hillsboro, OR) equipped with an EDAX EBSD camera. The microstructure was investigated on multiple sections of the three orthogonal xz-, yz-, and xy-planes (ASTM F2921). The density of the samples was estimated from optical micrograph analysis accounting for the percentage area fraction occupied by porosity using ImageJ. The phase composition was evaluated using EDS analysis on polished flat specimens. The chemical composition of the phases was calculated averaging 10 point EDS measurements, whereas the average area composition was evaluated on spectra collected over areas of ∼75 × 60 μm. The EDS analysis was carried out at an accelerating voltage of 10 kV to minimize the electron probe diameter, and thus the area irradiated by the electron beam, whilst maintaining enough energy to excite the characteristic elements of the material. Under these conditions, the diameter of the expected interaction volume for the element of interest (Al, Ti, V) is comprised between 1.25 ± 0.25 μm. For some fine microstructure that generates during SLM, consisting of grains of similar size than the interaction volume for the element of interest, the EDS analysis cannot provide enough spatial resolution to report absolute value of the phase chemistry composition but serves as a comparative tool to differentiate the phases present in the microstructure and assesses the presence of potential segregates. The crystallographic texture of the specimens was studied using high-resolution EBSD maps acquired with 0.1 µm step size. Inverse pole figure (IPF) orientation, phase maps, and phase volume fraction were calculated using TSL Data Collection 6 software. The grain size was measured directly on the backscatter and phase maps micrographs using ImageJ. A plate of wrought annealed Ti–6Al–4V with a standard bimodal microstructure as shown in Fig. 2 was used as the reference standard material to facilitate the microstructure discussion.
Backscatter micrograph showing the bimodal microstructure of the forged reference Ti–6Al–4V plate.
The hardness of the samples was measured using the Innovatest Nexus 4503 microhardness indenter (Innovatest Europe, Maastricht, Netherlands). Indents were generated using a constant load of 0.3 kgf (2.94 N).
III. RESULTS AND DISCUSSION
The general features of the microstructure are shown in Fig. 3. The microstructure consists of columnar prior β grain boundaries where fine grains have precipitated. The prior β grain boundaries are either aligned or inclined to the building direction while they form irregular shapes in the horizontal plane as reported in other SLM Ti–6Al–4V studies. Reference Facchini, Magalini, Robotti, Molinari, Höges and Wissenbach3,Reference Thijs, Verhaeghe, Craeghs, Humbeeck and Kruth9–Reference Simonelli, Tse and Tuck11 The density of the samples was 99.4 ± 0.2. The pores in the microstructure are spherical or elongated. The origin of porosity during SLM has been widely discussed. It is generally accepted that spherical pores originate from pre-existing defects and the evolution of any gaseous species adsorbed onto the starting powder material. Reference Qiu, Adkins and Attallah2,Reference Thijs, Verhaeghe, Craeghs, Humbeeck and Kruth9 The origin of elongated porosity is instead generally attributed to incorrect melting of the layers. Reference Qiu, Adkins and Attallah2,Reference Chlebus, Kuźnicka, Kurzynowski and Dybała5,Reference Thijs, Verhaeghe, Craeghs, Humbeeck and Kruth9,Reference Sercombe, Jones, Day and Kop10 In the present study, each layer was processed with unconventional long laser-material interaction time thus causing balling and uneven deposition that might have resulted in the observed porosity. The microstructure shows periodic macroscopic “banding” in the frontal and the lateral planes (Fig. 3). The dark bands appear in the microstructure with layer periodicity and possess a wavy shape almost parallel to the x-axis (or y-axis if the microstructure is studied in the lateral plane). These occurrences will be discussed later.
Optical micrograph showing the microstructure of samples on the frontal plane (xz-plane). The micrograph shows the typical porosity observed in the samples. Macroscopic banding is also evident in the image as dark wavy areas that cross the columnar grains.

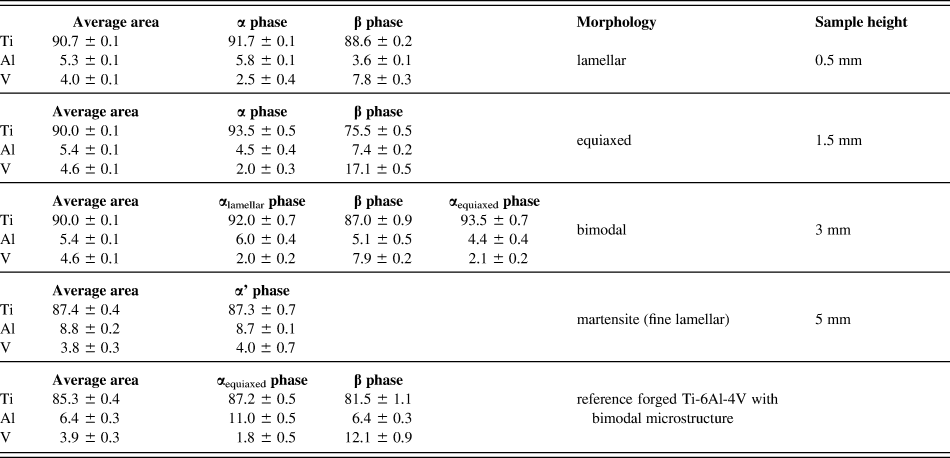
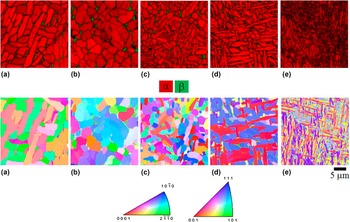
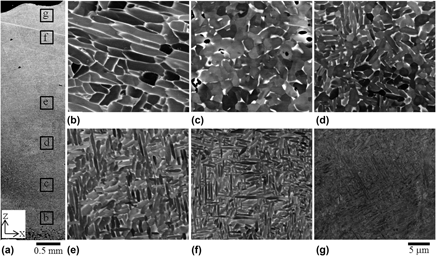
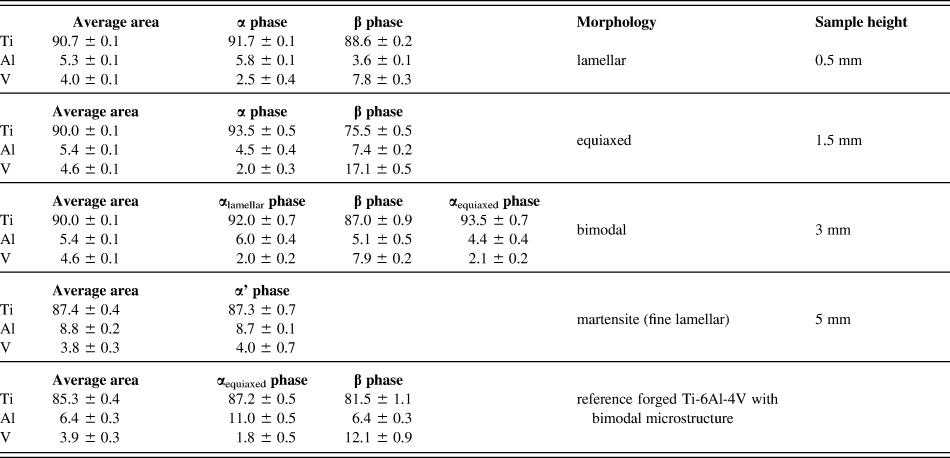
The fine grains that precipitated in the prior β grains were studied in more detail using backscatter imaging, EBSD, and EDS analysis. The backscatter analysis shows that the average grain size and morphology vary along the height of the sample (Fig. 4). The microstructure of the first few layers of the built component (up to ∼0.5 mm from the build platform) consists of relatively coarse fully lamellar α + β microstructure as confirmed by the difference in grain contrast shown in Fig. 4(b) and the EDS analysis (Table III). The average length and width of the α laths are 9.6 ± 3.1 μm and 2.3 ± 0.5 μm, respectively. The thickness of the retained β phase, surrounding the α lamellae, is 0.35 ± 0.05 μm. Figure 5(a) shows the phase map relative to this area. Previous research on SLM Ti–6Al–4V suggests that the lamellar α phase is arranged in α variants related to the retained β phase through the Burgers orientation relationship. Reference Simonelli, Tse and Tuck11 As more layers are deposited, it was observed that several regions of the sample showed a near fully equiaxed microstructure with some retained β phase at the α grain boundaries [Fig. 4(c)]. The α grain size is about 3.0 ± 0.6 μm, whereas the retained β phase thickness is 0.60 ± 0.15 μm. The phase map of the fully α equiaxed microstructure is shown in Fig. 5(b). The β phase constitutes about 5% of the microstructure, similar to that observed in Fig. 5(a). The corresponding IPF orientation map shows that several α equiaxed grains have similar crystallographic orientations. As the build height increases, the predominant microstructure morphology changes. Above ∼2 mm from the build platform, it was observed that the volume fraction of equiaxed α grains diminishes at the expense of α grains with the lamellar morphology [Figs. 4(d) and 4(e)]. The microstructure of these regions resembles the standard bimodal microstructure of Ti alloy, where the α phase possesses two distinct morphologies, equiaxed (i.e., primary α, αp) and lamellar (i.e., secondary α, αs). The change of the dominant α grain morphology is accompanied by a change in the average α grain size that, as new layers were added, becomes finer [Fig. 4(f)]. The analysis of the phase maps indicates a similar volume fraction of the β phase compared to the rest of the component.
(a) Backscatter micrograph from the xz-frontal plane of a sample showing the approximate locations where the microstructure was studied. Starting from the bottom of the sample, the microstructure is composed of α + β phases arranged with (b) fully lamellar, (c) fully equiaxed, (d), (e), and (f) bimodal morphologies; (g) the last deposited layer is instead fully martensitic.

Chemical composition (weight %) of the different microstructures observed in the SLM Ti-6Al-4V and the reference material.
Phase maps, IPF orientation maps, and corresponding color schemes showing the microstructure evolution along the building direction. (a) fully lamellar, (b) fully equiaxed, (c), (d) bimodal and (e) fully martensitic microstructures.

Eventually, martensitic acicular α′ microstructure was observed in the regions corresponding to the last processed layer (∼5 mm from the building platform) as shown in Fig. 4(g). The top martensitic layer shows a more equal distribution of the 12 variants, as indicated in IPF orientation map of Fig. 5(e).
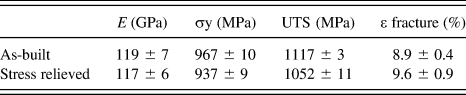
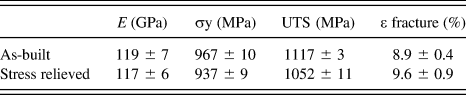
The microstructure of the samples studied in this research presents significant differences to that generally associated to as-fabricated SLM Ti–6Al–4V. Reference Qiu, Adkins and Attallah2–Reference Vilaro, Colin and Bartout4,Reference Vrancken, Thijs, Kruth and Humbeeck8,Reference Thijs, Verhaeghe, Craeghs, Humbeeck and Kruth9,Reference Simonelli, Tse and Tuck11 As-fabricated components built using a traditional and optimized set of process parameters consist of fully α′ martensitic phase [Fig. 6(a)], and thus are associated with high strength and poor ductility (Table IV). The long laser-material interaction time used in this study produces instead components with an α + β microstructure, similar to that obtained after a post annealing heat treatment of SLM Ti–6Al–4V [Fig. 6(b)] and thus a microstructure was associated with superior mechanical properties (Table IV).
Backscatter micrographs showing the microstructure of (a) as-built and (b) stress relieved SLM Ti–6Al–4V obtained under typical processing conditions reported in the literature.

Tensile properties of as-built and stress relieved SLM Ti–6Al–4V (zx-orientation).
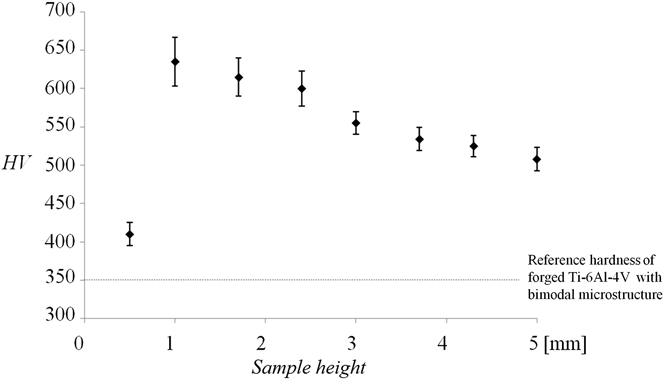
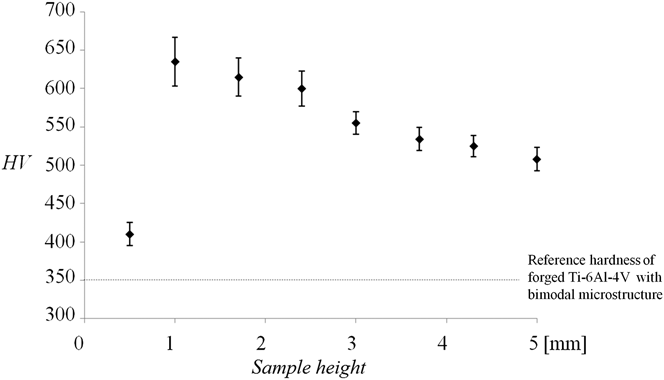
The hardness measured in correspondence with the microstructural changes is shown in Fig. 7. It should be noted that apart from the hardness measured at the bottom of the sample, the hardness decreases with the sample height. The chemical phase composition of the corresponding microstructure of the sample is reported in Table III.
Variation of the hardness with the distance from the building platform. The highest value of the hardness was measured in the fully equiaxed region of the specimens.
The results confirm anecdotal evidence that the microstructure evolution is affected by the building platform temperature, the cyclic reheating associated with the layer deposition, and the thermal stresses that develop due to the high cooling rates typical of SLM. To interpret these results, it should be considered that although the cyclic reheating induced by the laser scan of successive layers is the same at each layer deposit, the effect of the building platform temperature and the residual stresses on the microstructure vary with the build height.
The samples studied in this research present a limited thermal mass and thus as the sample height increases the influence of the building platform temperature decreases. Similar considerations are reported in electron beam melting (EBM) of Ti–6Al–4V. Reference Al-Bermani, Blackmore, Zhang and Todd13
In addition, it is generally accepted that the residual stresses that develop during SLM of metals are a function of the cooling rate and the cross-sectional area of the layer that are deposited. Reference Gibson, Rosen and Stucker14 As the samples were built on lattice supporting structures of minimal cross-sectional area, it is believed that the residual stresses were lower in the bottom of the part than in the rest of the sample.
The bottom of the workpiece (up to ∼0.5 mm from the build platform) presented a lamellar α + β microstructure. This microstructure is likely to have formed as a result of α′ → β → α + β decomposition during cyclic reheating. The temperature of the platform that was kept at 200 °C (473.15 K) is probably too low to impose cooling rates that were low enough to obtain β → α + β from a single scan, however helps to reduce the thermal gradients occurring during the process. Reference Al-Bermani, Blackmore, Zhang and Todd13 A comparison between the hardness and the phase composition of the fully lamellar microstructure and the reference Ti–6Al–4V would suggest that the α + β microstructure at the bottom of the samples derives from annealing (i.e., recovery) and decomposition of an initial martensitic microstructure. The fully lamellar microstructure is indeed harder than the reference Ti–6Al–4V and the α laths in the sample are relatively richer in V (Fig. 7 and Table III).
Similar results have been reported in a recent finite element thermo-kinetic model for laser directed energy deposition with powder of Ti–6Al–4V, where it was shown that the laser scan speed and the temperature of the building platform can influence the average temperature distribution in the work piece, the cooling rates, and thus the phase composition of the deposits. Reference Crespo and Vilar15
The fully equiaxed microstructure observed above the bottom of the sample suggests that recrystallization of α laths has taken place. It is well known that thermal stresses develop during SLM due to the typical high cooling rates involved in the layer solidification Reference Shiomi, Osakada, Nakamura, Yamashita and Abe16,Reference Mercelis and Kruth17 and thus it is likely that residual stresses caused crystal deformation in the sample. Reference Gibson, Rosen and Stucker14 It is possible that the cyclic reheating of these layers combined with the building platform temperature has caused recrystallization of the deformed lamellar microstructure and thus the generation of the equiaxed grains [Fig. 4(c)]. Indeed, there is some evidence in the literature that the reheating cycles during laser beam deposition can cause the formation of α equiaxed grains in Ti–6Al–4V samples. Reference Kobryn and Semiatin18,Reference Kobryn and Semiatin19 TEM work will be required to confirm the extent of recrystallization and the dislocation density variations in the grains of different morphology.
As more layers are added (and so the height of the sample increases), the influence of the heated platform decreases, and the extent of recrystallization decreases. The progressive refining of the microstructure as the sample height increases could be related to insufficient time for the material to transform or it could be indicative that the solidification of the melt pools occurs at higher cooling rates.
The composition of the α and β phases varied with the sample height, as shown in Table III. It can be noticed that the equiaxed α grains are characterized by a lower content of Al and V than the α laths at the bottom of the sample. The areas where microstructure has undergone recrystallization present instead a β phase richer in both the Al and V elements.
Interestingly, this analysis suggests that a significant solid-state diffusion occurs during the cyclic reheating process. As the EDS analysis excludes the existence of hard intermetallic phases in the sample, it appears that the hardness variation shown in Fig. 7 is correlated with the degree of solid-state diffusion that occurs in the sample or in other words the partitioning of the alloying elements in the two phases. Where the solid-state diffusion is maximum, i.e., in the equiaxed microstructure region where the β phase is rich in both Al and V (Table III), the hardness reaches the highest value. Conversely, the hardness diminishes as the volume fraction of the equiaxed grains in the microstructure decreases (Fig. 4).
At the top of the sample (∼5 mm from the build platform), where the deposit did not experience any cyclic heating, martensitic microstructure was observed. This shows that despite the relatively long laser-material interaction time, cooling rates higher than 410 K/s have occurred during solidification of the melt pools far from the building platform as typically reported in SLM of Ti–6Al–4V. Reference Qiu, Adkins and Attallah2–Reference Vilaro, Colin and Bartout4 The hardness of 500 HV and the composition of the martensitic microstructure are comparable with those reported in the literature. Reference Thijs, Verhaeghe, Craeghs, Humbeeck and Kruth9,Reference Murr, Quinones, Gaytan, Lopez, Rodela, Martinez, Hernandez, Martinez, Medina and Wicker20–Reference Qazi, Rahim, Fores, Senkov and Genc22
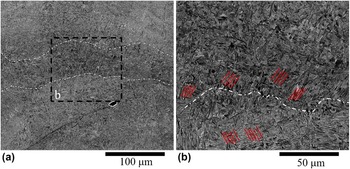
The origin of the macroscopic “banding” observed in the frontal and lateral planes of microstructure (Fig. 3) is generally attributed to the cyclic reheating of previously deposited material during each subsequent deposition. Reference Thijs, Verhaeghe, Craeghs, Humbeeck and Kruth9,Reference Kobryn and Semiatin18,Reference Kobryn and Semiatin19,Reference Kelly and Kampe23,Reference Baufeld, Brandl and Biest24 Figure 8 shows the microstructure change in correspondence to one of the observed bands. Two main differences have been observed between the band and the lower portion of material (i.e., outside the band). In the first instance, it is evident a sudden change of predominant grain alignment as indicated by the red marks in Fig. 8(b). In addition, it can be observed that the microstructures within the bands present a higher volume fraction of dark grains than the lower portion of the micrograph. Although the exact reason behind these microstructural changes is not clear, it is noteworthy that macroscopic banding is typically correlated with the use of high energy densities. Reference Thijs, Verhaeghe, Craeghs, Humbeeck and Kruth9,Reference Kobryn and Semiatin18,Reference Kobryn and Semiatin19,Reference Kelly and Kampe23,Reference Baufeld, Brandl and Biest24 Under the processing used in this experiment, reheating cycles caused the formation of a heat affected zone in the deposited material that experienced temperatures above the β transus. Upon cooling from the β phase, different α variants from those precipitated in the first deposition would explain the grain alignment change observed in Fig. 8(b). In turn, this would cause a change in contrast in the optical micrographs.
Backscatter micrograph showing (a) the microstructure in correspondence of the observed bands; (b) a higher magnification of the marked area in (a). The red lines indicate the change of the predominant α grain alignment inside and outside the band.

IV. CONCLUSIONS
In conclusion, this study has shown that for certain processing conditions it is possible to directly manufacture components with an α + β microstructure by using SLM. In particular, it was shown that the cyclic heating of the layers with the intrinsic deformation caused by the thermal stresses has led to SLM Ti–6Al–4V with a bimodal microstructure. These results are of interest because for the first time it was shown that is possible to achieve a microstructure that is not fully martensitic during the SLM of Ti–6Al–4V. These findings could lead to new research on the production of components with a more desirable microstructure with improved ductility. The samples produced under the processing window presented in this study however result a graded microstructure with residual porosity. Future work will be required to investigate the effect of combined long and short laser/material interaction times to maintain a controlled α + β microstructure and improved density.