Ecosystems have long been categorized by their function and structure (Odum Reference ODUM1953) and dominance and diversity are among the most common structural parameters measured in plant communities. The dominance of a plant species over another has been defined by having (1) more individual plants in a given sampling plot, (2) more collective biomass, or (3) greater cover (i.e. leaf area), but implicit in all definitions is a better ability to capture resources, grow and compete. Alternatively, diversity is a community-wide parameter encompassing both the raw number of species and the distribution of individual plants among them. Combining dominance and diversity together gives curves that show the distribution of abundances within a community (Whittaker Reference WHITTAKER1965, Wilson Reference WILSON1991) and explore how these two aspects of structure relate to each other, change over time, and compare between communities separated in time or space. These curves are also effective in displaying contrasting patterns of species richness, highlighting differences in evenness among assemblages, and comparing species abundance patterns across communities (Magurran Reference MAGURRAN2004). Indeed combining the dominance of particular species and the relative importance of that species within a community can suggest a ranking in competitive success and niche differentiation.
Although several studies have used dominance-diversity curves in the past, in general they (1) have not been generated using regularly sampled permanent plot data, (2) have not been used to compare recovery from different crops – for example after plantations and pastures – over time, and (3) have not been used to compare island and mainland neotropical disturbances within the same forest-type. Consequently, in this paper I take advantage of two long-term neotropical data sets to test three hypotheses using data collected from abandoned plantations and pastures in the Neotropics:
Hypothesis 1: The dominance-diversity curves of abandoned plantations (coffee, sugarcane, banana) will first have a geometric pattern, due to the lingering effect of their past crops, and then a log-normal pattern which will flatten out over time (Bazzaz Reference BAZZAZ1975, Whittaker Reference WHITTAKER1965).
Hypothesis 2: The dominance-diversity curves of abandoned pastures will show the same pattern as abandoned plantations, regardless of abandonment conditions (e.g. seeded vs. unseeded and left to regenerate naturally), but with a significant time lag due to the long-lasting superior competitive effects of the resident grasses (Aide et al. Reference AIDE, ZIMMERMAN, ROSARIO and MARCANO1996, Myster Reference MYSTER and Myster2007b).
Hypothesis 3: The patterns of hypotheses 1 and 2 will consistently occur after either plantation or pasture recovery within the same forest type, regardless of the physical location of the fields (Myster Reference MYSTER2003, Myster Reference MYSTER2007a, Reference MYSTER and Myster2007b).
The first study site was the Luquillo Experimental Forest (LUQ) of north-eastern Puerto Rico USA (18°20′N, 65°45′W; www.luq.lternet.edu). LUQ is the tropical long-term ecological research site of the National Science Foundation (LTER: Myster Reference MYSTER2003) and classified as tropical lower montane wet forest (Holdridge Reference HOLDRIDGE1967) with vegetation dominated by the tree species Dacryodes excelsa, Manilkara bidentata and Sloanea berteriana below 600 m elevation where all sampling took place (see Liogier & Martorell Reference LIOGIER and MARTORELL1982 for nomenclature). Within the LUQ, a sun coffee (Coffea arabica) plantation and five unseeded pastures were sampled. Each field and pasture receives 3–4 m y−1 of rainfall and has an average temperature of 18 °C with primarily ultisol soils that are volcaniclastic in origin (Aide et al. Reference AIDE, ZIMMERMAN, ROSARIO and MARCANO1996). The coffee plantation is located within 8 km of one of the pastures and was sampled right after abandonment in June 1997 and also in June 1998 (Myster Reference MYSTER2003). The Sabana pasture was first sampled 1 y after abandonment in 1997. The other four unseeded pastures were first sampled in 2000 when they were of different ages or years from abandonment: CoRd 990 (5 y old), Los Davilas (13 y old), CoRd 9948 (18 y old) and Puente Roto (23 y old: Myster & Malahy Reference MYSTER and MALAHY2008). Each of the five pastures have been sampled annually in May or June since first sampled. In this study all sampled data from the coffee plantation and all pasture data sampled through 2003 was used. The second study site was the Maquipucuna Reserve, Ecuador (0°05′N, 78°37′W; www.maqui.org; Myster Reference MYSTER2007a, Reference MYSTER and Myster2007b; Zahawi & Augspurger Reference ZAHAWI and AUGSPURGER1999) which is also classified as tropical lower montane wet forest (Holdridge Reference HOLDRIDGE1967) and receives between 2–5 m y−1 of rainfall. The temperature ranges between 14 °C and 25 °C, with an average temperature of 18 °C, and the reserve's fertile andisol soil is developed from volcanic ash deposits. In June 1996 six agricultural fields were abandoned and selected for study: two sugarcane (Saccharum officinarum) plantations, two banana (Musa sp.) plantations, and two pastures seeded in the exotic grass Setaria sphacelata. All six fields and pastures were 2-ha rectangles located within a few hundred metres of each other. Within each plantation and pasture at each study site, a large plot consisting of twenty-five 5 × 2-m contiguous subplots were laid out bordering primary forest (Myster Reference MYSTER2003), with the long side parallel to the border to maximize edge effects (same as temperate old-field plots reported in Myster Reference MYSTER1993). For each of the 12 large plots (six in Puerto Rico and six in Ecuador) at each sampling period (1997–2003 in Ecuador) the per cent cover of each plant species, an indicator of the ability of a species to capture light and dominate other species (Myster Reference MYSTER2003), was estimated visually as the percentage of a subplot's area covered by each species. Plots of this size have proven to be sufficient to capture plant diversity in these types of forest (Myster Reference MYSTER2003, Reference MYSTER2007a). Trained LTER taxonomists were employed in the identification of the plants for the Puerto Rican coffee plantation and pastures, and Maquipucuna plant taxonomists (trained at the University of Georgia, USA where voucher specimens are kept on file: Zahawi & Augspurger Reference ZAHAWI and AUGSPURGER1999), assisted in the identification of species in Ecuador. All data are housed in the LUQ LTER archives as LTERDATB #97, LTERDATB #100, and LTERDATB #101 (also see Myster Reference MYSTER2003, Reference MYSTER2007a, Reference MYSTER and Myster2007b; Myster & Malahy Reference MYSTER and MALAHY2008).
Data in each of the 25 subplots were pooled to tabulate a total per cent cover for each species for the entire plantation or pasture per sampling year. Those total per cent cover data were first sorted in decreasing order, then log10-transformed, and finally plotted for the first 20, most common, species (Keeley & Fotheringham Reference KEELEY and FOTHERINGHAM2003, Whittaker Reference WHITTAKER1965) to create dominance-diversity curves (Wilson Reference WILSON1991) for each of the 12 plantations and pastures, for each sampling year. Sampling data were then fitted to Preston's log-normal model, MacArthur's broken stick model, and both the geometric and the harmonic series (Keeley & Fotheringham Reference KEELEY and FOTHERINGHAM2003, Whittaker Reference WHITTAKER1965) using least-squares regression after the appropriate transformation (Keeley & Fotheringham Reference KEELEY and FOTHERINGHAM2003, Wilson Reference WILSON1991). Goodness-of-fit tests were not applied because of their inability to distinguish among different models (Magurran Reference MAGURRAN2005) and because of their unreliability at some sample sizes (Tokeshi Reference TOKESHI1993).
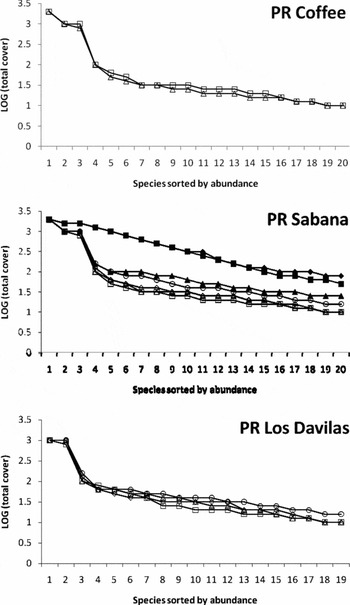
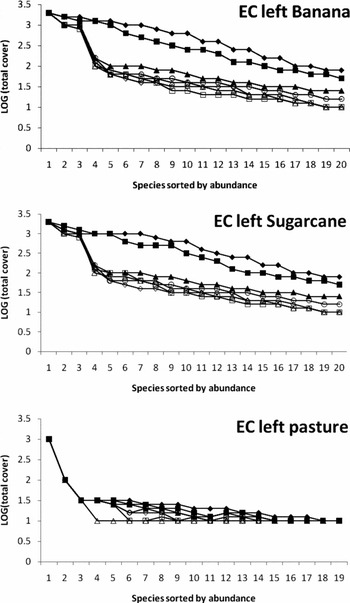
Hypothesis 1: The plots in Puerto Rico that start at year one show a significant log-normal pattern regardless if they are in a coffee plantation (P = 0.02, n = 20 for both years) or in the Sabana pasture (0.05 > P > 0.01, n = 25 for the first 5 y: Figure 1). The Sabana, CoRd990, CoRd9948, and Puente Roto pastures show this pattern flattening over time with only the Los Davilas pasture maintaining a significant log-normal pattern (0.04 > P > 0.01, n = 20: Figure 1). The plots in Ecuador plantations also show a significant log-normal pattern for the first 5 y (0.05 < P < 0.03, n = 20 for the four plantations: Figure 2) with a flattening out after that. The plots in Ecuador pasture, however, show a significant geometric pattern over the first 7 y of succession (0.03 < P < 0.001, n = 18: Figure 2).
Dominance-diversity curves for the coffee plantation, the Sabana pasture and the Los Daviles pasture in Puerto Rico. Species abundances after transformation are sorted in decreasing order each year and labelled by the year of sampling: first year a white triangle, second year a white square, third year a white diamond, fourth year a white circle, fifth year a black triangle, sixth year a black square and seventh year a black diamond.

Dominance-diversity curves for the left banana plantation, the left sugarcane plantation and the left pasture in Ecuador. Labelling is as in Figure 1.

Hypothesis 2: No lag time was seen when comparing plantations and pastures in Puerto Rico (Figure 1). However in Ecuador, pastures lag behind plantations (Figure 2) and do not resemble them within this sampling time frame.
Hypothesis 3: Between the two study sites, plantations were very similar in their patterns (Figures 1 and 2). However pastures were quite different between the two sites – log-normal in Puerto Rico and geometric in Ecuador – even though both bordered the same type of tropical forest.
Hypothesis 1 was accepted, in part, because log-normal curves were common and did flatten out with time but it was also not accepted because a geometric pattern was not seen among the plantations, expected because of the effect of the past crop (Myster Reference MYSTER and Myster2007b). As believed for disturbed tropical plant communities of high species richness, most fields showed a log-normal pattern (Whittaker Reference WHITTAKER1965) suggesting that there were a large number of factors, mechanisms, tolerances (e.g. dispersal, predation, competition: Myster Reference MYSTER and Myster2007b) or independent variables affecting the relative success of species by determining the extent of that species niche space, i.e. within these curves there are a few dominant species, a few species of low dominance, and many species of intermediate dominance. This may mean that species are not closely related in resource use or that species assemblages have a significant measure of ecological homogeneity or similarity (Sugihara Reference SUGIHARA1980). The flattening out of the curves over time shows an increasing evenness of cover distribution (Keeley & Fotheringham Reference KEELEY and FOTHERINGHAM2003), implying similar patterns of dominance and resource use (Whittaker Reference WHITTAKER1965). Results for hypothesis 2 were also mixed because there was a geometric pattern for seeded pastures but not for naturally regenerating pastures. The geometric pattern seen in the Ecuadorian pastures indicates dominance by one or a few species early in succession (here, the exotic grass Setaria sphacelata), where the fraction of resources used by these species is substantial and similar to each other, and the remaining species use a similar amount of whatever remains (the niche-pre-emption model: Whittaker Reference WHITTAKER1965). Differences among fields were most acute when comparing old fields with the Ecuadorian pastures that had been seeded in Setaria sphacelata. This is consistent with the geometric pattern being common in severe environments (Whittaker Reference WHITTAKER1965) like a pasture seeded in a very aggressive, exotic grass compared to a pasture with only native species. Finally, differences among study sites (Hypothesis 3) related mainly to the differences among pastures tested in Hypothesis 2.
Other pastures at the Ecuador study site (Zahawi & Augspurger Reference ZAHAWI and AUGSPURGER1999) showed a flattening of the curves with time, but old fields in the temperate zone showed more of a geometric pattern (Bazzaz Reference BAZZAZ1975) compared with the log-normal curve seen here, perhaps due to reduced species diversity compared with the tropics. In another montane, but subtropical, forest curves shifted from log-normal to geometric as they became more disturbed (Upadhaya et al. Reference UPADHAYA, PANDEY, LAW and TRIPATHI2003) and Amazonian forests showed a geometric pattern with a reduction of single-species dominance with an increase in flooding (Myster Reference MYSTER2007c). I conclude that while most fields showed a log-normal pattern that flattened over time, pastures in Ecuador seeded in Setaria sphacelata had a geometric pattern and so differences between abandonment conditions (seeded vs. unseeded and allowed to regenerate naturally) were more important in determining the relationship between dominance and diversity in these old fields than differences in field type (plantation vs. pasture) or in specific study site (Puerto Rico vs. Ecuador).