Implications
The multiple contributions to human well-being provided by livestock are acknowledged in science and practice. However, there is no methodology to simultaneously quantify all of these contributions or to analyse their interrelationships. We developed a framework to quantitatively assess environmental, economic, rural vitality and cultural goods and services (GS) provided by livestock. We describe four types of GS bundles that occur in France. The GS bundles provide information to stakeholders and society about the multiple benefits provided by livestock and could be a smart technology to help actors in the livestock sector better understand and manage diversified GS bundles.
Introduction
Despite being considered a major cause of global environmental issues, livestock farming is an essential activity in many rural areas (Steinfeld et al., Reference Steinfeld, Mooney, Schneider and Neville2013) because it contributes to the maintenance of soil fertility and farmland biodiversity, as well as to a set of social public goods including food security, rural vitality and culture (Franzluebbers, Reference Franzluebbers2013). With an estimated annual output value of €130 billion (at producer prices), the livestock sector in Europe accounts for 48% of total agricultural activity and creates employment for approximately 30 million people (Animal Task Force, 2013). Livestock farming also helps maintain High Nature Value farmland, which represents 30% of the agricultural area used in Europe and is crucial for the provision of ecosystem services, conservation of the cultural landscape and the attractiveness and recreational value of rural areas (Plieninger et al., Reference Plieninger, Dijks, Oteros-Rozas and Bieling2013). The multiple influences of livestock define a large set of contributions to human well-being (Lamarque et al., Reference Lamarque, Tappeiner, Turner, Steinbacher, Bardgett, Szukics, Schermer and Lavorel2011; Martín-López et al., Reference Martín-López, Iniesta-Arandia, García-Llorente, Palomo, Casado-Arzuaga, García Del Amo, Gómez-Baggethun, Oteros-Rozas, Palacios-Agundez, Willaarts, González, Santos-Martín, Onaindia, López-Santiago and Montes2012). However, many of these contributions lack market value and tend to be ignored by assessments based on economic indicators (Rodríguez-Ortega et al., Reference Rodríguez-Ortega, Oteros-Rozas, Ripoll-Bosch, Tichit, Martín-López and Bernués2014).
Although a large set of indicators and benchmarks is available for measuring and interpreting sustainability assessments of livestock farming systems (Leback et al., Reference Leback, Baret and Stilmant2013), four chief limitations remain. First, the regional level is often more appropriate than the farm level for determining the contributions of different animal sectors and the provision of different GS at a given location (Willemen et al., Reference Willemen, Hein, van Mensvoort and Verburg2010). Second, insufficient knowledge of the complete set of social contributions from livestock farming and the overly environmental focus of contributions limit the scope of livestock sustainability assessments. For instance, a recent sustainability assessment of Dutch dairy farms measured economic, social and environmental performance using 2, 3 and 20 indicators, respectively (Dolman et al., Reference Dolman, Sonneveld, Mollenhorst and de Boer2014). Third, although numerous agro-environmental indicators are available to assess the entire suite of environmental outcomes and to monitor changes (Steinfeld and Wassenaar, Reference Steinfeld and Wassenaar2007; Makowski et al., Reference Makowski, Tichit, Guichard and Van Keulen2009; Dolman et al., Reference Dolman, Sonneveld, Mollenhorst and de Boer2014; Zehetmeier et al., Reference Zehetmeier, Gandorfer, Hoffmann, Muller and de Boer2014), the emphasis placed on the different environmental outcomes is unbalanced. Fourth, some contributions are interrelated, which leads to trade-offs or synergies when two contributions appear in the same context, or when two contributions tend to reinforce each other (Sabatier et al., Reference Sabatier, Doyen and Tichit2010; Bernués et al., Reference Bernués, Ruiz, Olaizola, Villalba and Casasus2011; Sabatier et al., Reference Sabatier, Teillard, Rossing, Doyen and Tichit2015).
At present, sustainability assessments do not account for all livestock contributions at the regional level, where trade-offs and synergies among contributions can be acute (Jopke et al., Reference Jopke, Kreyling, Maes and Koellner2015). However, two concepts can help clarify these assessments. The first is ecosystem GS (Costanza et al., Reference Costanza, d’Arge, de Groot, Farber, Grasso, Hannon, Naeem, Limburg, Paruelo, O’Neill, Raskin, Sutton and van den Belt1997; Daily, Reference Daily1997), which defines all of the benefits human populations derive directly or indirectly from ecosystem functions. This concept was developed to elucidate certain hidden contributions of ecosystems and has gained momentum in recent years following the Millenium Ecosystem Assessment (MEA) (2005). Further, this concept is particularly relevant to agroecosystems that are important providers of ecosystem services (Zhang et al., Reference Zhang, Ricketts, Kremen, Carney and Swinton2007). As emphasised by Crouzat et al. (Reference Crouzat, Mouchet, Turkelboom, Byczek, Meersmans, Berger and Lavorel2015) and Thornton (Reference Thornton2010), agroecosystems provide a diversified set of economic, environmental, cultural and social GS (Lynch et al., Reference Lynch, Sumner and Martin2014). The second concept is a ‘service bundle’, defined by Raudsepp-Hearne et al. (Reference Raudsepp-Hearne, Peterson and Bennett2010) as a set of services that repeatedly occur together across time and space. According to Raudsepp-Hearne et al., a bundle reveals trade-offs or synergies among several services. Building on this definition, we develop the concept of a GS bundle to describe provisioning, environmental, rural vitality and cultural GS that are repeatedly provided together by livestock across time and space.
The objective of this study was to analyse the diversity of individual GS bundles provided by livestock in France by identifying sets of GS that were frequently provided together in French rural areas (forming GS bundle types). For this purpose, we formalised a set of indicators that described contributions that livestock provided to society and used these indicators to identify individual GS bundles at the Nomenclature of Territorial Units for Statistics (NUTS) 3 level. We combined expert knowledge with results of a literature review and defined an entire set of GS provided by livestock. We then selected indicators to quantify each GS at the departmental level (NUTS 3) in France and used correlation tests to analyse synergies or trade-offs between pairs of GS. Finally, we performed multivariate analysis to identify the types of GS bundles and concluded by developing recommendations for further exploration of GS bundles.
Material and methods
Defining goods and services categories
In our study, we defined GS as referring specifically to economic, environmental, rural vitality and cultural GS. Daily (Reference Daily1997) distinguished goods as tangible, material products resulting from processes that occur in an ecosystem, whereas services were described as improvements in the condition or location of valuable entities. This distinction is fundamental to agroecosystems because these systems promote the provision of goods over other ecosystem services and because the provision of goods results from complex interactions between ecological processes and human activity.
Thus, we adopted a broader vision than the perspective provided by the MEA (2005), which is the mainstream framework for ecosystem service analysis. First, these GS relate to both tangible outcomes and benefits to society derived from livestock farming, which is viewed as an agroecosystem providing GS (Zhang et al., Reference Zhang, Ricketts, Kremen, Carney and Swinton2007). Second, the categories suggested by the MEA (2005) did not include social aspects, such as rural vitality (i.e. maintaining social tissue in rural areas and creating agricultural and supply chain employment), which is highly relevant to our topic. Thus, the concept of Social Environmental Economic GS developed by Lynch et al. (Reference Lynch, Sumner and Martin2014) was better adapted to focus on four categories of GS provided by livestock: provisioning, environmental, cultural and rural vitality. The first three categories correspond to ecosystem GS as currently defined in international classifications of ecosystem services (MEA, 2005; Haines-Young and Potschin, Reference Haines-Young and Potschin2013). Provisioning GS are material and nutritional outputs from livestock farming. Environmental GS include benefits such as biodiversity maintenance, climate regulation and water purification. Cultural GS are recreational, aesthetic and heritage benefits provided by livestock farming. Rural vitality GS account for the contribution of livestock farming to maintaining a rural network and creating employment in the livestock sector (e.g. farms, supply chain).
Indicator selection
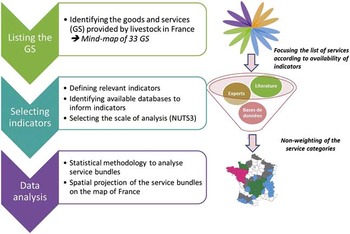
The general methodology is presented in Figure 1. We first performed a literature review to inventory the entire suite of GS provided by livestock and constructed a detailed mind-map of livestock GS using a discourse-based assessment (Ryschawy et al., Reference Ryschawy, Tichit, Bertrand, Allaire, Aubert, Aznar, Guinot, Josien, Lasseur, Plantureux, Tchakérian and Disenhaus2015). The 13 authors of the present study include experts from academia, agricultural advisory services and members of the livestock supply chain (ruminant and monogastric sectors). Hence, a diverse knowledge base was represented that included livestock production, agroecology, sociology and economics, which supported the comprehensive review of livestock sector GS. The final list of 33 GS was organised as a mind-map (Supplementary Material S1). To validate this list, we discussed it with external experts: two researchers specialised in pig and poultry production (lacking in the group of experts), two managers of supply chains and 12 dairy and beef farmers during a focus group. This ensured that important GS were not overlooked by the 13 experts.
General methodological framework developed to assess goods and services (GS) provided by livestock in France. NUTS=Nomenclature of Territorial Units for Statistics.

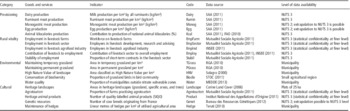
For each of the 33 GS included in the mind-map, the experts identified relevant evaluation criteria and a list of potential indicators. We chose to give all four GS categories the same priority, deciding that we had no objective reason to rank their importance. We considered GS diversity in all categories and limited the tendency to assign additional weight to the economic and environmental GS that had more supporting data. Thus, we selected an equal number of indicators (i.e. five) within each of the four GS categories. To confirm each indicator, we considered (i) the availability of data through a systematic screening of national databases, (ii) the highest spatial resolution to evaluate the indicator using existing data and (iii) the existence of threshold levels for interpreting indicator values. Due to this analysis and the lack of data to inform rural vitality and cultural categories at finer scale, we decided to inform all indicators at the NUTS 3 level. The NUTS 3 level, which corresponds to the 95 French metropolitan departments, was the smallest common denominator for all selected indicators. Indicators available at lower levels (e.g. municipality, small agricultural region) were aggregated at the NUTS 3 level. The final GS considered and the indicators selected for the quantitative analysis are provided in Table 1.
Indicators selected from national databases to quantify livestock goods and services on a nation-wide gradient

SAA=Annual Agricultural Statistics (Statistique Agricole Annuelle); NUTS=Nomenclature of Territorial Units for Statistics; RGA=General Agricultural Counting (Recensement Général de l’Agriculture); STOC=Temporal counting of Common Birds (Suivi Temporel des Oiseaux Communs); FAO = Food and Alimentation Organisation; MEDDE = Ministry of Ecology, Sustainable Development and Energy (Ministère de l'Ecologie, du Developpement Durable et de l'Energie); INSEE = National Institute for Statistics and Economic studies (Institut National des Statistiques et des Etudes Economiques); SIQO = Official Identification labels for Quality and Origin (Signes Officiels de la Qualité et de l'Origine).
A final data set (‘data set D’) was obtained for all 20 indicators and was used to evaluate the indicators at the NUTS 3 level. To consider only NUTS 3 in which the provision of GS could be unambiguously attributed to livestock, we calculated the coefficient of livestock specialisation. The coefficient of livestock specialisation was calculated as the proportion of total NUTS 3 farms that were livestock farms. Approximately two-thirds of the NUTS 3 units (60 of 95) with a coefficient of livestock specialisation above 0.5 were selected. We assumed that above this threshold, livestock were important enough in the NUTS 3 unit that they influenced links between GS and aspects such as land cover or water quality. The NUTS 3 units that were excluded corresponded to French regions in which livestock numbers had drastically decreased since the 1950s (Ryschawy et al., Reference Ryschawy, Choisis, Choisis and Gibon2013). All livestock farms in the remaining 60 selected NUTS 3 units were considered.
Statistical analysis
We analysed correlations between GS indicators in two steps. We first calculated correlations between GS pairs and then identified GS bundle types (multiple interactions) and their geographic distributions. We considered a GS bundle as a collection of GS that occurred together in time and space (Raudsepp-Hearne et al., Reference Raudsepp-Hearne, Peterson and Bennett2010), and each GS was defined by a level of provision. Thus, bundles were groups of GS that tended to be provided together at the same place and at the same time. All statistical analysis have been performed with R software (R Development Core Team 2011).
Standardisation of data
We performed z-score standardisation of the 20 indicators in data set D to express all indicators in the same unit. During z-score standardisation, values for a given variable A are normalised based on the values’ means and standard deviations. Compared with min–max normalisation, z-score standardisation can address the larger standard deviations that occur when outliers dominate the range of values (Mohamad and Usman, Reference Mohamad and Usman2013).
Pairwise correlations between goods and services
Before analysing the GS bundles, we conducted pairwise tests to determine if certain GS were correlated. The purpose of the correlation analysis was to identify negative or positive correlations between individual GS. We tested all pairwise correlations among the GS in data set D (i.e. 190 correlations) using the Holm–Bonferroni method to limit errors of multiple comparisons for a large table. We chose α=0.05, which led a correlation to be considered significant at P⩽2.6e−4 (i.e. α/190).
Bundle typology and geographic distribution
To build a typology of individual NUTS 3 GS bundles, we applied a previously existing method developed and tested for major ecosystem service assessments (Raudsepp-Hearne et al., Reference Raudsepp-Hearne, Peterson and Bennett2010). This method allowed us to simultaneously consider the entire set of GS, made up of the GS provided by livestock in each NUTS 3. We thus focused on multiple interactions between GS and not only on pairwise interactions. To build the typology, we grouped individual NUTS 3 GS bundles together based on their similarities. The method had two main steps: principal component analysis (PCA) of the GS indicators, followed by hierarchical ascendant clustering (HAC) using the scores of individual NUTS 3 GS on the PCA axes. The PCA was performed on the standardised data set D. We used the Kaiser criterion to select four factors with eigenvalues >1 and then performed the HAC using the squared Euclidean distance and Ward’s aggregation method on the PCA coordinates of the four factors. These four factors were selected to classify the 60 NUTS 3 units according to similarities in their livestock GS (i.e. types of GS bundles). To interpret the GS bundle types obtained, we analysed the PCA factors, taking into consideration all contributions of the main variables (in particular GS categories) to explaining variability along the PCA axes. We considered the relative importance of the GS levels of each NUTS 3 in a given bundle type compared with those in the other GS bundle types. To confirm the significance of differences between GS levels in each bundle types, we performed ANOVA with one factor, that is the GS bundle type for all GS considered.
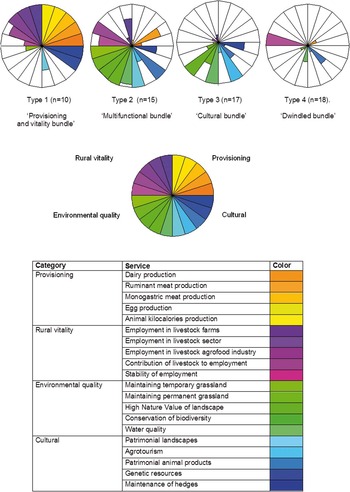
Bundle composition was graphically represented using the stars function (‘graphics’ package in R software), with 20 sectors corresponding to the entire GS suite. To build the graphics, we performed min–max normalisation of the mean indicator value of each GS between 0 and 1 for each type (with 1 being the maximum value between types and 0 being the minimum value). At the end of the process, we projected the GS bundles on a NUTS 3 level map of France to identify their geographic distributions in French rural areas.
Results
Correlations among goods and services
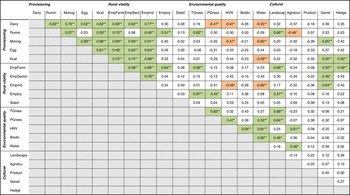
Of the 190 possible correlations among the paired GS, 62 significant correlations were identified, including 53 positive correlations and 9 negative correlations (Table 2). Within a given category, provisioning GS exhibited the strongest correlations, and 9 of the 10 correlations tested were significant. Environmental GS were also highly correlated, and 6 of the 10 correlations tested were significant. Cultural GS were not mutually correlated. Between GS categories, there were many positive correlations between provisioning GS and rural vitality GS (15/25). Significant, but small negative, correlations primarily occurred between environmental and provisioning GS (6/25), and between environmental and rural vitality GS (2/25). Cultural GS were weakly but significantly correlated with provisioning, environmental and rural vitality GS.
Correlation coefficients (ƿ) between pairs of livestock goods and services considering French Nomenclature of Territorial Units for Statistics 3 as individuals

Provisioning: Dairy=dairy production; Rumin=ruminant meat production; Monog=monogastric meat production; Egg=egg production; Kcal=animal kilocalories production; Rural vitality: EmpFarm=employment in livestock farms; EmpSector=employment in livestock sector; EmpInd=employment in livestock agrofood industry; Employ=contribution of livestock to employment; Stabil=stability of employment; Environmental quality: Tgrass=maintaining temporary grassland; Pgrass=maintaining permanent grassland; HNV=High Nature Value of landscape; Biodiv=conservation of biodiversity; Water=water quality; Cultural: Landscape=heritage landscapes; Agrotour=agrotourism; Product=heritage animal products; Genet=genetic resources; Hedge=maintenance of hedges.
n=60.
*P<0.05; **P<0.01; P-values are adjusted using the Holm–Bonferroni method, considering the error of multiple comparisons in large tables.
Green shading indicates strong positive correlations (P=0.50 to 0.69); dark green indicates very strong positive correlations (P⩾0.70; inspired by Plieninger et al., Reference Plieninger, Dijks, Oteros-Rozas and Bieling2013); red shading indicates strong negative correlations (P=−0.50 to 0.69); dark red indicates very strong negative correlations (P⩽−0.70).
Typology of goods and services bundles
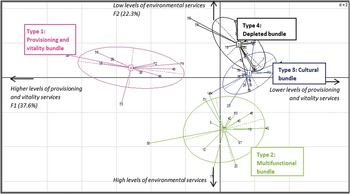
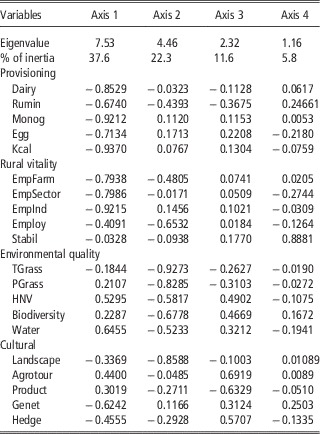
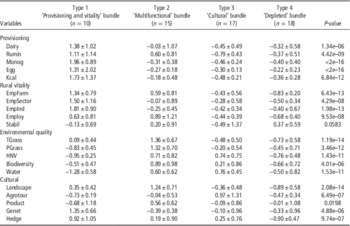
The PCA explained 77.3% of the variance of the first four axes (eigenvalue>1; Table 3). Axis 1, which explained 37.6% of the variance, corresponded to an opposition between low levels of provisioning and rural vitality GS v. a high level of environmental GS. Axis 2, which explained 22.3% of the variance, corresponded to ruminant meat production associated with high environmental GS and employment on its negative section. Axis 3, which explained 11.6% of the variability, corresponded to a mix of cultural GS related to diversified landscapes and areas of High Nature Value. Axis 4, which explained 5.8% of the variability, was mainly defined by employment stability within the sector. Hierarchical ascendant clustering identified four major GS bundle types, which had contrasting levels of GS provision. Figure 2 shows the projection of the four types of bundles on the PCA factorial map. The mean value of each GS per bundle type (Table 4) served as the basis for interpreting bundle types.
Projection of service bundle types in the F1 and F2 principal component analysis factorial map. Each point represents individual Nomenclature of Territorial Units for Statistics (NUTS) 3 bundles of goods and services projected on the F1 and F2 factorial maps and is coloured by the type of bundle.

Contribution of individual livestock goods and services considered in the composition of the four first principal component axes (eigenvalues>1)

Provisioning: Dairy=dairy production; Rumin=ruminant meat production; Monog=monogastric meat production; Egg=egg production; Kcal=animal kilocalories production; Rural vitality: EmpFarm=employment in livestock farms; EmpSector=employment in livestock sector; EmpInd=employment in livestock agrofood industry; Employ=contribution of livestock to employment; Stabil=stability of employment; Environmental quality: Tgrass=maintaining temporary grassland; Pgrass=maintaining permanent grassland; HNV=High Nature Value of landscape; Biodiv=conservation of biodiversity; Water=water quality; Cultural: Landscape=heritage landscapes; Agrotour=agrotourism; Product=heritage animal products; Genet=genetic resources; Hedge=maintenance of hedges.
Mean and standard deviation of individual livestock goods and services (GS) considered according to the GS bundle type

Provisioning: Dairy=dairy production; Rumin=ruminant meat production; Monog=monogastric meat production; Egg=egg production; Kcal=animal kilocalories production; Rural vitality: EmpFarm=employment in livestock farms; EmpSector=employment in livestock sector; EmpInd=employment in livestock agrofood industry; Employ=contribution of livestock to employment; Stabil=stability of employment; Environmental quality: Tgrass=maintaining temporary grassland; Pgrass=maintaining permanent grassland; HNV=High Nature Value of landscape; Biodiv=conservation of biodiversity; Water=water quality; Cultural: Landscape=heritage landscapes; Agrotour=agrotourism; Product=heritage animal products; Genet=genetic resources; Hedge=maintenance of hedges.
In each column, values are calculated based on the standardised z-score used to perform the statistical analyses.
The P-value corresponds to results of the ANOVA of the GS in each type of GS bundle.
We designated Type 1 as the ‘provisioning and vitality’ bundle, which was strongly related to high levels of food provisioning and rural vitality GS but inversely related to environmental GS. We designated Type 2 as the ‘multifunctional’ bundle, which represented provision of diverse GS (i.e. all GS in the bundle had approximately the same level). High levels of environmental GS were associated with the maintenance of grasslands and High Nature Value areas through grassland-based ruminant production. In addition, some cultural GS appeared to be associated with Type 2 as heritage landscapes and quality-labelled products. The multifunctional bundle also included an important contribution of the livestock sector to local employment. We designated Type 3 as the ‘Cultural’ bundle, which was associated with cultural GS and some environmental GS. Our results indicated that water quality and High Nature Value areas were associated with high levels of agrotourism, whereas the level of food provisioning GS was lower than those in other types. We designated Type 4 as the ‘Depleted’ bundle, which provided all GS at lower levels than those in other types. The Figure 3 is detailing the four GS bundle types, occurring in France.
Average starplots corresponding to the mean provision of each good and service in each of the four bundles of goods and services. Each sector of the diagram corresponds to the mean value of each indicator of good or service relative to the mean value of the indicator in other types (0 is the minimum and 1 the maximum).

Geographic distribution of bundles
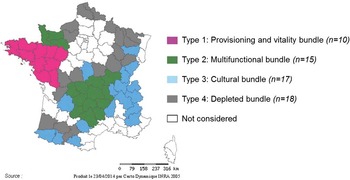
The spatial distribution of the GS bundles revealed a non-random distribution of bundle types (Figure 4). Bundle Type 1 was located in north-western departments (NUTS 3 units), where monogastric and dairy animals have high density levels. Bundle Type 2 was located in NUTS 3 units within an increased share of permanent grasslands and High Nature Value areas, such as mountainous areas or plains. Bundle Type 3 was primarily in mountainous and unfavourable pedo-climatic areas. Bundle Type 4 dominated transition areas where livestock farming had declined steeply over the last 30 years, including areas where livestock farming might no longer be viable.
Location of the four livestock goods and services bundle types in France at the Nomenclature of Territorial Units for Statistics 3 level. Types 1, 2, 3 and 4 correspond to ‘provisioning and vitality’, ‘multifunctional’, ‘cultural’ and ‘depleted’ bundles, respectively.

Discussion
Goods and services bundle evaluation is limited by a lack of relevant indicators in national databases
Defining quantitative indicators limits consideration of social aspects
This study attempted to list and use GS indicators within available national databases and to develop indicators for which databases were not available. Study findings indicated that particular categories, such as cultural GS and rural vitality GS, merit further investigation and development of new indicators. Due to the lack of indicators explicitly linking livestock and rural vitality, we focussed heavily on contributions of livestock farming to direct employment, although indirect employment, local networking, social networking and social life could be additional benefits. For instance, farmers and supply chain employees could rate quality of life on a scale from 0 to 5; this kind of indicator could be included easily at large scales, such as from the European Union Farm Accountancy Data Network. Inclusion of quantitative indicators of rural vitality, such as the added value created by livestock in an area, would have been of interest, but due to confidentiality, these data were not available at the NUTS 3 level except for farmers. Indirect employment also could be evaluated through detailed accounting, but it is difficult to link employment explicitly to livestock. For instance, a restaurant cooking meat from a specific area is linked not only to livestock but perhaps to tourism in the area and the skills of the cook. Beudou et al. (Reference Beudou, Martin and Ryschawy2017) developed an exploratory method based on semi-directive interviews of local stakeholders to consider rural vitality and cultural GS in two areas. This method allowed them to establish a clear link between livestock and GS provided in an area, according to the stakeholders’ statements. Hence, further development is required because in most multi-criteria analyses, social aspects are not as well-defined as other aspects. Thus, a qualitative approach is needed to accurately consider this dimension (Martín-López et al., Reference Martín-López, Iniesta-Arandia, García-Llorente, Palomo, Casado-Arzuaga, García Del Amo, Gómez-Baggethun, Oteros-Rozas, Palacios-Agundez, Willaarts, González, Santos-Martín, Onaindia, López-Santiago and Montes2012; Rodríguez-Ortega et al., Reference Rodríguez-Ortega, Oteros-Rozas, Ripoll-Bosch, Tichit, Martín-López and Bernués2014).
A finer scale is needed for further analysis
We identified potential hotspots for future analysis of diversified GS bundles, Our analysis was limited to the NUTS 3 level on a nation-wide gradient because of the low availability of indicators to evaluate the four GS categories. Indicators that could be regarded as easy to define and compute, such as food provisioning GS, were problematic due to limited information at intra-regional levels. For instance, production of weaned calves that are exported from France to Spain or Italy is not included in annual statistics, which focus primarily on slaughtered meat. However, for departments (NUTS 3) that rely heavily on export of weaned calves, omitting this component would underestimate the food provisioning GS greatly. Second, the NUTS 3 analytical resolution is relatively coarse, which hides geographic and socio-economic heterogeneities of French agriculture, in particular livestock systems. Analysis at a higher resolution would be needed to identify heterogeneity in the spatial distribution of agricultural intensity within NUTS 3 units (Teillard et al., Reference Teillard, Allaire, Cahuzac, Leger, Maigne and Tichit2012), which could be important to GS bundle composition. Finally, we excluded 35 NUTS 3 units in France because they did not have enough livestock to consider that GS were linked to livestock. This methodological choice is due to our indicators, which were expressed in terms of square kilometre of the department (NUTS 3) and thus limited the utility of considering livestock influence if it was marginal. Still, in some regions, a grassland surrounded by annual crops may be more important than a grassland surrounded by other grasslands. Thus, location (e.g. on a slope, near a river) can influence environmental GS, but it was not possible to highlight this using national databases, especially those lacking spatially explicit data. Finally, it would be necessary to consider all agroecosystems, not only livestock production systems, to assess all French NUTS 3 units in a relevant manner. This will be done in the French Evaluation of Ecosystems and Ecosystem Services expert assessment, led by INRA at the request of the French Ministries of Agriculture and Ecology.
Stakeholder input to improve bundle management
Trade-offs among GS may occur due to different social demands among stakeholders, such as divergent interests, motivations, experiences and knowledge of farming systems. Goods and services trade-offs arising from management choices of stakeholders could be analysed using socio-cultural and economic valuation techniques (de Groot et al., Reference de Groot, Alkemade, Braat, Hein and Willemen2010; Martín-López et al., Reference Martín-López, Iniesta-Arandia, García-Llorente, Palomo, Casado-Arzuaga, García Del Amo, Gómez-Baggethun, Oteros-Rozas, Palacios-Agundez, Willaarts, González, Santos-Martín, Onaindia, López-Santiago and Montes2012). Specific methods, such as focus groups, could help to explain perceptions of local stakeholders who are considered the beneficiaries of GS. The initial list of GS developed by the experts could serve as a basis for developing bundles of locally adapted indicators. Our study was a compromise that defined a methodological framework for future applications. Still, GS could be prioritised by incorporating stakeholders’ knowledge, motivations and experience (Rodríguez-Ortega et al., Reference Rodríguez-Ortega, Oteros-Rozas, Ripoll-Bosch, Tichit, Martín-López and Bernués2014). Studying local stakeholder expectations could thus provide useful information about how to manage multiple services, which would satisfy both local stakeholders and society. Most biophysical approaches for assessing ecosystem services fail to produce output variables that can be connected to human benefit in a straightforward manner. The conceptual framework of service economics could be of interest as it connects GS indicators to human benefits by assuming an effective relationship between a service provider or contractor and a beneficiary (Gadrey, Reference Gadrey2012). The approach provided here could help define local policies if public perception of GS could be included, as stakeholders’ expectations for cultural and rural vitality GS could act as a mechanism to reconfigure livestock farming (Beudou et al., Reference Beudou, Martin and Ryschawy2017).
Goods and services bundles as a tool for decision makers
Correlations among GS categories
Our analysis revealed that environmental and cultural GS were negatively correlated with food provisioning GS, which was consistent with several literature reviews and previous assessments (Bennett et al., Reference Bennett, Peterson and Gordon2009; Raudsepp-Hearne et al., Reference Raudsepp-Hearne, Peterson and Bennett2010; Rodríguez-Ortega et al., Reference Rodríguez-Ortega, Oteros-Rozas, Ripoll-Bosch, Tichit, Martín-López and Bernués2014). A novel aspect of our study was the rural vitality category, which was strongly correlated with food provisioning GS and could be linked to agglomeration economies in areas where the livestock sector is concentrated. One key question is to what extent these correlations reflected interactions between GS. Although correlations were detected, some may not reveal true synergies/trade-offs between GS if they are random correlations with no real link or if a common economic and soil–climate context influences their provision (Bennett et al., Reference Bennett, Peterson and Gordon2009).
Goods and services bundles are located in specific regions according to local contexts
Our study revealed the diversity in livestock GS bundles and their non-random geographic distribution in France. Perrot et al. (Reference Perrot, Béguin, Morhain and Tchakérian2005) previously identified the diversity of ruminant production in France, which agreed with results of our analysis. In regions of high animal density, livestock systems yield more food but often negatively impact the environment due to animal concentration (Peyraud et al., Reference Peyraud, Taboada and Delaby2014). The ‘provisioning and vitality’ bundle observed in north-western France is in line with the concept of agglomeration economies (Chatellier et Gaigné, 2012), in that the high density of animal production in a single area facilitates ever-increasing animal numbers and increased rural vitality in the livestock sector. However, production limits in the area could be linked to the high animal density, which increases provisioning GS but decreases levels of environmental GS to the point that they could be interpreted as dis-services, for instance, to water quality (Zhang et al., Reference Zhang, Ricketts, Kremen, Carney and Swinton2007).
The ‘multifunctional’ bundle is linked to grass-based systems that are known to provide environmental GS (Martín-López et al., Reference Martín-López, Iniesta-Arandia, García-Llorente, Palomo, Casado-Arzuaga, García Del Amo, Gómez-Baggethun, Oteros-Rozas, Palacios-Agundez, Willaarts, González, Santos-Martín, Onaindia, López-Santiago and Montes2012; Rodríguez-Ortega et al., Reference Rodríguez-Ortega, Oteros-Rozas, Ripoll-Bosch, Tichit, Martín-López and Bernués2014). For instance, High Nature Value farmland jointly provides ecosystem services, conservation of cultural landscapes, and attractiveness and recreational value of rural areas (Plieninger et al., Reference Plieninger, Dijks, Oteros-Rozas and Bieling2013). In French NUTS 3 units with grass-based ruminant production and relatively low animal densities, high levels of environmental GS were expected. In addition, these NUTS 3 units had lower provisioning than the NUTS 3 units included in the GS bundle type ‘provisioning and vitality’. In mountainous areas, ruminant production is grassland-based due to natural constraints, and quality-labelled products support provision of cultural GS. However, the ‘depleted’ bundle was linked to the downward trend in livestock numbers rather than to livestock that were poor producers of GS.
Understanding dynamics of livestock systems is needed to manage goods and services provision
Long-term dynamics of evolution of livestock systems needs to be considered to understand evolution of the provision of GS bundles in rural areas. Further, social and economic factors are related to the trends in livestock systems (Perrot et al., Reference Perrot, Béguin, Morhain and Tchakérian2005). Each NUTS 3 unit included in the current analysis had its own local geographic, social, and economic context, which could be related to the provision of multiple GS. The spatial distribution of bundle types suggests that there are common factors in the context that modify dynamics of farming and socio-economic environments (Bennett et al., Reference Bennett, Peterson and Gordon2009). For instance, socio-demographic evolution could influence rural vitality in terms of both agricultural employment and the influx of new rural inhabitants. Pretty et al. (Reference Pretty, Noble, Bossio, Dixon, Hine, de Vries and Morison2006) concluded that specific types of agriculture could improve multiple ecosystem GS simultaneously. They identified multiple landscape services that commonly appeared together as well as conditions under which this occurs; however, they did not explain underlying factors. In particular, certain management practices could change relationships among GS and create opportunities to enhance multiple GS simultaneously (Egoh et al., Reference Egoh, Reyers, Rouget, Richardson, Le Maitre and Van Jaarsveld2008). Some of these factors change over time (e.g. agricultural policies, supply chains and markets), whereas others determine the production potential of the land linked to pedo-climatic conditions (Perrot et al., Reference Perrot, Béguin, Morhain and Tchakérian2005).
Conclusions
We report significant correlations between multiple GS provided by livestock farming in France. The four major bundle types were associated with different levels of provision and relationships among the GS. Our analysis revealed that environmental and cultural GS are negatively correlated with GS related to food provision. Our study considered a new category of social GS: rural vitality, which was strongly correlated with food provision GS. Another finding was the non-random spatial distribution of the GS bundles provided by livestock, which suggests that GS bundles appear in specific contexts, an observation that deserves further research.
Results of this study provide an initial screening method for informing stakeholders and society about multiple benefits provided by livestock. This can be a smart technology to help stakeholders in the livestock sector understand and manage diversified GS bundles. This approach merits further testing in a range of rural settings and could potentially be used to locate GS hotspots, identify areas for improvement and monitor changes in GS over time. However, the methodological framework will require adaptation for use by livestock stakeholders in different regions. Future developments may facilitate dialogue among regional stakeholders, which could help identify solutions for regional issues. Likewise, the assessment process could draw attention to positive contributions of livestock to society. Finally, the approach highlights areas of progress for some GS categories beyond food and other products leaving the farm.
Acknowledgements
The authors thank the Elevages Demain scientific interest group (GIS Elevages Demain) for initiating and funding this study. The authors also acknowledge the INRA US Observatoire du Développement Rural (ODR) for its contribution to indicator selection and database development.
Supplementary material
To view supplementary material for this article, please visit https://doi.org/10.1017/S1751731117000829