

1. Introduction
1.1 Abu Tbeirah and the return to fieldwork in Sumer
In fieldwork terms, Southern Mesopotamian archaeology has been disrupted for over two decades, largely bound to old excavation data and based on outdated analyses. The progress of the discipline has been intermittent, with frequent halts, mainly due to political factors. The present revival of fieldwork and research within the modern Iraqi Republic (in particular in its safe southernmost part) offers an invaluable opportunity to address the gaps in our understanding and for the acquisition of new data, at macro and micro scales, using modern interdisciplinary approaches to research and analysis.
The first new excavation of a Sumerian site began in 2011 at Abu Tbeirah (hereafter AbT), a site of c. 43 ha, located near the modern city of NasiriyahFootnote 2 and probably influenced by the nearby ancient city of Ur. Although Abu Tbeirah is now located in an arid region, in the 3rd millennium b.c. the site was surrounded by marshes and connected to other city-states through the ancient water canal that crossed the site.Footnote 3 AbT has a life-span from the Early Dynastic (ED) until the end of the Ur III period, while the phases brought to light during the first five campaigns (2011–2015) are dated to the ED-Akk transition.Footnote 4 For the past five years, the AbT team has applied modern interdisciplinary methodologies in order to reconstruct the life of the inhabitants of Sumer during a period that is among the most important in Mesopotamian history but is also cryptic and obscure.
Among the new lines of research carried out by the AbT team, the functional interpretation of space and spatial analysis hold important roles in reconstructing the identity of Sumer's inhabitants from their choices, life-style and material culture.
1.2 Micro-debris and formation processes
The expression “micro-debris analysis”Footnote 5 refers to the study of any human-related material residue of very small size, yet visible to the unaided eye,Footnote 6 found within archaeological deposits and occupation surfaces. These small human by-products have proven to be particularly useful for the identification of activity areas and for the characterization of space use.
Traditionally, the functional interpretation of built spaces has been based exclusively on the spatial patterning of those macroscopic artefacts found in direct association (in situ) with a living surface. But archaeological artefacts do not incontrovertibly represent the remains of primary activities, as was already recognized by M. B. Schiffer in the 1970s, with his distinction between systemic and archaeological contexts.Footnote 7 Indeed, the record examined by archaeologists (the archaeological context) is only an altered, transformed version of the original dynamics between societies and material objects (the systemic context). The factors involved in these transformations are known as formation processes: they can be both cultural, where the agency is human behaviour, and natural, where agencies stem from the natural environment.Footnote 8 These processes create, over time, material compositions and arrangements that do not reflect the behaviours of the past.Footnote 9 Therefore, the occurrence of in situ artefacts: 1) might not be related to the activities carried out in a given context (e.g. possible secondary depositions); 2) could represent the very last use of a structure, not reflecting any of the daily activitiesFootnote 10 carried out during its lifespan; and 3) might not reflect the location where the artefacts were actually used.Footnote 11
On the other hand, “because of their size, the transportation and deposition of microartifacts is controlled by physical processes that differ from their larger analogues”,Footnote 12 and this is why micro-residues represent a helpful means to overcome the previously mentioned interpretive limits. Their small size means that: a) they do not constitute an obstacle or hazard to people;Footnote 13 b) they easily escape cleaning operations;Footnote 14 and c) through human and/or animal trampling they are embedded within both sandy and fine-grained surfaces.Footnote 15 For all these reasons, small residues are less subject to removal than artefacts and discarded materials that are larger in size. Given their higher preservation potential and better chances of being found in, or close to, the location where they were produced, used or deposited,Footnote 16 micro-debris is key evidence for detecting what Schiffer calls “de facto refuse”.Footnote 17
The concentration and distribution of micro-residues can, therefore, reveal arrangements that reflect spatially persistent activities that took place over the lifetime of a structureFootnote 18 and allow us to discern long-term patterns in the use of spaces. Since social identities are defined, created and emphasized through meaningful actions,Footnote 19 daily routines become the mechanism by which people embody the rules of their community - their habitus.Footnote 20 Hence, daily practices become social practices and thus the residues left by those practices can be highly informative regarding political, social, economic and ritual decisions taken by people in the past.Footnote 21
1.3 Micro-debris analysis: some applications and issues
After the above-mentioned recognition of formation processes and their importance for archaeological studies, geoarchaeologists began to advocate for the application of micro-archaeological techniques for the recovery of significant, but usually overlooked, information.Footnote 22 An important input into the development of micro-debris analysis dates to the early 1980s, with the experimental studies of Fladmark on micro-debitage.Footnote 23 Although focussing exclusively on lithic debris, this was the first study aimed at a better understanding of site formation processes and activity areas from the spatial distribution of microscopic residues.
Since then, several studies have followed,Footnote 24 and particularly noteworthy is the research conducted by A.M. Rosen at numerous Levantine sites.Footnote 25 In addition to tackling the geoarchaeological study of tells (their nature, formation and erosion), she assessed the use of distinct areas by calculating relative proportions of different classes of micro-debris and by using different combinations of residues to define specific activities.Footnote 26
Evolving out of these studies, a series of research projects focused on Near Eastern contexts were carried out in the last fifteen years, in connection with a growing interest in the investigation of householdsFootnote 27 and of the way activities carried out in areas inhabited by the smallest social groups can inform us about broader social, political and economic processes. In these latter studies, micro-residue analyses have often been integrated with other high-resolution techniques, such as chemical analyses, and considerable attention has been paid to intra-room variability of activities.Footnote 28
The major criticism of this technique is that in multi-layered and complex sites, the presence of micro-residues might not be linked to the activities performed on a determined living surface but could instead be “background noise”, or contamination caused by the reuse of anthropogenic deposits for the construction of new occupation levels.Footnote 29 The premise according to which micro-residues directly represent the result of human activities needs, therefore, to be rigorously investigated and criticized on a site-by-site basis, rather than simply assumed.Footnote 30 A further concern regarding this technique is that its implementation, especially in extensive excavations, may prohibitively increase the costs, time and effort in both field- and lab work.Footnote 31 Tackling this view, a recent study aimed at showing how, with proper methodology, the possible drawbacks of this technique can be overcome, greatly strengthening archaeological interpretations.Footnote 32
In conclusion, and using the words of Dunnel and Stein: “The point is not that microartifacts are better or worse in some absolute sense than macroartifacts in terms of their transportation histories. They are transported differently, by different agents of different competencies. Because of these differences, they supply unique information on archaeological deposits. The distribution of microartifacts may frequently supply information crucial to interpret the distribution of macroartifacts, and vice versa”.Footnote 33
2. Abu Tbeirahʼs Building A
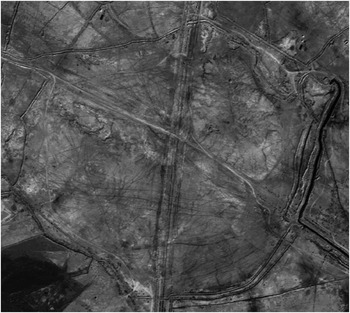
The excavation of Area 1 at AbT began in 2012 (Fig. 1).Footnote 34 The area was chosen on the basis of satellite imagery showing, under the salt crust of the tell, a huge building, apparently organized around two big courtyards.Footnote 35
Abu Tbeirah. Satellite image.

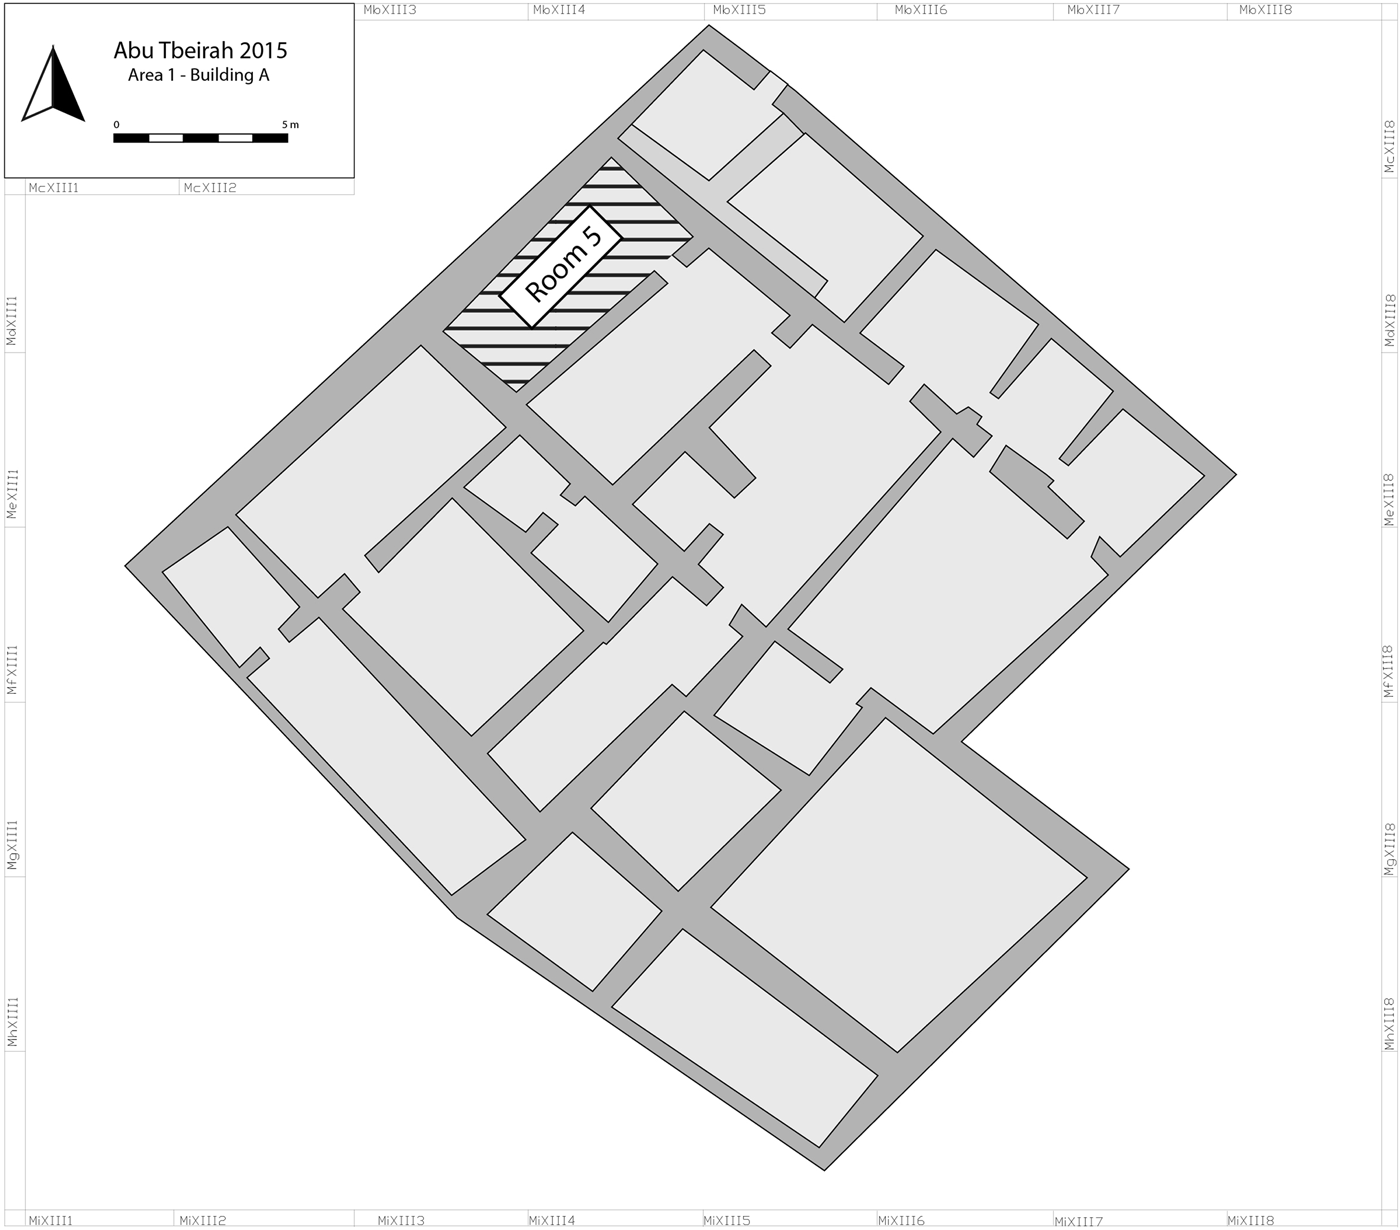
The excavation confirmed the presence of a mud-brick structure, cut by later graves belonging to the last phase of occupation of the site. The 2015 excavation campaign outlined the complete plan of the first phase of the building, unexpectedly revealing that one of the supposed courtyards did not exist (Fig. 2). Indeed, recent anthropic activities, probably a military camp, led to an initial misinterpretation of the plan visible from the satellite imagery; the area of the supposed courtyard is instead divided into a series of small rooms. So far, the building covers an area of more than 600 square metres, with a total of twenty closed spaces including rooms and open courts. The building can be dated on the basis of pottery to the so-called ED-Akk transition, a period that is still obscure in Southern Mesopotamia.Footnote 36
Abu Tbeirah. Area 1. Plan of Building A.

For the last phase of Building A (Phase 1), only one line of mud-bricks was preserved, though heavily eroded; less than 30 cm of soil separated the upper part of the wall from the superficial salt crust. The dimensions of the dark yellowish-brown mud-bricks seem to have been 30/35 cm × 15/17 cm, although the measurements are not precise due to the poor state of preservation of the bricks themselves. The walls were erected over pre-existing structures, using a stratum of clay to level and stabilize the bases of the new walls.
Below Phase 1, Phase 2 of the building has been only partially excavated. The organization of the structure seems to be consistent between the two phases, at least for the portion already excavated, although some modifications in the access system have been noted. Furthermore, the construction technique is the same: irregularly shaped mud-bricks of c. 30 × 15 × 15 cm (the dimensions of the mud-bricks were, however, variable in the same wall), joined with mud mortar. While the dividing walls were built with mud-bricks set as stretchers, the outer load-bearing walls in both phases are built with headers and stretchers.
The building shows evidence of abandonment in its last phase (Phase 1), while the older phase (Phase 2) was probably leveled off and rebuilt through raising new walls and laying a new floor. The construction technique and the findings of both phases of occupation of the building show exceptional resemblances to the buildings and material culture of the Southern Iraqi marshland and of the Marsh Arabs, the Madaʼin.Footnote 37
2.1 Room 5
2.1.1 Phase 1
Room 5 (Fig. 3) is located at the north-west side of the building (McXIII3 + 4), in the outermost row of rooms of the building. Phase 1 was probably exposed for a long period to water erosion or was heavily damaged by a gully created by rainfall. On the floor (USFootnote 38 188), alabaster and limestone vesselsFootnote 39 were discovered in pieces spread all over the room. Under the floor, a grave of a child of c. six years old was discovered (Grave 14), completely filled with pure clay. The grave equipment consisted of a jar, two beakers and two conical bowls. Remains of a reed-mat were discovered near the body.Footnote 40
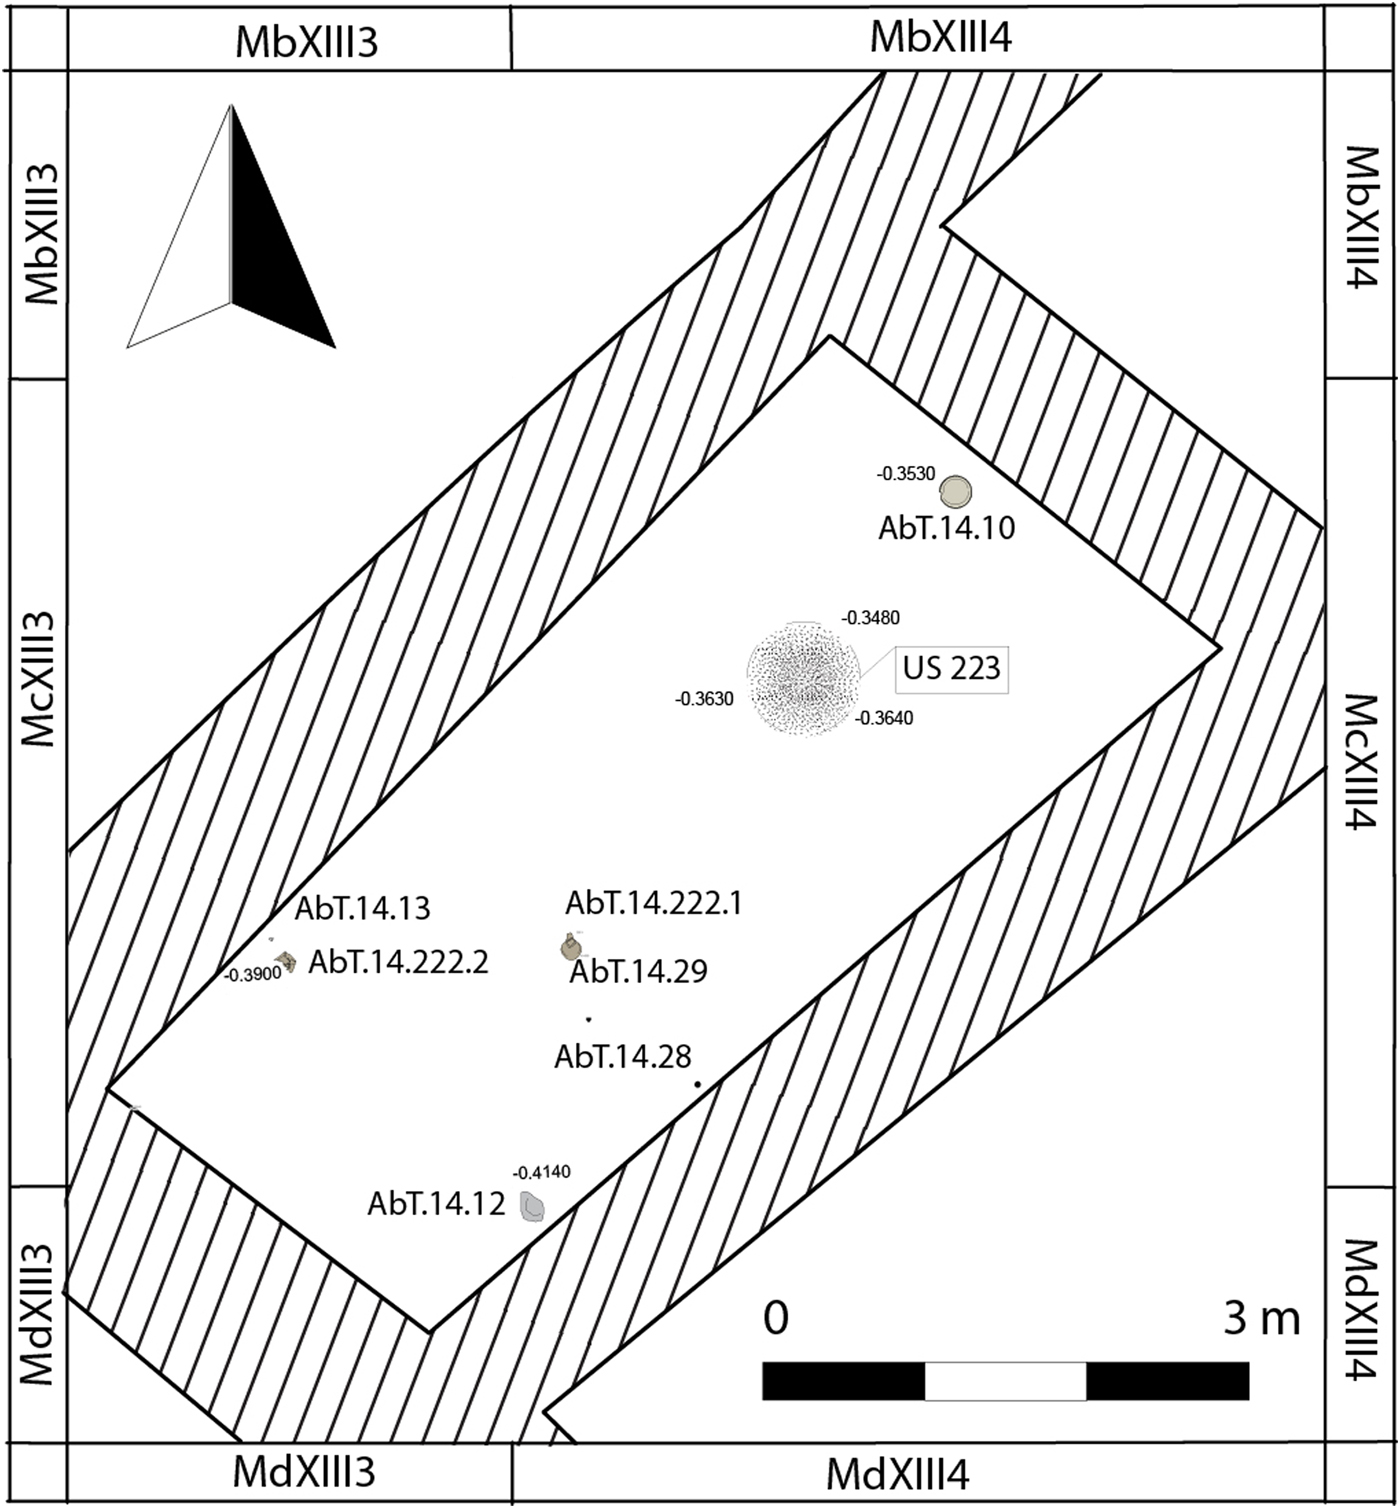
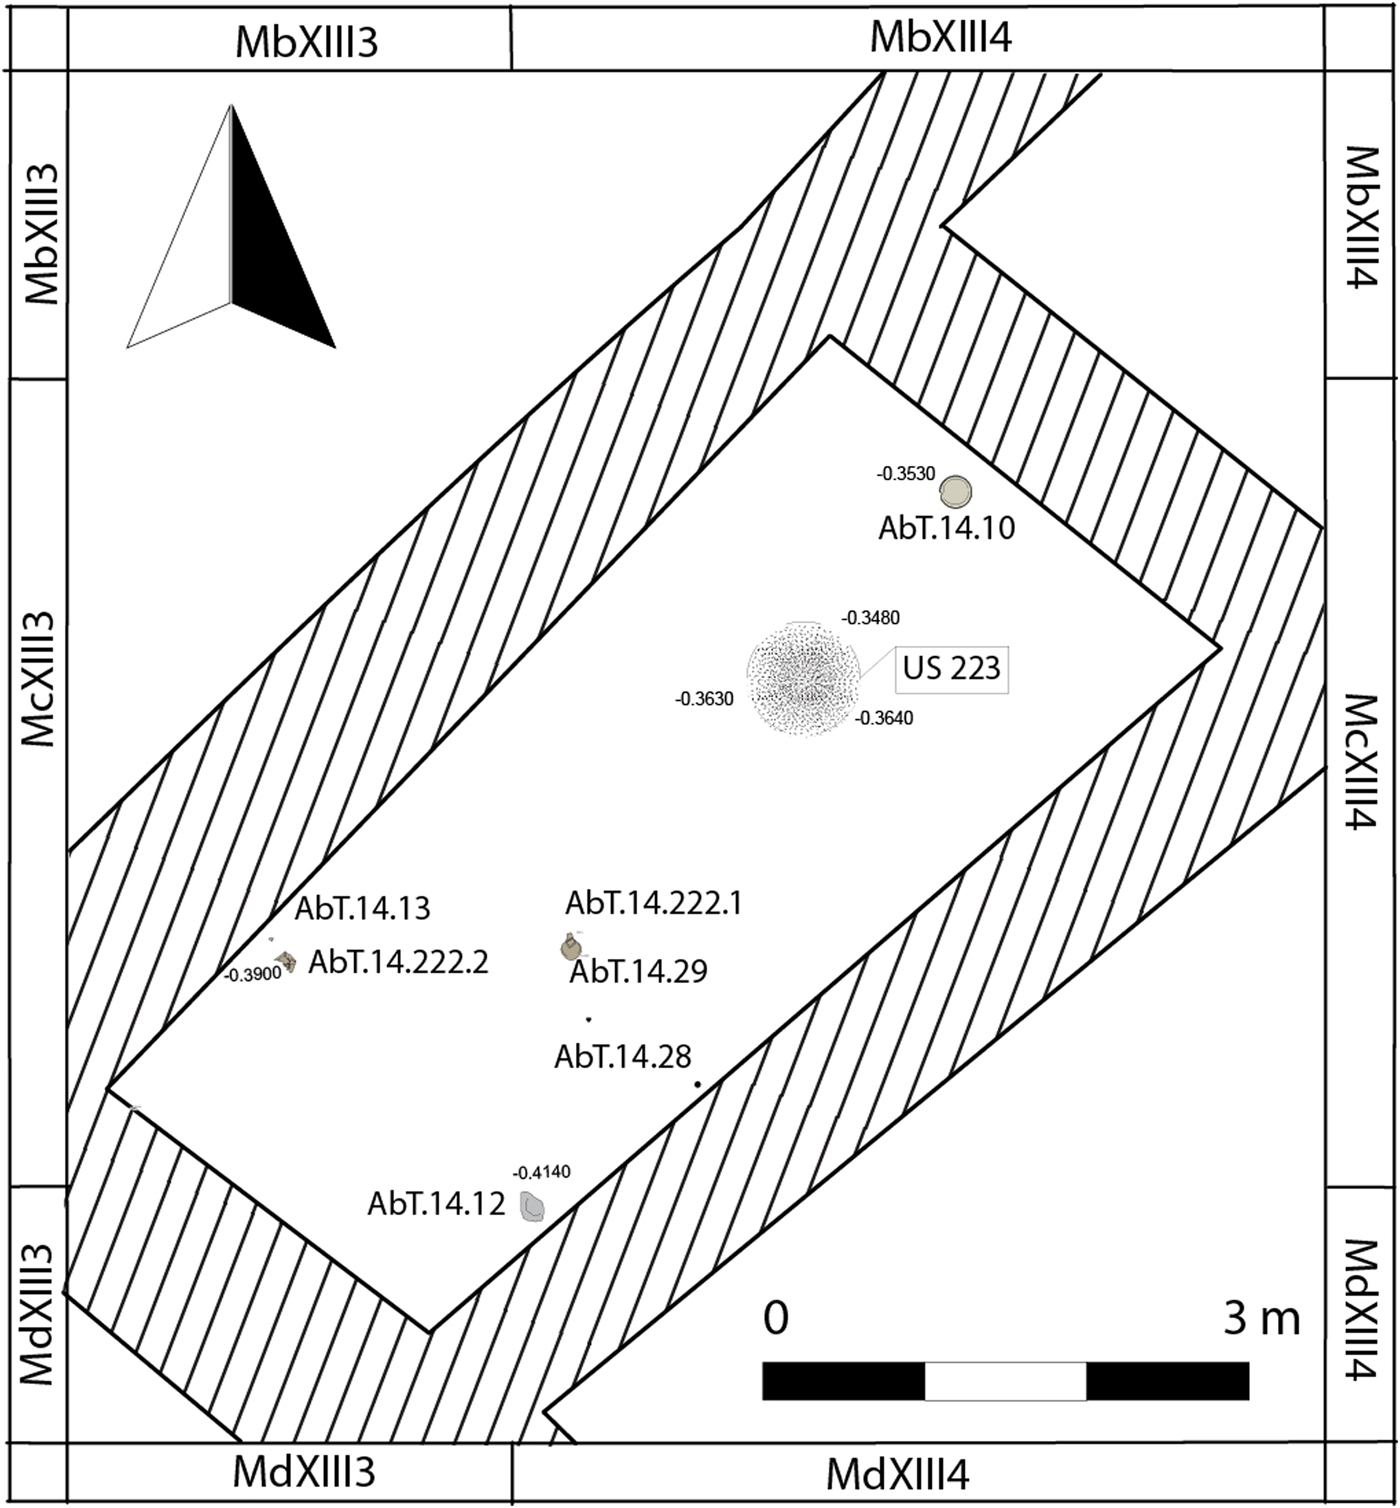
Abu Tbeirah. Area 1, Building A, Room 5 - Phase 2. Location of artefacts.
2.1.2 Phase 2 and Floor US 222
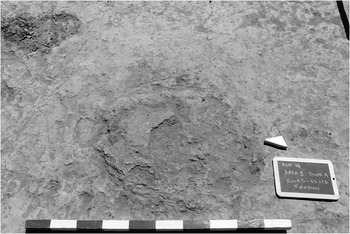
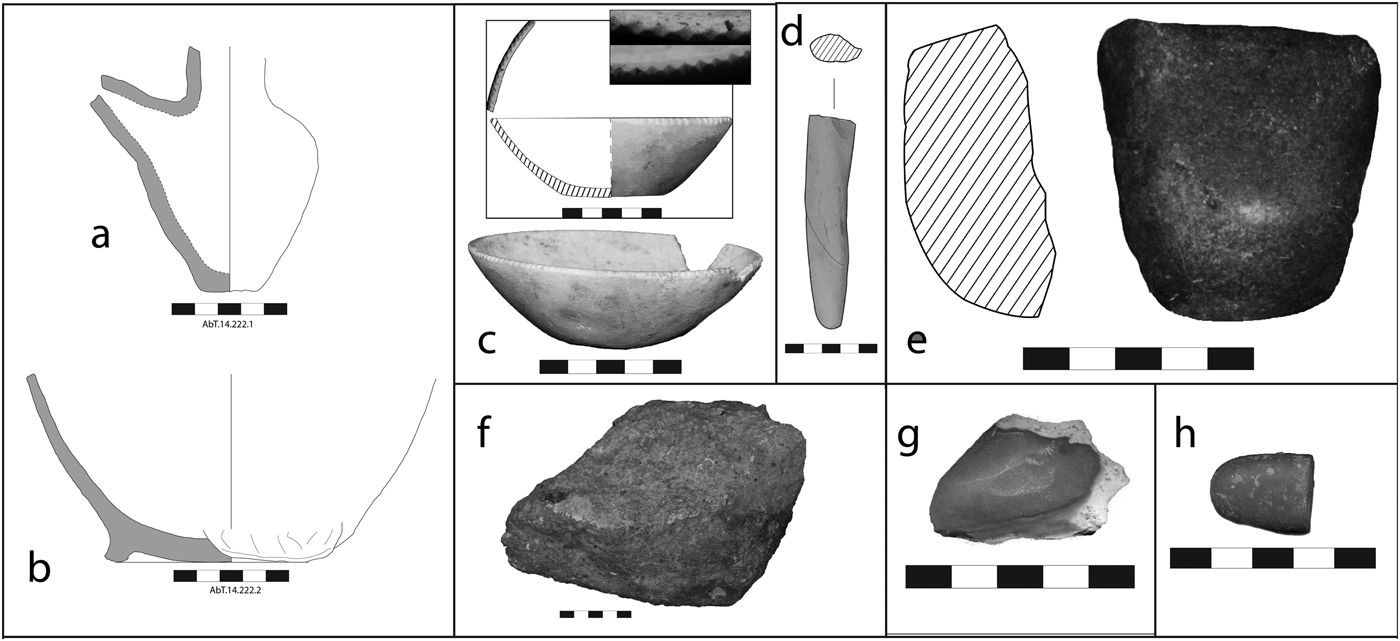
The two phases of occupation of the room were separated from each other by a stratum (US 193) of hard pale brown clay soil, rich in pottery fragments,Footnote 41 partially cut by Grave 14. Under this stratum, floor US 222, the object of this paper, was clearly distinguishable due to its compactness, especially harder near the hearth located in the northern part of the room (Fig. 4)Footnote 42. Some objects and pottery were found in situ on the floor (Fig. 5). An almost complete alabastrine vessel (AbT.14.10) was discovered near the north-east wall. The vessel was partially fixed in the floorFootnote 43 and it is not clear whether or not it belonged to the equipment of Grave 19; the elevation of the vessel is consistent with that of the floor and not with that of the grave, the cut for which was not visible on the floor. Nevertheless the object was located exactly near the left hip of the deceased but 15 cm higher. The other findings were instead located in the southern portion of the room, along the walls to the north-west (a convex base of a jar with three feet AbT.14.222.2 and AbT.14.13) and south-east (AbT.14.12) and near the center (spouted vessel AbT.14.222.1). After the floor sampling, the pottery recovered from the squares not selected for heavy residue analysis was described; most of the pottery fragments belonged to drinking vessels (especially plain rims), to jars and to a cooking pot.
Abu Tbeirah. Area 1, Building A, Room 5 – Phase 2. Hearth US 223.

Abu Tbeirah. Objects from Area 1, Building A, Room 5 – Phase 2.

2.1.2.1 Floor US 222: Pottery and Other Finds
AbT.14.222.1
Description: Hand-wheel spouted juglet with vertical rim, rounded shoulder and almost flat base. Spout attached separately. Burning traces (sooting) on exterior.
Dimensions: Base diam. 3 cm; wall th. 0.7 cm.
Clay: Outer and inner colour: 5 YR 8/3 (pink); fabric colour: 2.5YR 6/6 light red; sand inclusions; medium firing temperature.
Period and comparanda: Probably EDIII but with earlier comparisons (e.g., Delougaz and Lloyd Reference Delougaz and Lloyd1942: C.515.265)
AbT.14.222.2
Description: Base of jar with three feet; visible signs of spatula or another tool used to flatten inner and outer surfaces.
Dimensions: Base diam. 10.4 cm; wall th. 0.8 cm; base th. 1 cm.
Clay: Outer, inner and fabric colour: 2.5Y 8/3 (pale brown); sand inclusions; medium-high firing temperature.
Period and comparanda: Ring bases are common feature of jars of different kinds during all of the ED and Akk periods (see Moon Reference Moon1987: 105).
AbT.14.10
Description: Alabastrine limestone vessel, almost complete (part of the rim missing). Rim is decorated with small regular triangular incisions that create indentations of 3 mm.
Dimensions: Ht. 4 cm; wall th. 0.4 cm; diam 12 cm. base diam 5 cm.
Comparanda: AbT: AbT.14.60; Bismaya (Banks Reference Banks1905: 260–261 n. 3, similar dimension but different material, representation not clear).
AbT.14.11
Description: Chert flake.
Dimensions: 4.7 × 3 × 0.9 cm.
AbT.14.12
Description: Partially preserved basalt grinder. Sampled for phytolith analysis.
Dimensions: 14 × 7.5 × 21 cm.
AbT.14.13
Description: Half darkish gray pebble.
Dimensions: 1.7 × 2.9 × 0.7 cm.
AbT.14.28
Description: Small greenish over-fired clay cone (only pointed end preserved).
Dimensions: 11.5 × 2.9 × 1.5 cm.
AbT.14.29
Description: Fragment of multifunctional basalt tool (axe? half preserved).
Dimensions: 6.8 × 6.3 × 2.5 cm.
2.1.3 Grave 19
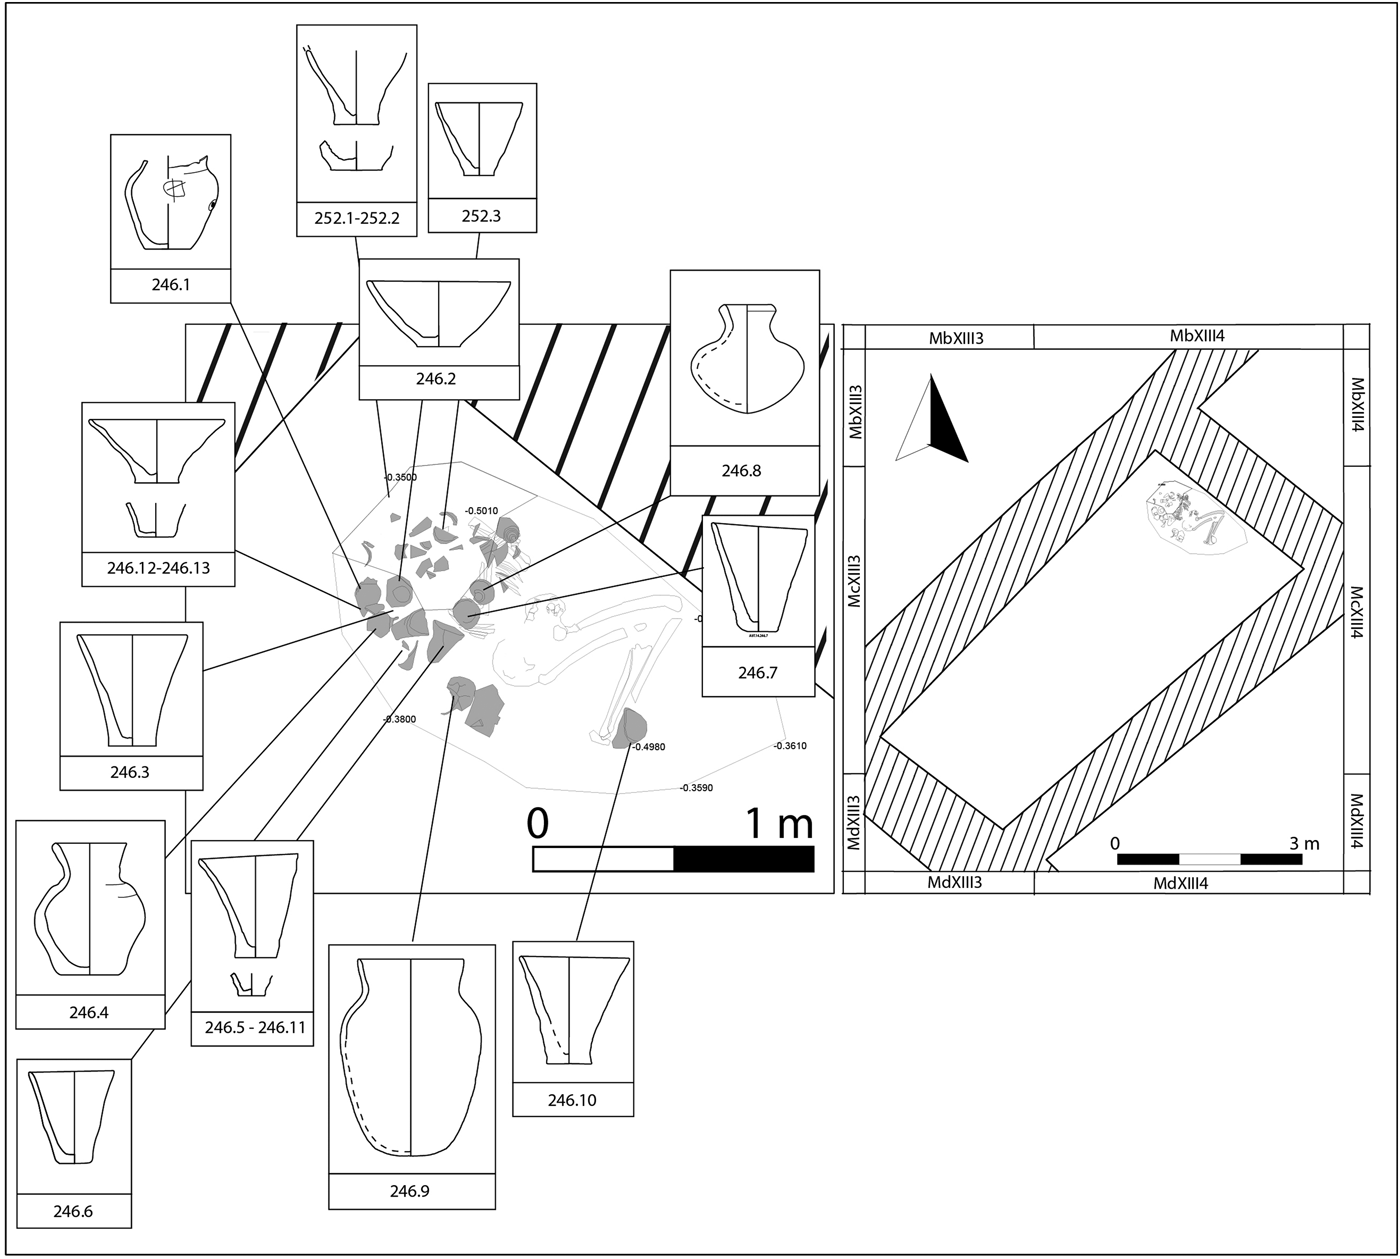
Under the floor along the northeast wall, a shallow grave was discovered (Fig. 6); the head of the deceased was cut by a pit (US 252–251) probably made by the same people inhabiting the building. The skeleton (US 248) was lying on its back with the missing head toward the northern corner of the room and arms and legs bent towards the wall. The right hand was near the base of a conical bowl, while a beaker was located near the feet. The grave equipment consisted of twelve drinking vessels (beakers and conical bowls), one plain rim jar, and three small and miniature jars, some of them found in pieces in the fill of a robbers’ hole (US 252).Footnote 44 For the sake of completeness, the pottery of Grave 19 will be described, to give a whole picture of the activities carried out in the room during its use.
Abu Tbeirah. Area 1, Building A, Room 5 – Phase 2. Grave 19 and pottery.

2.1.3.1 Grave 19: Pottery and Other Finds
AbT.14.246.1
Description: Wheel thrown flat-based jar with rounded shoulder. Potterʼs mark (circle with cross inside made with pointed tool, very similar to cuneiform sign UDU, “sheep”Footnote 45) on the shoulder and hole in body made before firing. The base is very thin and also has a small hole.
Dimensions: Wall th. 0.6 cm; base diam. 4.5 cm; base th. 0.3 cm.
Clay: Outer, inner and fabric colour: 10YR 8/3 (very pale brown); sand inclusions; medium-high firing temperature.
Period and comparanda: EDIII (Moon Reference Moon1987: 95).
AbT.14.246.2
Description: Fragmentary wheel thrown conical bowl, preserved from string cut base to plain rim.
Dimensions: Rim diam. 16 cm; rim th. 0.7 cm; wall th. 0.8 cm; base diam. 5 cm; base th. 1 cm; ht. 7.5 cm.
Clay: Outer, inner and fabric colour: 2.5YR 6/6 (light red); sand inclusions; medium-low firing temperature.
Period and comparanda: ED-Ur III.
AbT.14.246.3
Description: Almost complete wheel-thrown beaker with plain rim and string-cut base.
Dimensions: Rim diam. 12 cm; rim th. 0.5 cm; wall th. 0.6 cm; base diam. 5 cm; base th. 1 cm; ht. 13.5 cm.
Clay: Outer, inner and fabric colour: 2.5YR 6/6 (light red); sand inclusions; medium-low firing temperature.
Period and comparanda: ED-Ur III.
AbT.14.246.4
Description: Small wheel-thrown jar with plain rim, rounded upper body and string-cut base. Badly wheel-thrown: rillings very visible near base of neck.
Dimensions: Rim diam. 5.5 cm; rim th. 0.6 cm; wall th. 0.7 cm; base diam. 5 cm; base th. 0.5 cm; ht. 10 cm.
Clay: Outer, inner and fabric colour: 2.5YR 7/6 (light red); sand inclusions; medium firing temperature.
Period and comparanda: Very similar to Moon Reference Moon1987: 102 n. 500 (EDIII early) or examples in Delougaz and Lloyd Reference Delougaz and Lloyd1942: pl. 98 (EDIII-Akk.).
AbT.14.246.5
Description: Almost complete wheel-thrown beaker with plain rim and string-cut base. A mass of clay has been used to repair the base.
Dimensions: Rim diam. 12 cm; rim th. 0.6 cm; wall th. 0.7 cm; base diam. 5.3 cm; base th. 0.8 cm; ht. 12.5 cm.
Clay: Outer and inner colour: 5YR 6/6 (reddish yellow); fabric colour: 10YR 5/6 (yellowish brown); sand inclusions; medium firing temperature.
Period and comparanda: ED-Ur III.
AbT.14.246.6
Description: Wheel-thrown beaker with plain rim and string-cut base.
Dimensions: Rim diam. 12 cm; rim th. 0.7 cm; wall th. 0.7 cm; base diam. 5.5 cm; base th. 0.7 cm; ht. 13.2 cm.
Clay: Outer, inner and fabric colour: 5YR 6/6 (reddish yellow); sand inclusions; medium-low firing temperature.
Period and comparanda: ED-Ur III.
AbT.14.246.7
Description: Almost complete wheel-thrown beaker with plain rim and string-cut base.
Dimensions: Rim diam. 12.3 cm; rim th. 0.6 cm; wall th. 0.7 cm; base diam. 5 cm; base th. 1 cm; ht. 12.6 cm.
Clay: Outer colour: 5YR 6/4 (light reddish brown), inner colour: 5YR 8/4 (pink); fabric colour: 10YR 8/3 (very pale brown); sand inclusions; medium firing temperature.
Period and comparanda: ED-Ur III.
AbT.14.246.8
Description: Wheel-thrown small bottle with out-turned triangular rim, rounded shoulder and rounded base. The lower part was exposed to higher temperature during firing.
Dimensions: Rim diam. 4.5 cm; rim th. 0.7 cm; wall th. 0.7 cm; base th. 0.7 cm; ht. 8.5 cm.
Clay: Outer colour: 2.5Y 8/3 (pale brown); inner and fabric colour: 2.5YR 6/8 (light red); sand inclusions; medium firing temperature.
Period and comparanda: EDIII-Protoimperial (similar examples from Diyala: Delougaz and Lloyd Reference Delougaz and Lloyd1942: pl. 164).
AbT.14.246.9
Description: Wheel-thrown, plain rim jar with slightly flared neck, ovoid body and convex base. Burning traces on fractures.
Dimensions: Rim diam. 8.8 cm; rim th. 0.4 cm; wall th. 0.6 cm; base diam. 6 cm; base th. 0.5 cm; ht. 19.5 cm.
Clay: Outer and inner colour: 10YR 8/3 (very pale brown); fabric colour: 7.5YR 5/4 (brown); sand inclusions; medium firing temperature.
Period and comparanda: ED-Akk.
AbT.14.246.10
Description: Wheel-thrown beaker with plain rim and string-cut base.
Dimensions: Rim diam. 12.5 cm; rim th. 0.6 cm; wall th. 0.8 cm; base diam. 5.5 cm; ht. 13.5 cm.
Clay: Outer, inner and fabric colour: 5YR 7/6 (reddish yellow); sand inclusions; medium firing temperature.
Period and comparanda: ED-Ur III.
AbT.14.246.11
Description: String-cut base of wheel-thrown conical bowl.
Dimensions: Wall th. 0.8 cm; base diam. 5.5 cm; base th. 0.6 cm.
Clay: outer, inner and fabric colour: 5YR 6/4 (light reddish brown); sand inclusions; medium-low firing temperature.
Period and comparanda: ED-Ur III.
AbT.14.246.12
Description: Almost complete wheel-thrown plain rim conical bowl with string-cut base.
Dimensions: Rim diam. 14 cm; rim th. 0.6 cm; wall th. 0.7 cm; base diam. 5.3 cm; base th. 0.8 cm; ht. 8.1 cm.
Clay: Outer, inner and fabric colour: 5YR 6/6 (reddish yellow); sand inclusions; medium-low firing temperature.
Period and comparanda: ED-Ur III.
AbT.14.246.13
Description: String-cut base of wheel-thrown beaker.
Dimensions: Wall th. 0.6 cm; base diam. 6 cm; base th. 1.2 cm.
Clay: Outer, inner and fabric colour: 5YR 6/4 (light reddish brown); sand inclusions; medium firing temperature.
Period and comparanda: ED-Ur III.
AbT.14.246.14
Description: Overhanging rim of coiled big coarse ware vat. Probably in non-primary depositional context.
Dimensions: Rim diam. n.d; rim th. 4.2 cm.
Clay: Outer and inner colour: 10YR 7/3 (very pale brown); fabric colour: 5YR 6/4 (light reddish brown); mineral and vegetal inclusions; medium firing temperature.
AbT.14.246.15
Description: Wheel-thrown convex base of jar, with ring attached separately (probably non-primary depositional context).
Dimensions: Base diam.: 27 cm; base th. 2.9 cm.
Clay: Outer and inner colour: 10YR 8/3 (very pale brown); fabric colour: 5YR 8/4 (pink); and inclusions; medium-high firing temperature.
Period and comparanda: ring bases are common features of jars of different kinds during the ED and Akk periods (see Moon Reference Moon1987:105).
AbT.14.246.16
Description: Double-ridged rim of wheel thrown open vessel (probably non-primary depositional context).
Dimensions: Rim diam. 26 cm; rim th. 1.1 cm; wall th. 0.8 cm.
Clay: Outer and inner colour: 10YR 8/3 (very pale brown); fabric colour: 5YR 7/4 (pink); sand inclusions; medium-high firing temperature.
AbT.14.252.1
Description: Partially preserved (rim missing) wheel-thrown conical bowl, with string cut base.
Dimensions: Wall th. 0.8 cm; base diam. 5.5 cm; base th. 1 cm.
Clay: Outer and inner colour: 5YR 7/4 (pink); fabric colour: 2.5YR 7/6 (light red); sand inclusions; medium firing temperature.
Period and comparanda: ED-Ur III.
AbT.14.252.2
Description: String cut base of wheel-thrown drinking vessel.
Dimensions: Wall th. 0.9 cm; base diam. 5.5 cm; base th. 1.2 cm.
Clay: Outer, inner and fabric colour: 2.5YR 7/6 (light red); sand inclusions; medium firing temperature.
Period and comparanda: ED-Ur III.
AbT.14.252.3
Description: Wheel-thrown beaker with plain rim and string-cut base.
Dimensions: Rim diam. 11 cm; rim th. 0.5 cm; wall th. 1 cm; base diam. 4.9 cm; base th. 0.9 cm; ht. 12.5 cm.
Clay: Outer and inner colour: 5YR 8/4 (pink); fabric colour: 2.5YR 6/8 (light red); sand inclusions; medium-low firing temperature.
Period and comparanda: ED-Ur III.
3. Micro-debris analysis at Abu Tbeirah
3.1 Sampling and flotation
The first step undertaken in this study was the sampling of floor US 222 in Room 5. The sampling was carried out once the entire surface had been exposed and after careful evaluation of its preservation status. The floor did not show disturbances and was overall well preserved, even in the area near the northeast wall where Grave 19 had been reopened during the time the room was in use (see Section 2.1.3). Few in situ materials were identified on the floor, and they were recorded and removed before proceeding with the sampling. Indeed, materials located on the floor and not within it were treated differently because they represent another line of evidence, to be combined with the micro-residue results later. Subsequently, a grid of 50 × 50 cm was placed on the surface, with the aid of string and nails, and 33 samples of loose sediment were collected according to a chessboard pattern. This sampling strategy was chosen as it represents a good compromise between a satisfying degree of resolution and the time required to complete the operation. The floor was collected to a thickness of c. 2 cm, and the mean volume of the samples was c. 5 litres. Particular care was paid to sample only the proper floor surface so as to reduce the chances of including intrusive material in our analyses. No remaking of the floor was identified at the macroscopic level.
After collection, the samples underwent flotation and were screened through a 0.5 mm mesh mosquito net in order to remove the fine sediment matrix. However, prior to this operation a small quantity of sediment from each sample was bagged and stored for chemical analysis. Once floated, the remaining residues were hung to dry in their net, so as to preserve them and to facilitate their transportation. All the floated fractions were collected in the same net, since apart from fragments of modern roots other light residues were rarely retrieved. It is important to remember that the use of water (in both traditional flotation and wet sieving) in arid environments usually represents a hazard for the preservation of charred remains, due to the presence of salts and other hygroscopic minerals on these remains that, by absorbing water quickly, increase the fragmentation of botanic material and decrease its recovery chances.Footnote 46 Field observations did not reveal the presence of either noticeable or abundant botanical remains to be recovered with a different procedure, thus flotation was carried out. Indeed, flotation considerably speeds up the work and leaves residues much cleaner than with dry sieving procedures, facilitating the subsequent sorting operations.
3.2 Sorting, counting and interpolating
While the first two operations were carried out in the field, during the 2014 campaign, the following laboratory steps were conducted at the Department of Prehistoric and Historical Archaeology of the University of Vienna. There is no commonly accepted size range used by scholars;Footnote 47 in previous works the upper limit fluctuated between 1 and 30 mm and the lower limit even reached 0.25 mm.Footnote 48 In this study we chose to compromise by adopting an upper limit of 15 mm and a lower limit of 1 mmFootnote 49, based on heuristic considerations: an upper size class that can still be trampled and evade removal during cleaning operations of the spaces, and a lower size class in which the characteristics of the different materials can still be distinguished by the unaided eye.
Once the limits were set, the samples were screened through a 15 mm mesh to sort the bigger residues from the rest, and the remaining smaller fractions (by far the most abundant) were further screened by means of precision Retsch sieves, using the 2 and 1 mm meshes. This operation, as well as cleaning the samples from any residual silty dust that had not been washed away with the flotation, created two smaller subgroups of each sample, which made the identification of micro-residues easier.
Micro-residues were identified and separated from the natural or unidentifiable debris. This operation was accomplished with the help of tweezers, sorting trays and a transmitted light binocular microscope. Based on their physical characteristics, residues were divided into different material classes: bones, ceramics, bitumen, lithics, shells, eggshell, and charred botanical material (in addition a bead and bits of a powdered pigment were recovered). The micro-residues were then counted and the counts entered in an Excel table. Because the sediment samples show initial volume differences, raw counts were converted into numeric density (by dividing the number of finds by the volume of each sample) in order to uniformly compare the values of all samples.
The last step of the analysis involved the development of quantitative graphical models of the micro-residue densities, by means of ArcGIS 10.3. These graphical methods, as mentioned in Section 2, are useful tools that allow us to directly perceive and easily interpret the distribution of density values.Footnote 50 In order to obtain visually pleasing density plots, we used the ESRI Spatial Analyst toolbox and performed a spline-tension interpolation. Interpolation is a method that, through specific mathematical functions, predicts the values of cells at locations that lack sampled points, and so fills the gaps where we have no density values.Footnote 51 It is based on the principle of spatial autocorrelation or spatial dependence, which measures degree of relationship/dependence between near and distant objects.Footnote 52 There are numerous alternatives for this method but here we decided to use the spline-tension interpolation, according to Ullah et al. Reference Ullah, Duffy and Banning2015.Footnote 53
4. Description of the results
All the analysed samples include natural particles, anthropogenic unidentifiable clasts, artefacts and ecofacts, both smaller and larger than 15 mm.
4.1 Natural and unidentified component
In all the samples, the coarse natural fraction is composed of sandy-silt aggregates cemented by precipitated salts (possibly gypsum), formed under the local environmental conditions.Footnote 54 Gravel and stone fragments are almost absent from the samples, while nodules of pure silty clay are moderately attested. Finally, compacted lumps of mud mixed with mineral/vegetal inclusions and with an overall smooth surface occur very frequently. These appear to be possible residues of eroded mud-bricks, plasters, fragments of pottery (see Section 4.2.3) and objects made with the same kind of raw materials. Their highly weathered appearance suggests a non-primary depositional context and that they probably came to be embedded within the floor deposit through the recycling of sediments for construction purposes. They are therefore not considered here as by-products connected to the use of the room and are not part of our analysis.
4.2 Residues between 1 and 15 mm
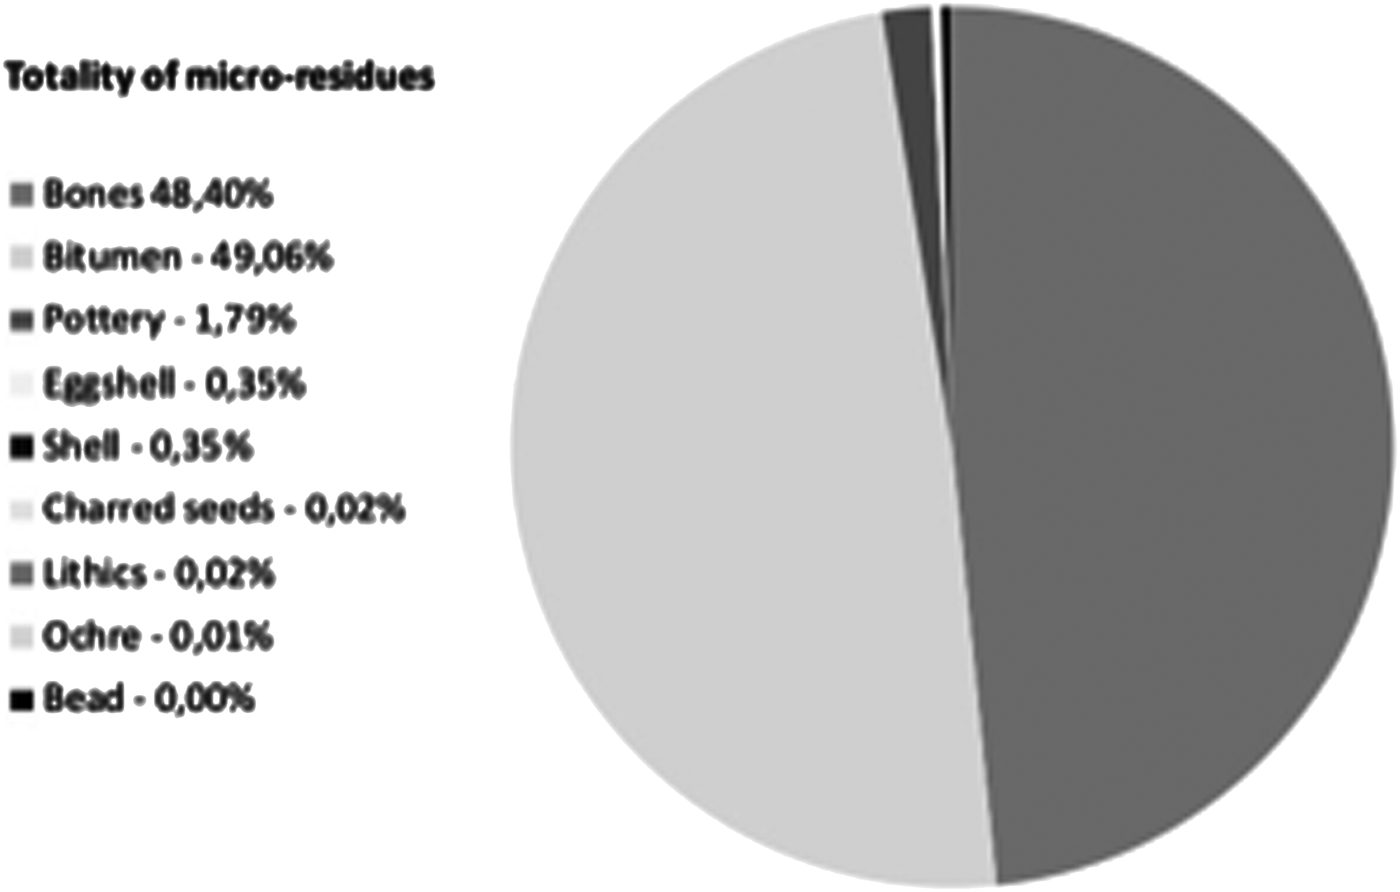
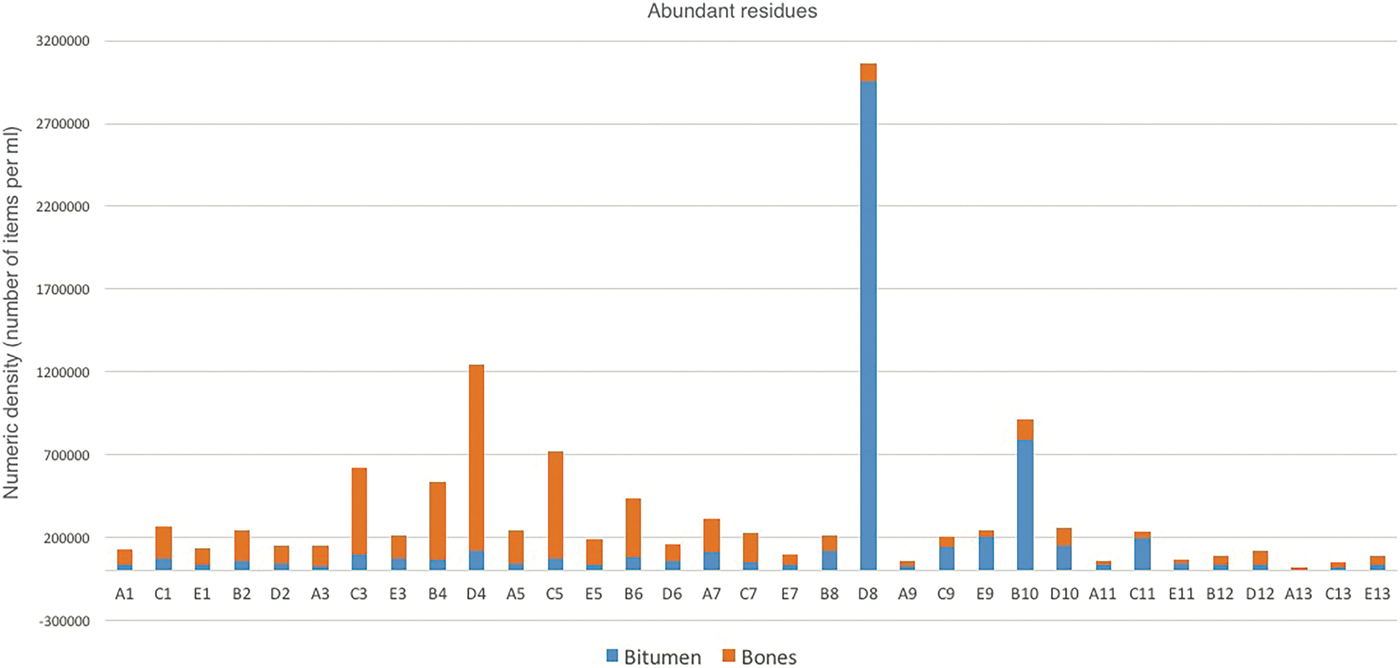
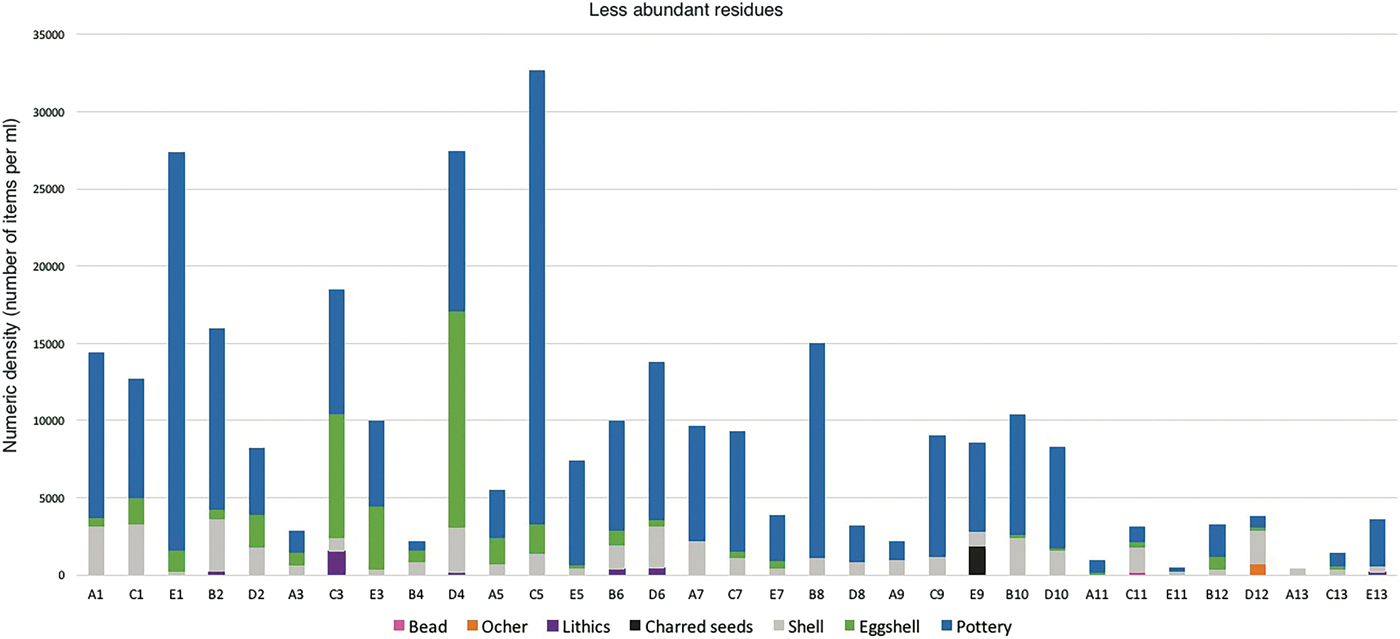
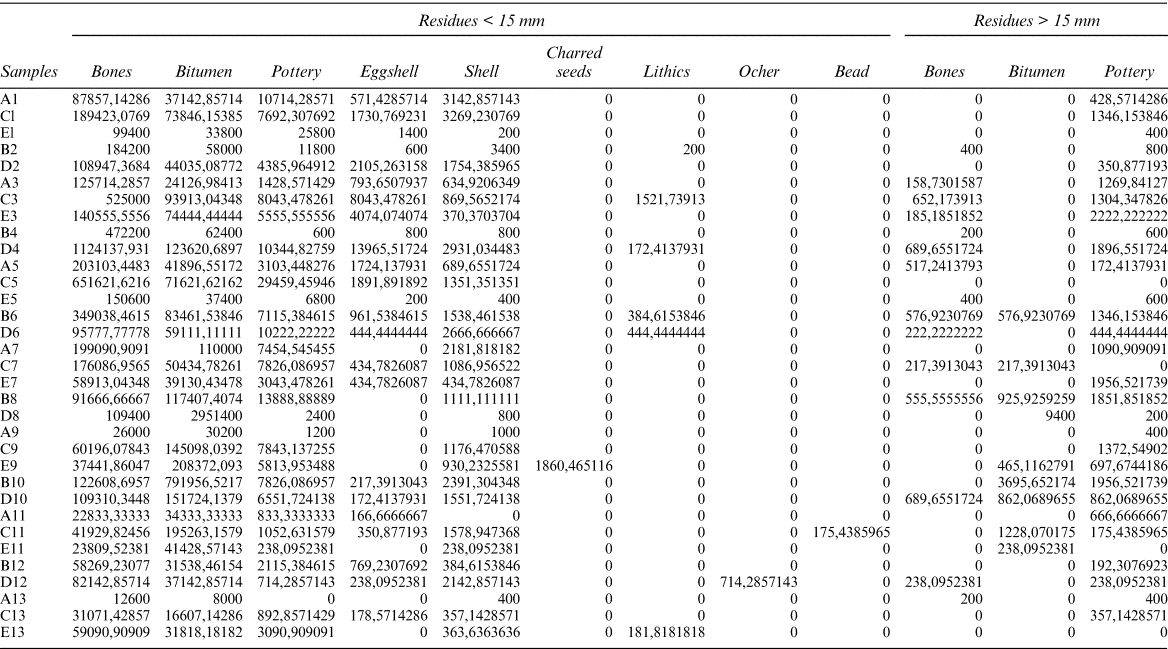
As mentioned above, residues of different material classes were identified in the floor samples of Room 5. The frequency of each material in the samples is shown in Fig. 7. Among these, bones and bitumen are the two categories with the most abundant fragments, and they alone represent almost the totality of the recovered finds. Because of such considerable quantitative differences between the residue classes, the interpolation maps are presented using different value ranges in order not to obscure the less abundant residues, while the relationship between the different density values of each sample can be seen in Table 1 and in bar charts Fig. 8 and Fig. 9. This way of presenting results will allow a better appreciation of the spatial behaviour and the relative concentrations of each material class, that collectively define the character and the story of the analysed room.
Pie chart showing the relative percentage of each class of residues in the analysed samples.

Bar chart indicating the density values of bone and bitumen residues in each sample of the floor.

Bar chart indicating the density values of the less abundant residues in each sample of the floor.

Table presenting the density values of all material residues in each of the samples, divided per material class and dimension range.

4.2.1 Bitumen
Bitumen occurs as a solidified mass mixed with a fine mineral component and with abundant plant material, such as straw. The organic additive can be seen in the form of negative impressions but occasionally also in partially preserved plant material.
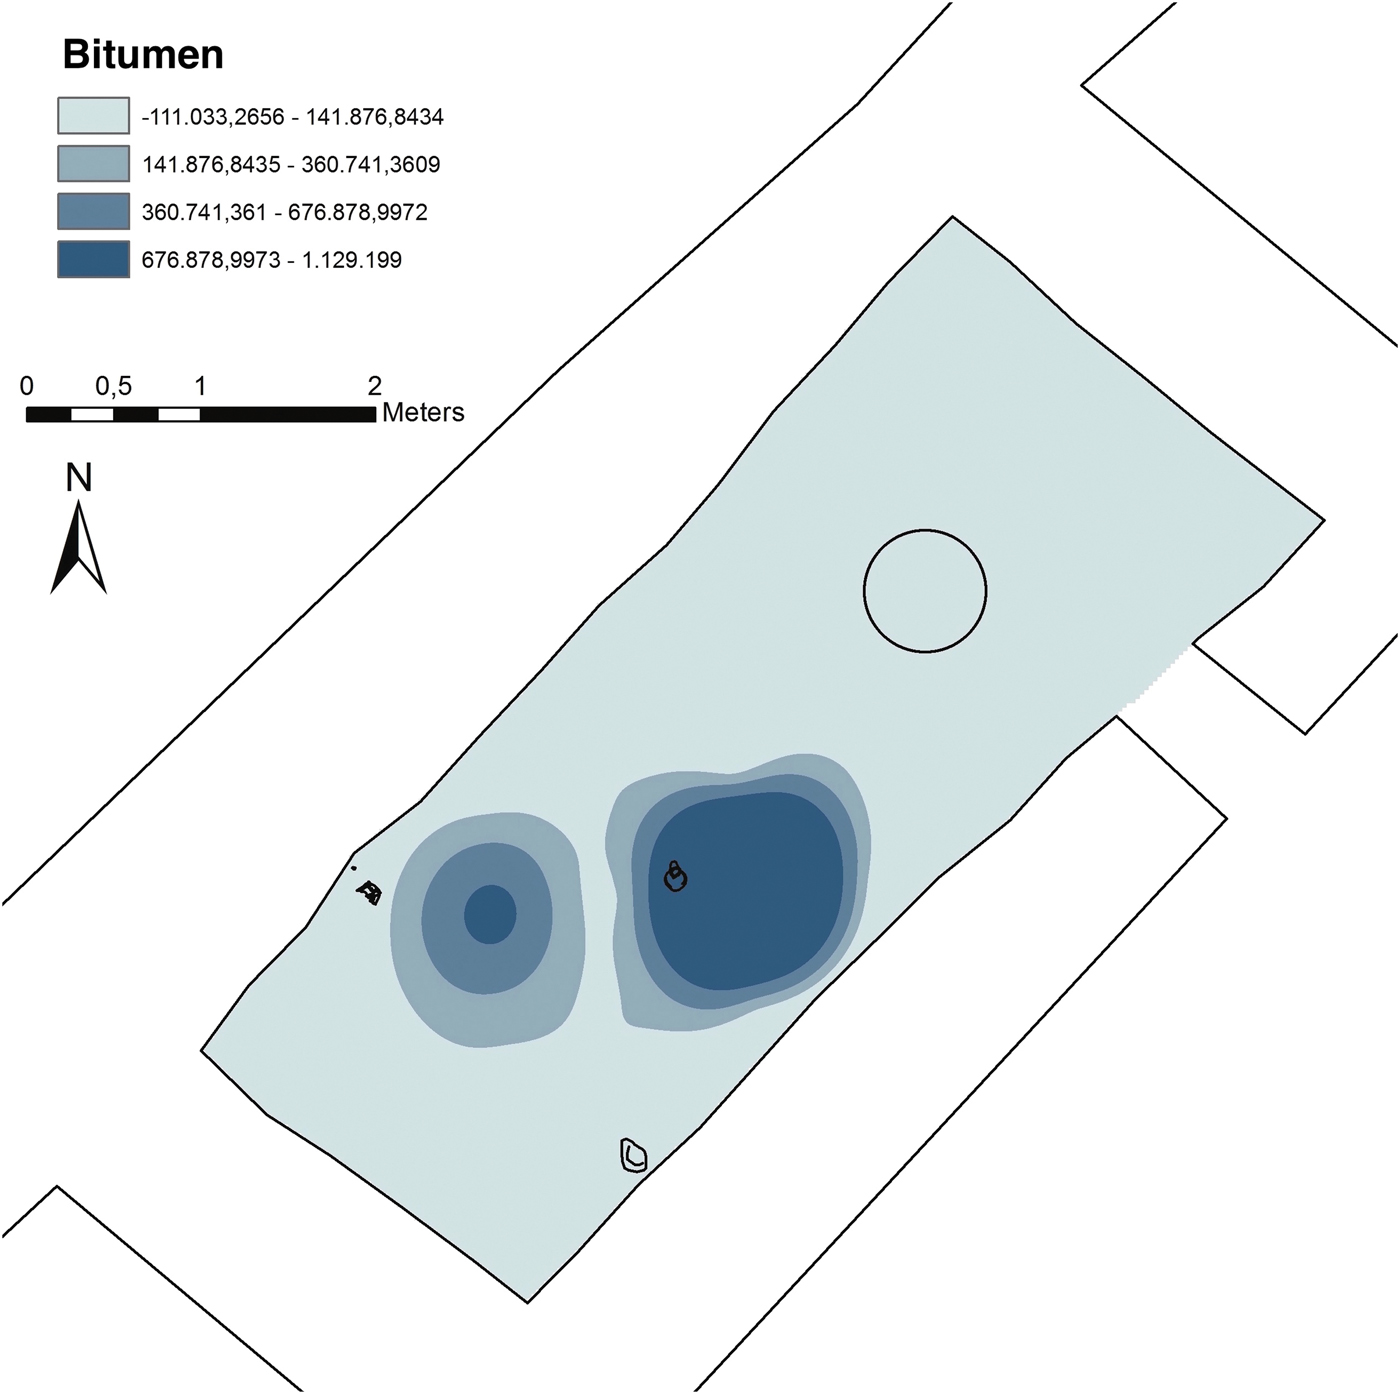
Within the room, bitumen was recovered almost exclusively and in very high concentrations in the area to the south of the fireplace; notably, a higher concentration is recognizable near the juglet AbT.14.222.1 and another more limited concentration is located to the west of the first (Fig. 10).
Interpolation map of the bitumen residues.

4.2.2 Bones
Among the bones, large quantities of fish were recovered, mainly in the form of scales, fishbones and vertebrae. While fish is largely attested, other micro-faunal remains are almost absent from the record, except for a rodent mandible and a couple of caudal vertebrae. More detailed information about the taxa of the recovered bones cannot be provided yet, but a specialized analysis will shortly be carried out. Almost no calcinated or clearly charred bones were identified, but considerable amounts of finds show a brown/ dark brown colouring. This could be due to exposure to fire but could also depend on the depositional context and on the interaction of the bones with minerals and organic substances in the sediment.Footnote 55 Zooarchaeological analyses and infrared spectroscopyFootnote 56 will help in defining which exact taphonomic processes the bones underwent.
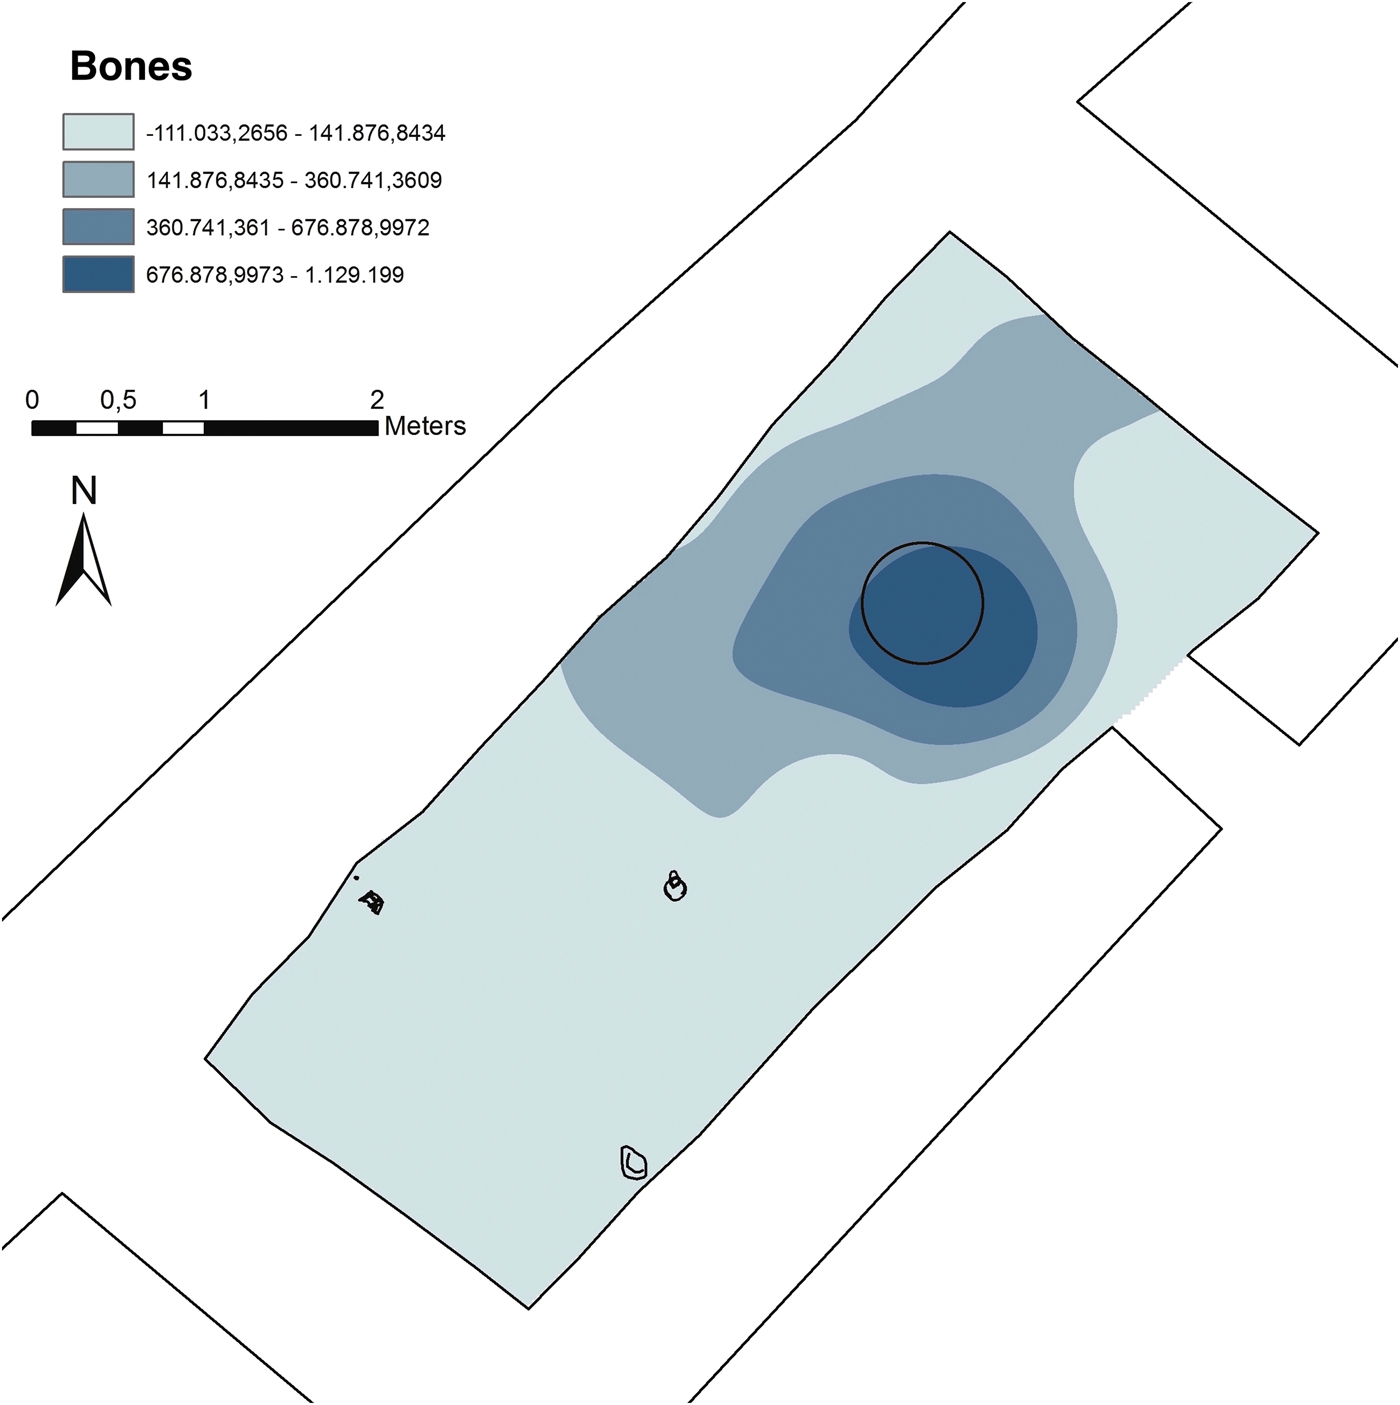
As previously said, bone residues are encountered in all the samples of the room, but also a clear and substantial concentration can be recognized by the fireplace, spreading into the surrounding area up to the north-east wall on one side and to the centre of the room on the other (Fig. 11).
Interpolation map of the bone residues.

4.2.3 Pottery
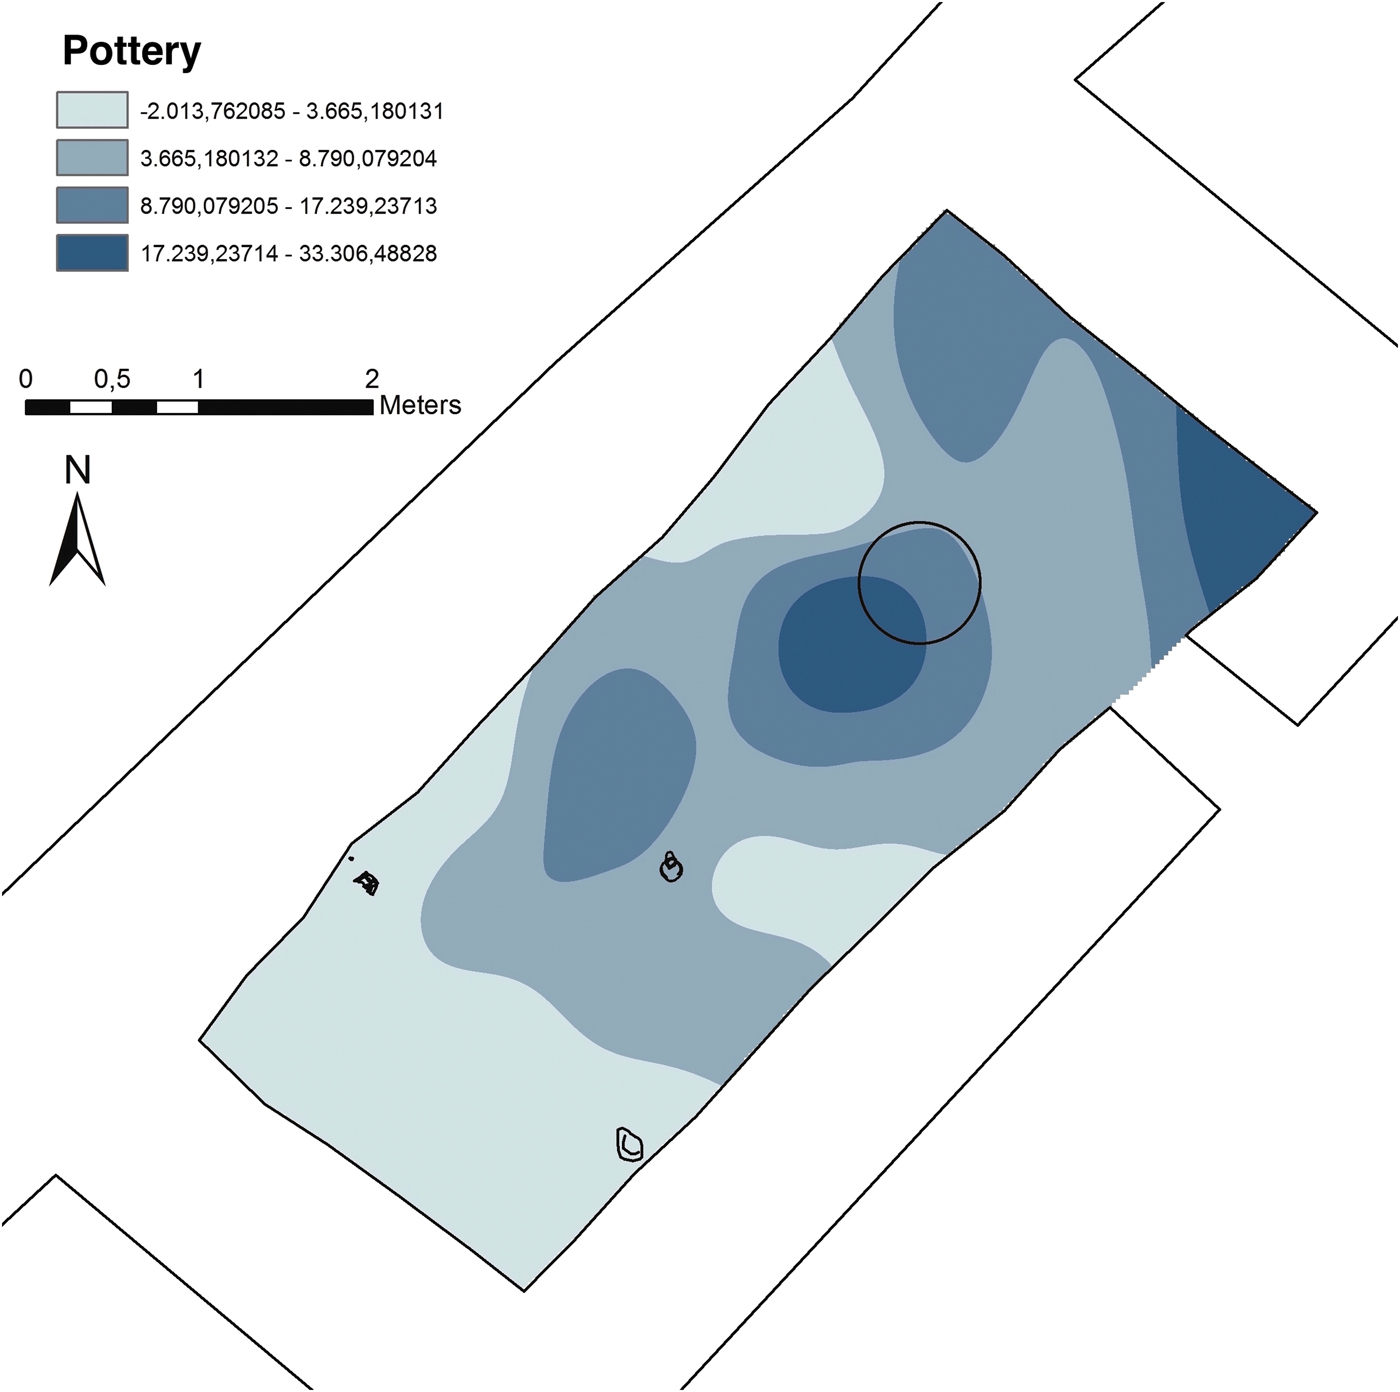
The recognition of pottery debris was more challenging than for other material classes, especially in those fragments that approach 1 mm. This is due to the aforementioned widespread occurrence of background lumps that share a similar composition with pottery. Therefore, some criteria were adopted to distinguish the ceramic fragments supposedly belonging to the use of the room: the occurrence of distinctive features, such as a flat or smooth surface; a higher resistance to breakage when pressure is applied; the occurrence of sharp edges that suggest a “fresh” fracture. As for the bones, detailed information on the distinctive features of the fragments is not provided here but will follow after analysis by a pottery specialist. Regarding their occurrence, the fragments recovered are numerically less than the first two classes. Their dispersal covers a large part of the room, from the centre to the north-eastern limit of the room, and has a sinuous distribution with at least two residue-free areas. More consistent concentrations are also visible in front of the fireplace and close to the north-eastern wall, especially in its easternmost corner (Fig. 12).
Interpolation map of the pottery residues.

4.2.4 Eggshell
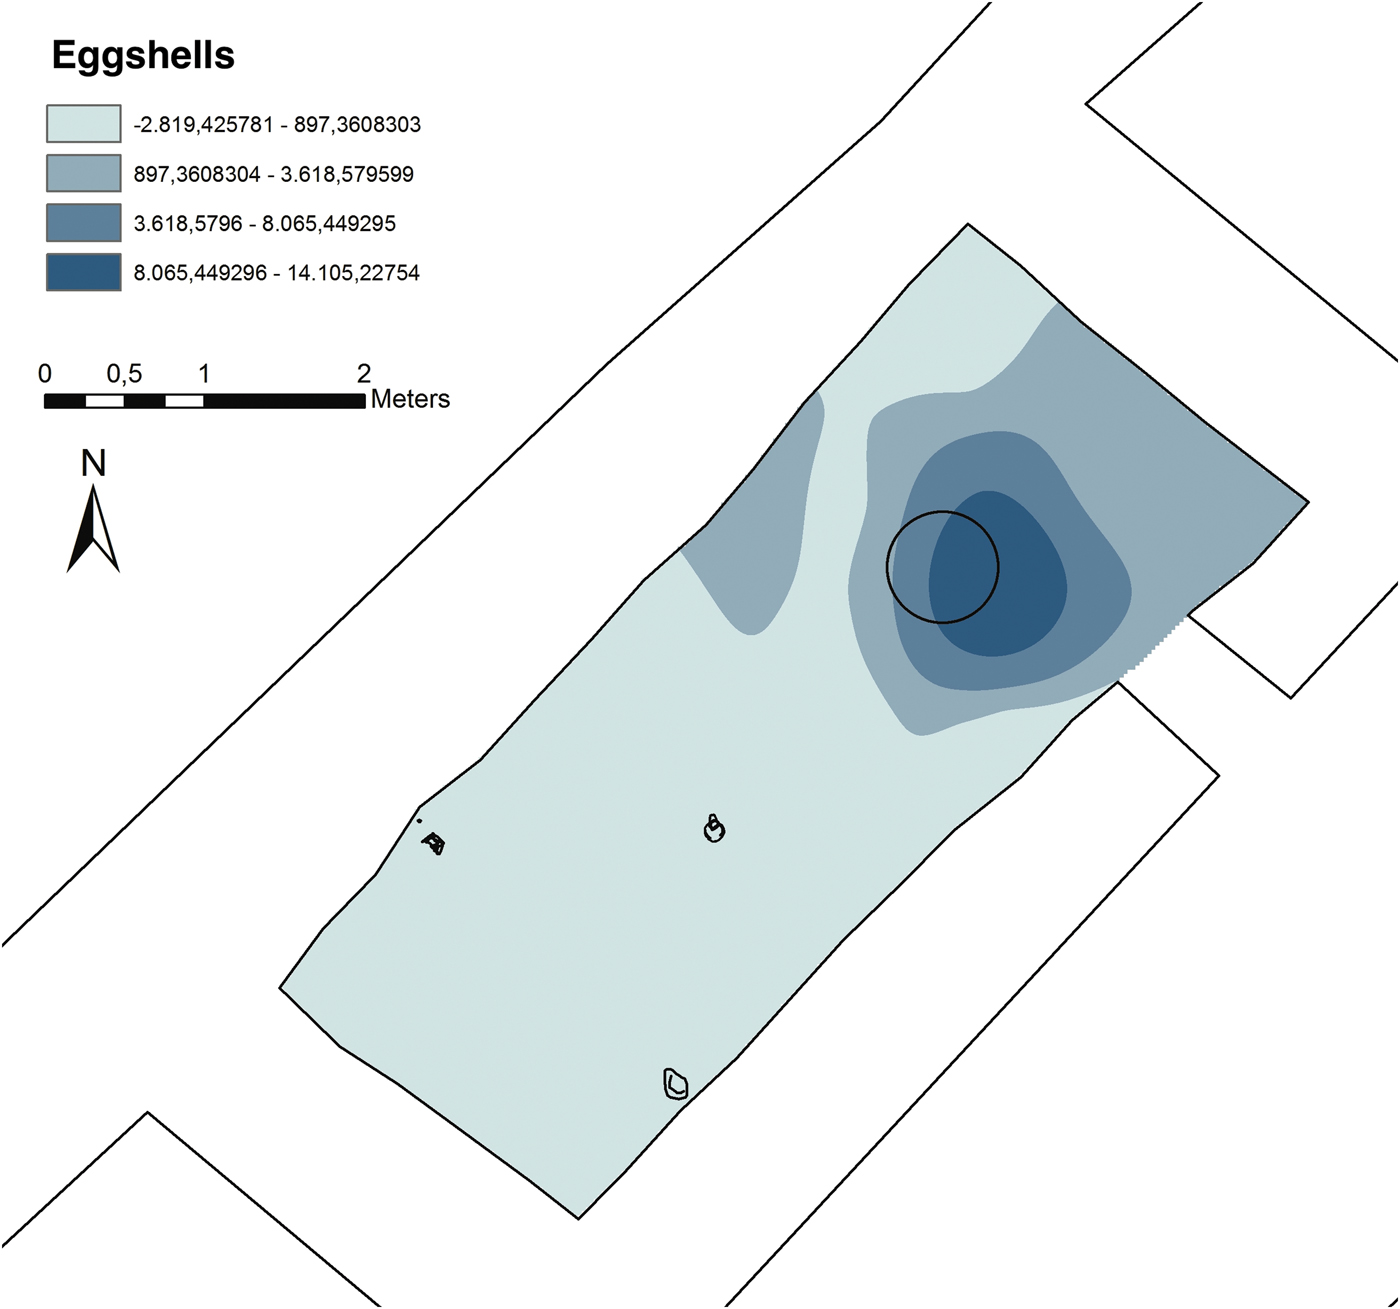
Eggshell identification is based upon a distinctive curvature, smooth surfaces on both the inside and the outer face, and the presence of pores that pass through its structure.Footnote 57 Despite being less abundant than the former material classes, once again analyses show a distinctive concentration of these residues in the area of the fireplace (Fig. 13) with a diffuse spread towards the north-eastern wall of the room.
Interpolation map of the eggshell residues.

4.2.5 Shells
Shells, like eggshell, were easily recognizable on the basis of their physical features, such as an often layered structure,Footnote 58 their colour and occasional opalescent appearance. Whole preserved specimens are very few, all belonging to the gastropod taxonomic class.
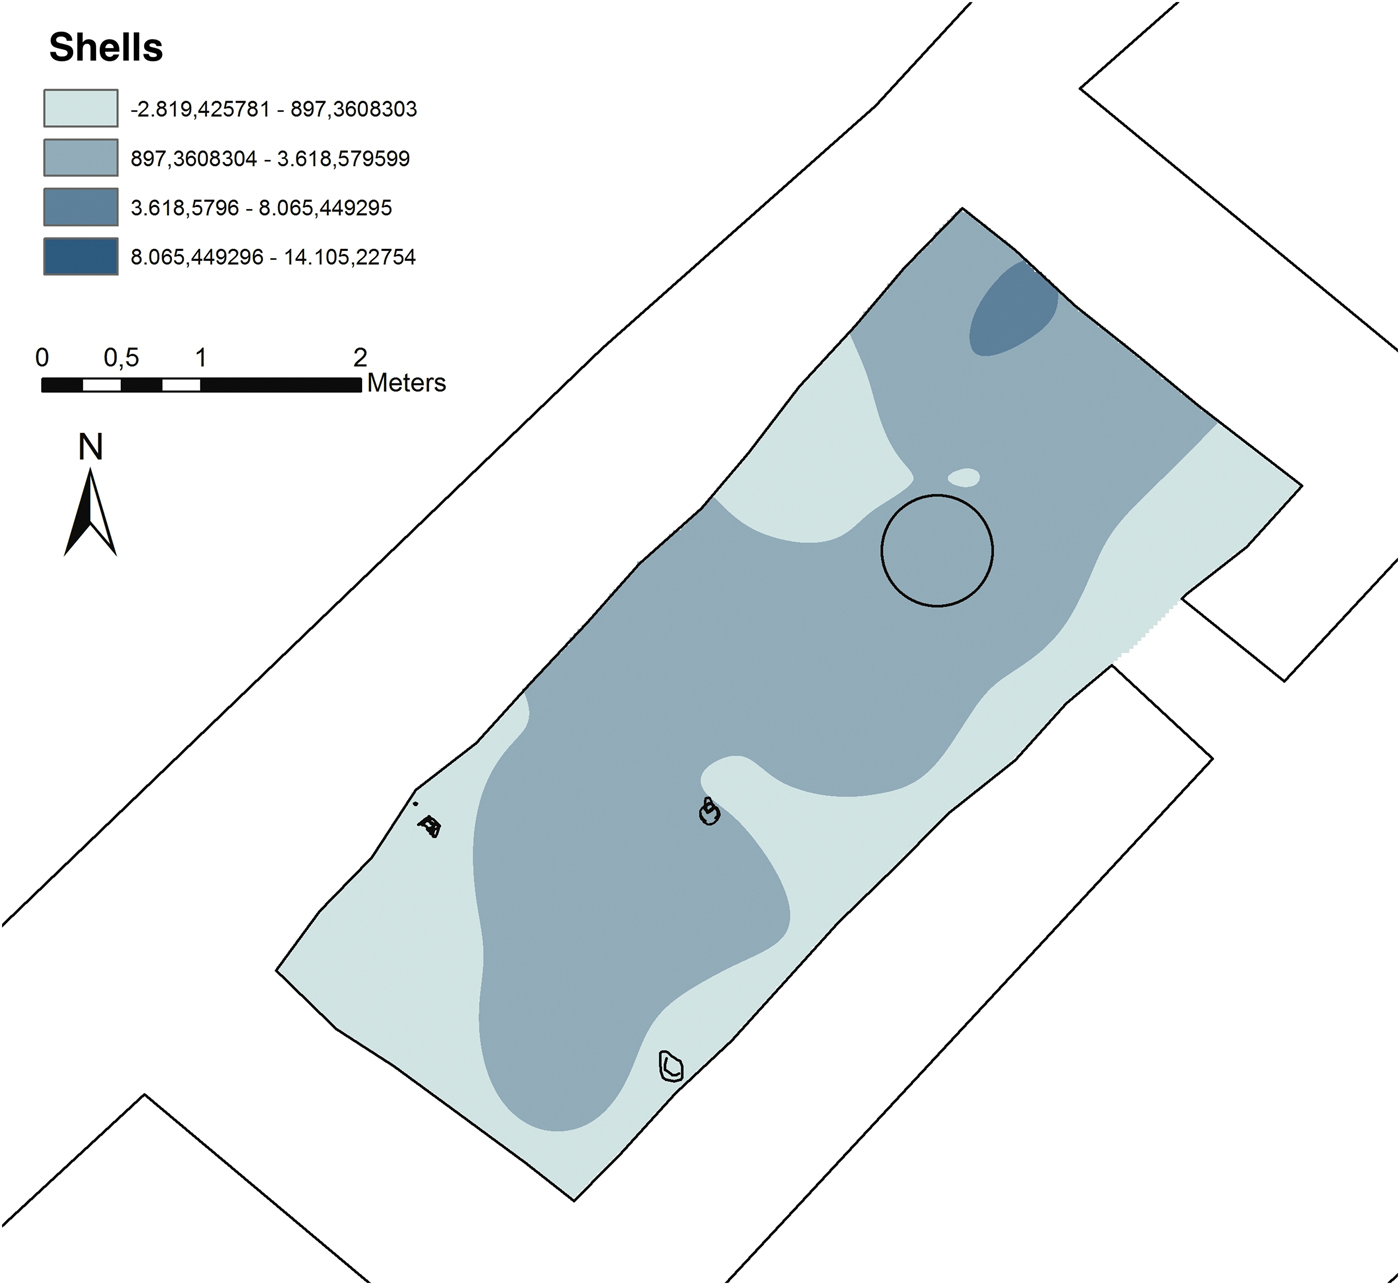
The occurrence of these finds covers the entire surface of the room but in very limited quantities and in such a homogeneous and uniform pattern that significant concentrations could not be detected. An exception is made for a very limited concentration by the north-eastern corner (Fig. 14).
Interpolation map of the shell residues.

4.2.6 Lithics
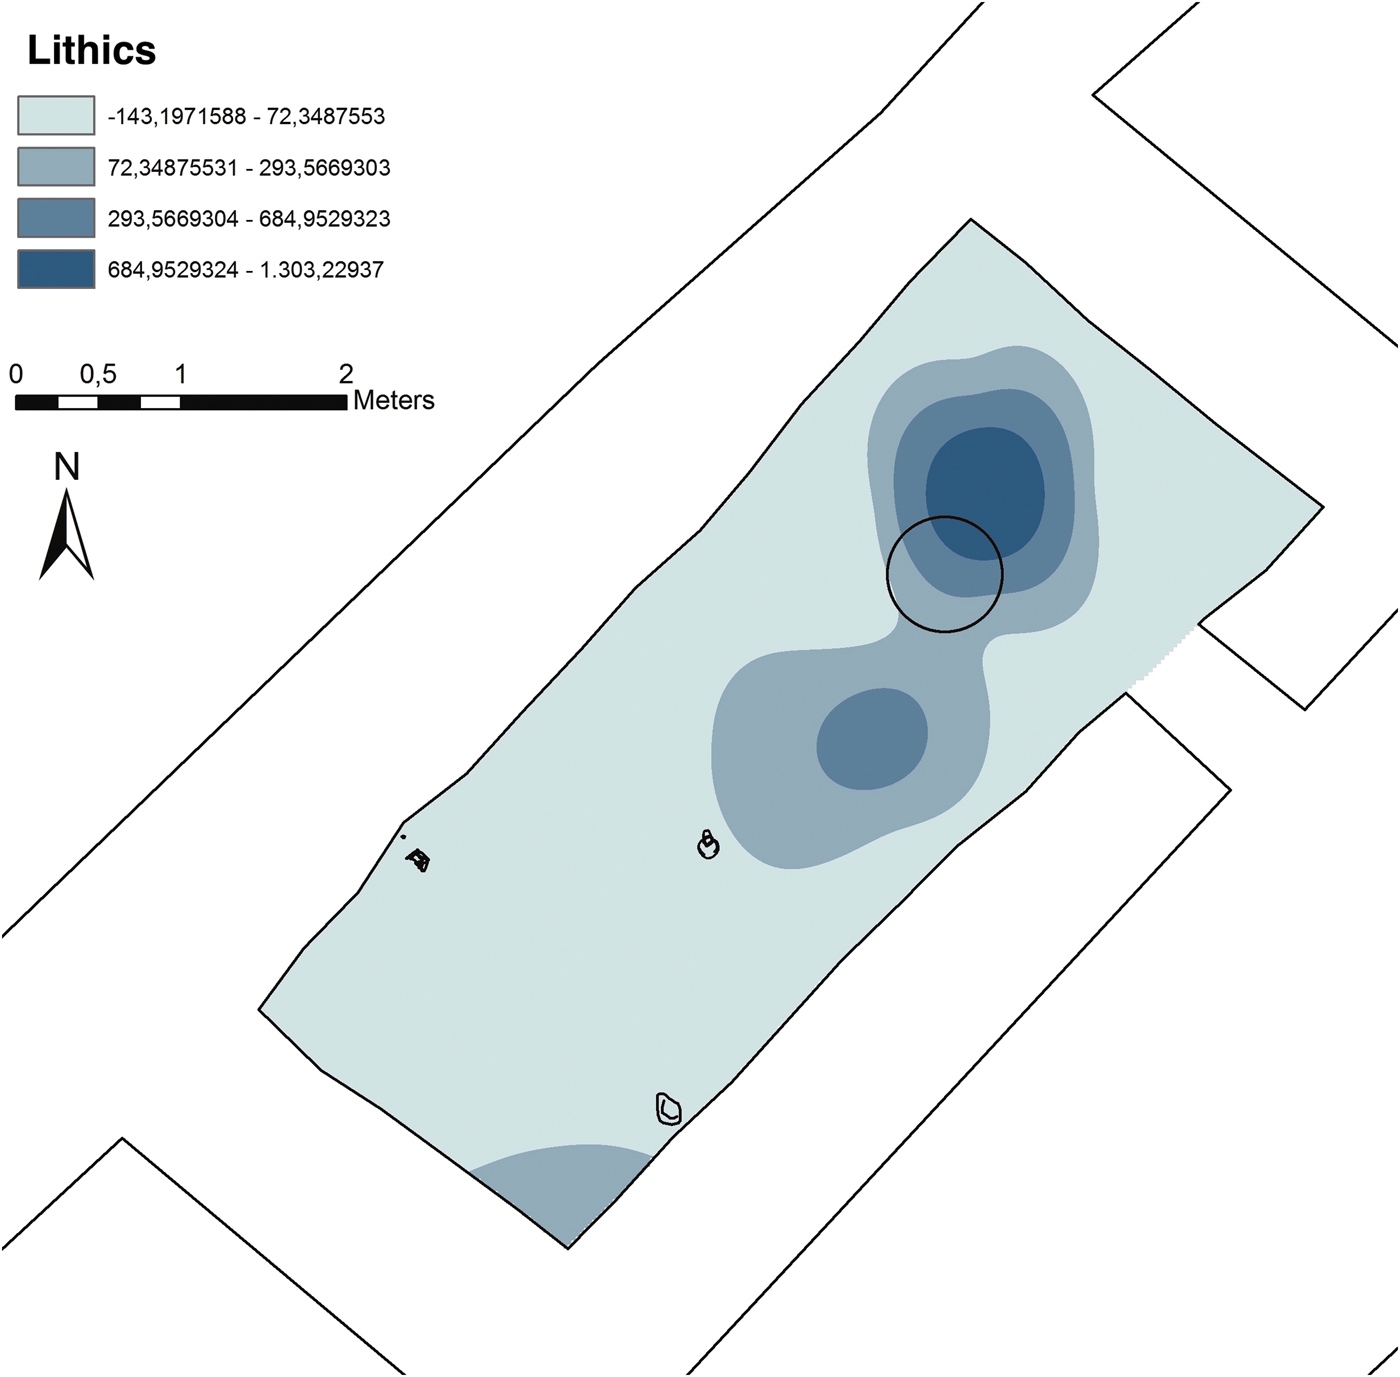
The lithic remains are represented by flint fragments, maybe resulting from the use of stone tools. All the identified residues present the same yellowish-brown and light brown colour (10YR 6/4 and 7/4 of Munsell colour charts). Also in this case, small quantities of this material were found and, apart from sporadic traces in the southern corner of the room, they were concentrated by the north-eastern side of the fireplace and, in smaller amounts, by the southern side of the same (Fig. 15).
Interpolation map of the lithic residues.

4.2.7 Charred seeds and other materials
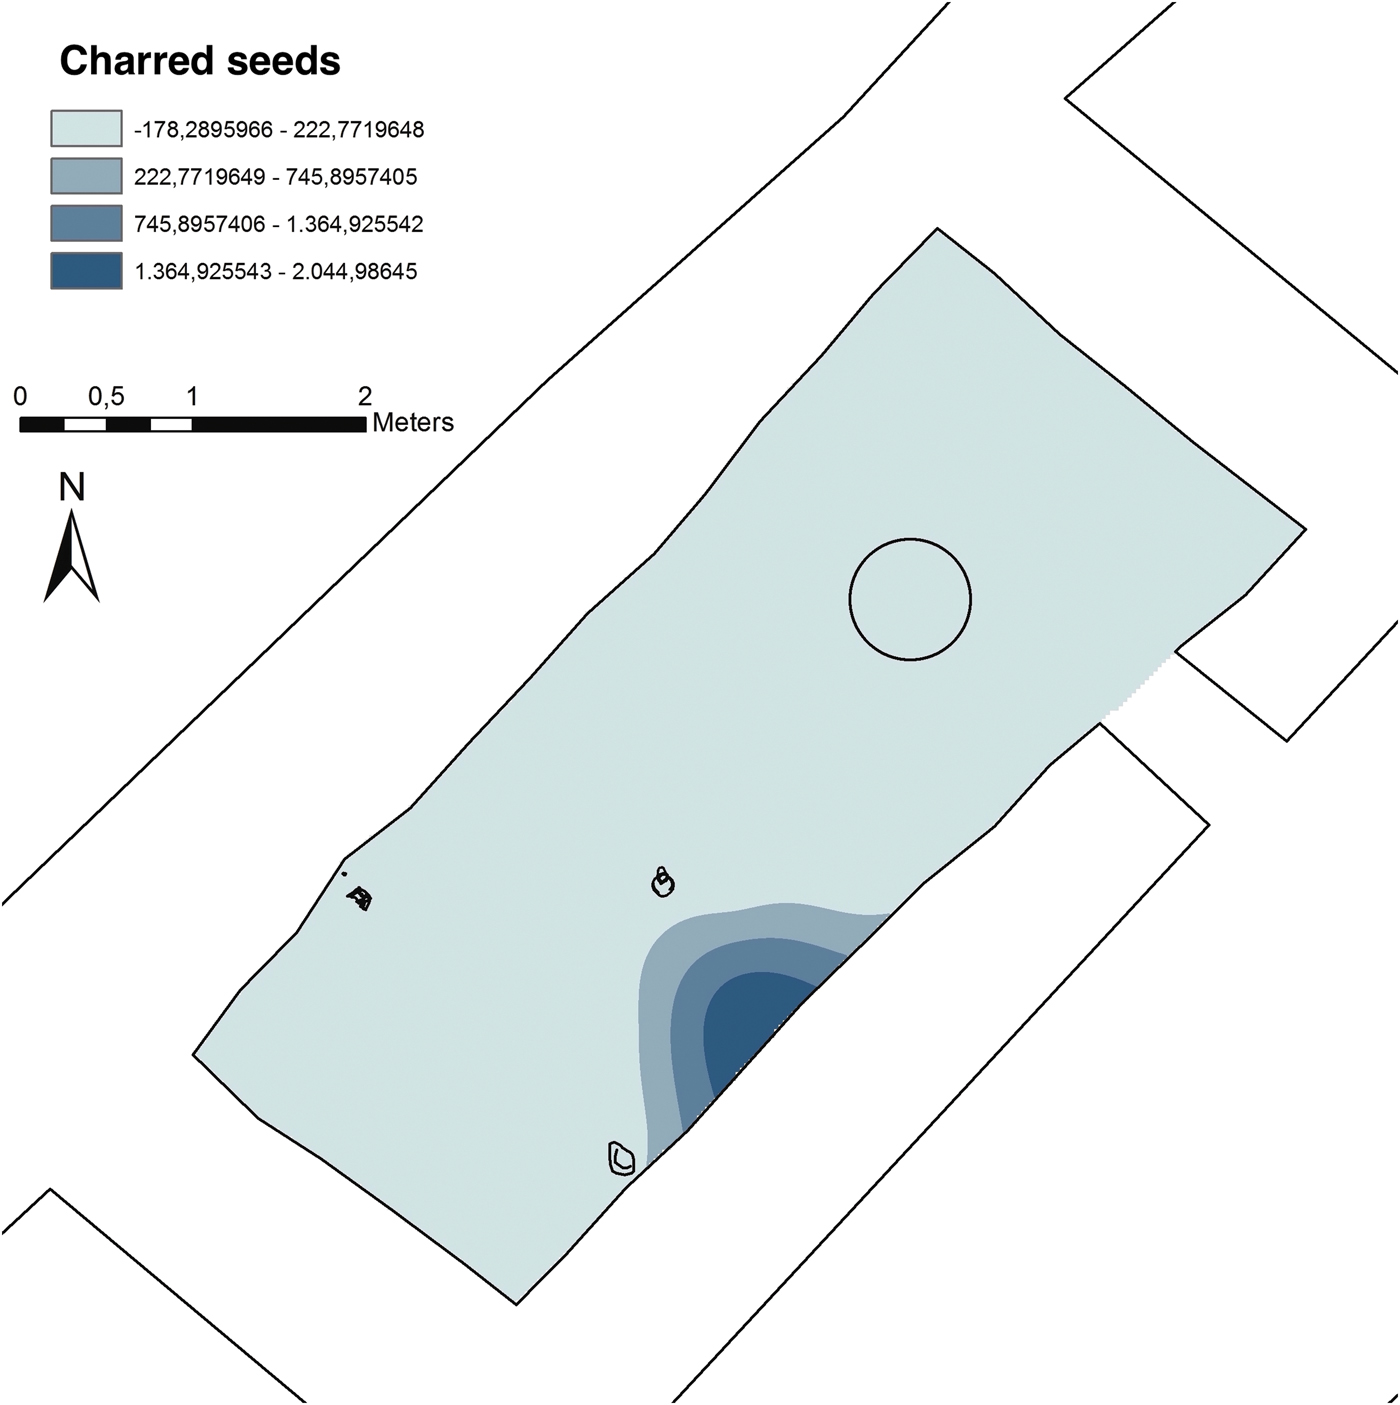
Despite the use of flotation, which is not considered the best option for the recovery of charred plant material in a semi-arid context, charred seeds were found in one of the samples. The relatively good state of preservation of the seeds, which show few traces of “melting” despite some being fragmentary, seems to suggest that at least in this context, the use of water did not compromise their survival. The recovery of these seeds is limited to one single sample, which is located in the southern part of the room, by the eastern wall, between the grinding stone fragment AbT.14.12 and juglet AbT.14.222.1 (Fig. 16).
Interpolation map of the charred seed residues.

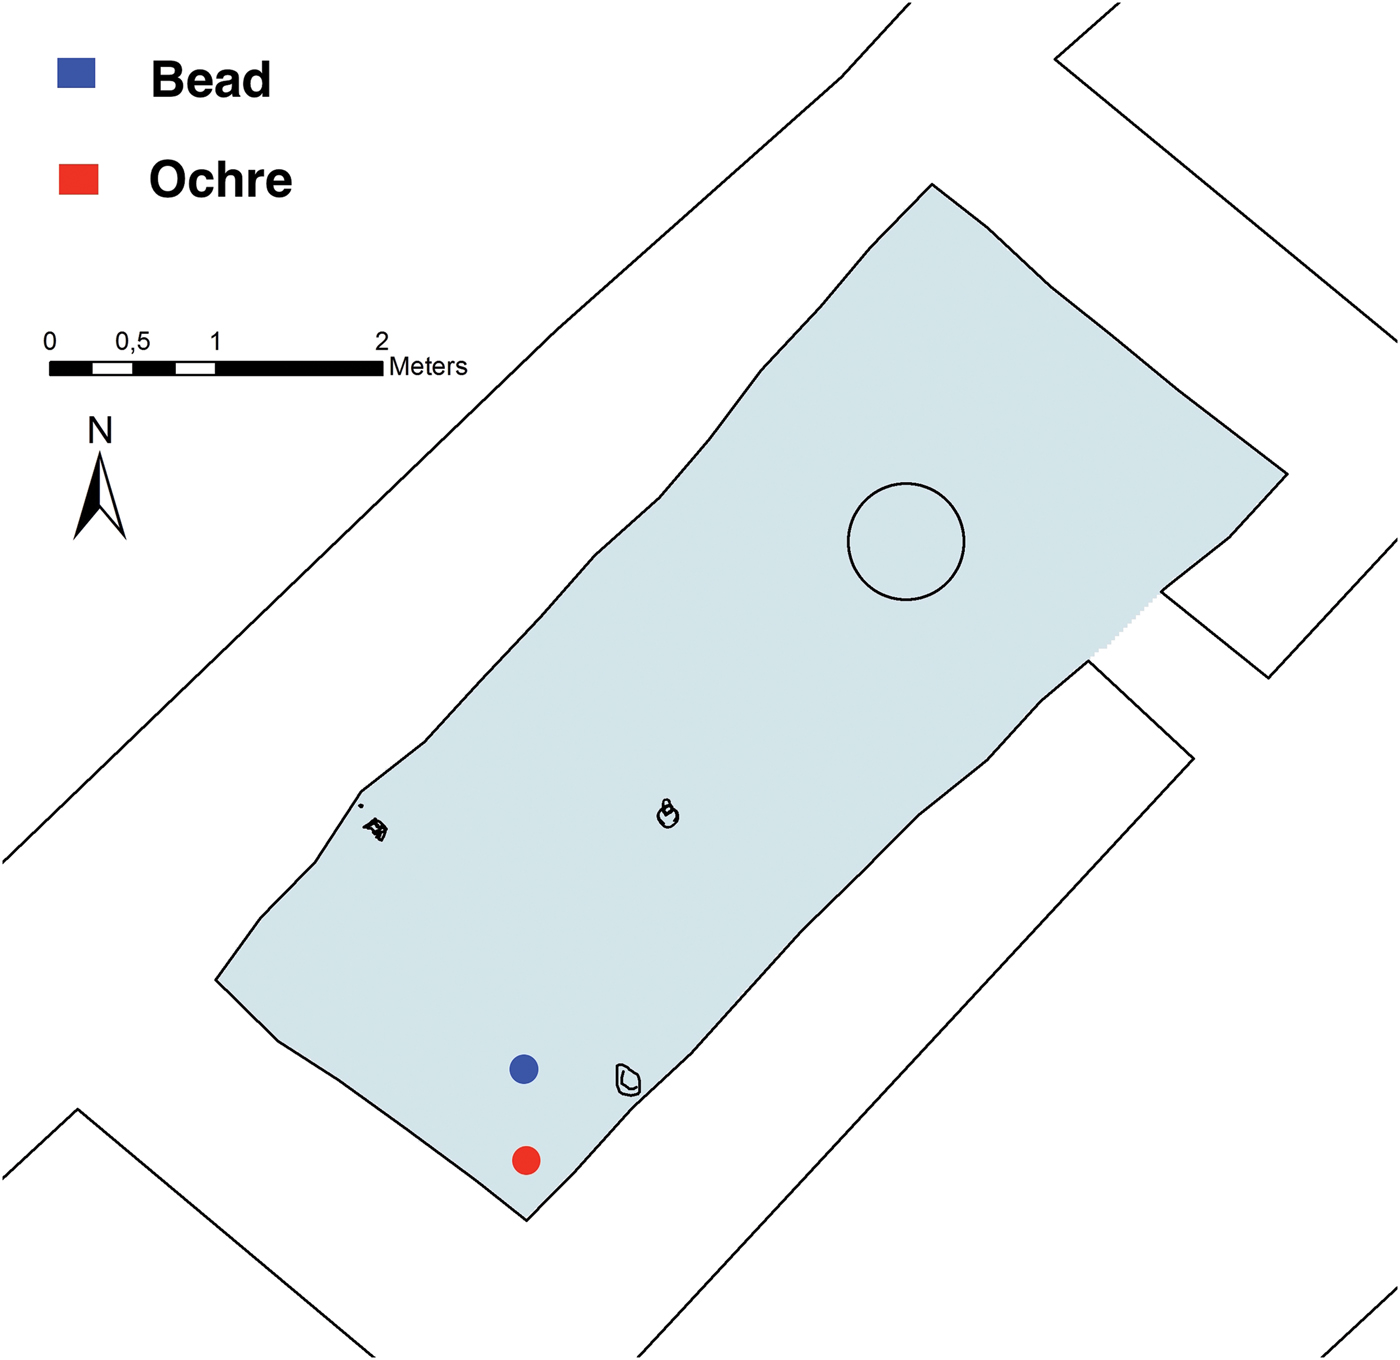
In addition to the residues listed above, in the southern area of the room one stone bead and three small lumps of an orange/reddish powdered pigment were also recovered (Fig. 17).
Map showing the location of the bead and pigment residues.

4.3 Residues larger than 15 mm
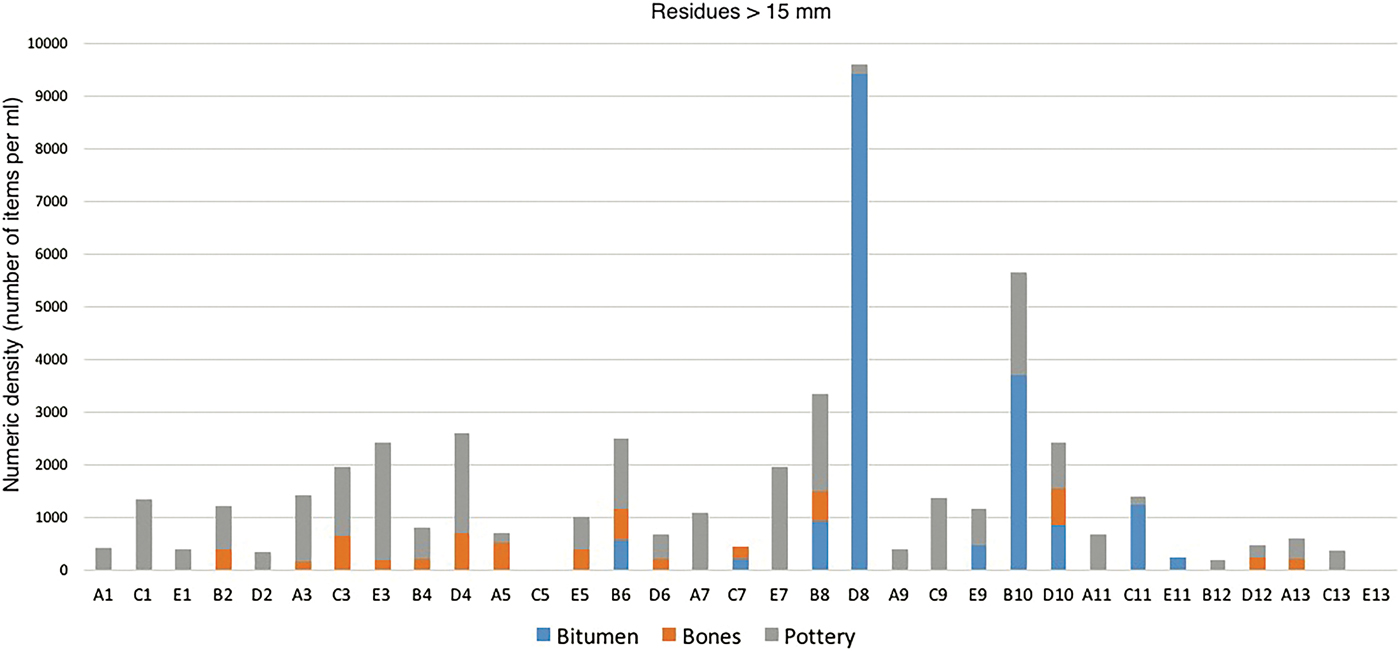
Finds larger than 15 mm are only a minor amount of the residues recovered from the floor (Fig. 18). The macro-finds belong to three material classes: bitumen, bones and pottery. With few exceptions, the largest dimension of these finds does not reach 5 cm, and the largest fragment found belongs to a ceramic vessel measuring 10 cm in length, located in the north-eastern corner of the room.
Chart indicating the density values of residues larger than 15 mm in each sample of the floor.

Despite exceeding the proposed size limits, these materials were included in this analysis in order to provide a comparison with the spatial behaviour of micro-residues.
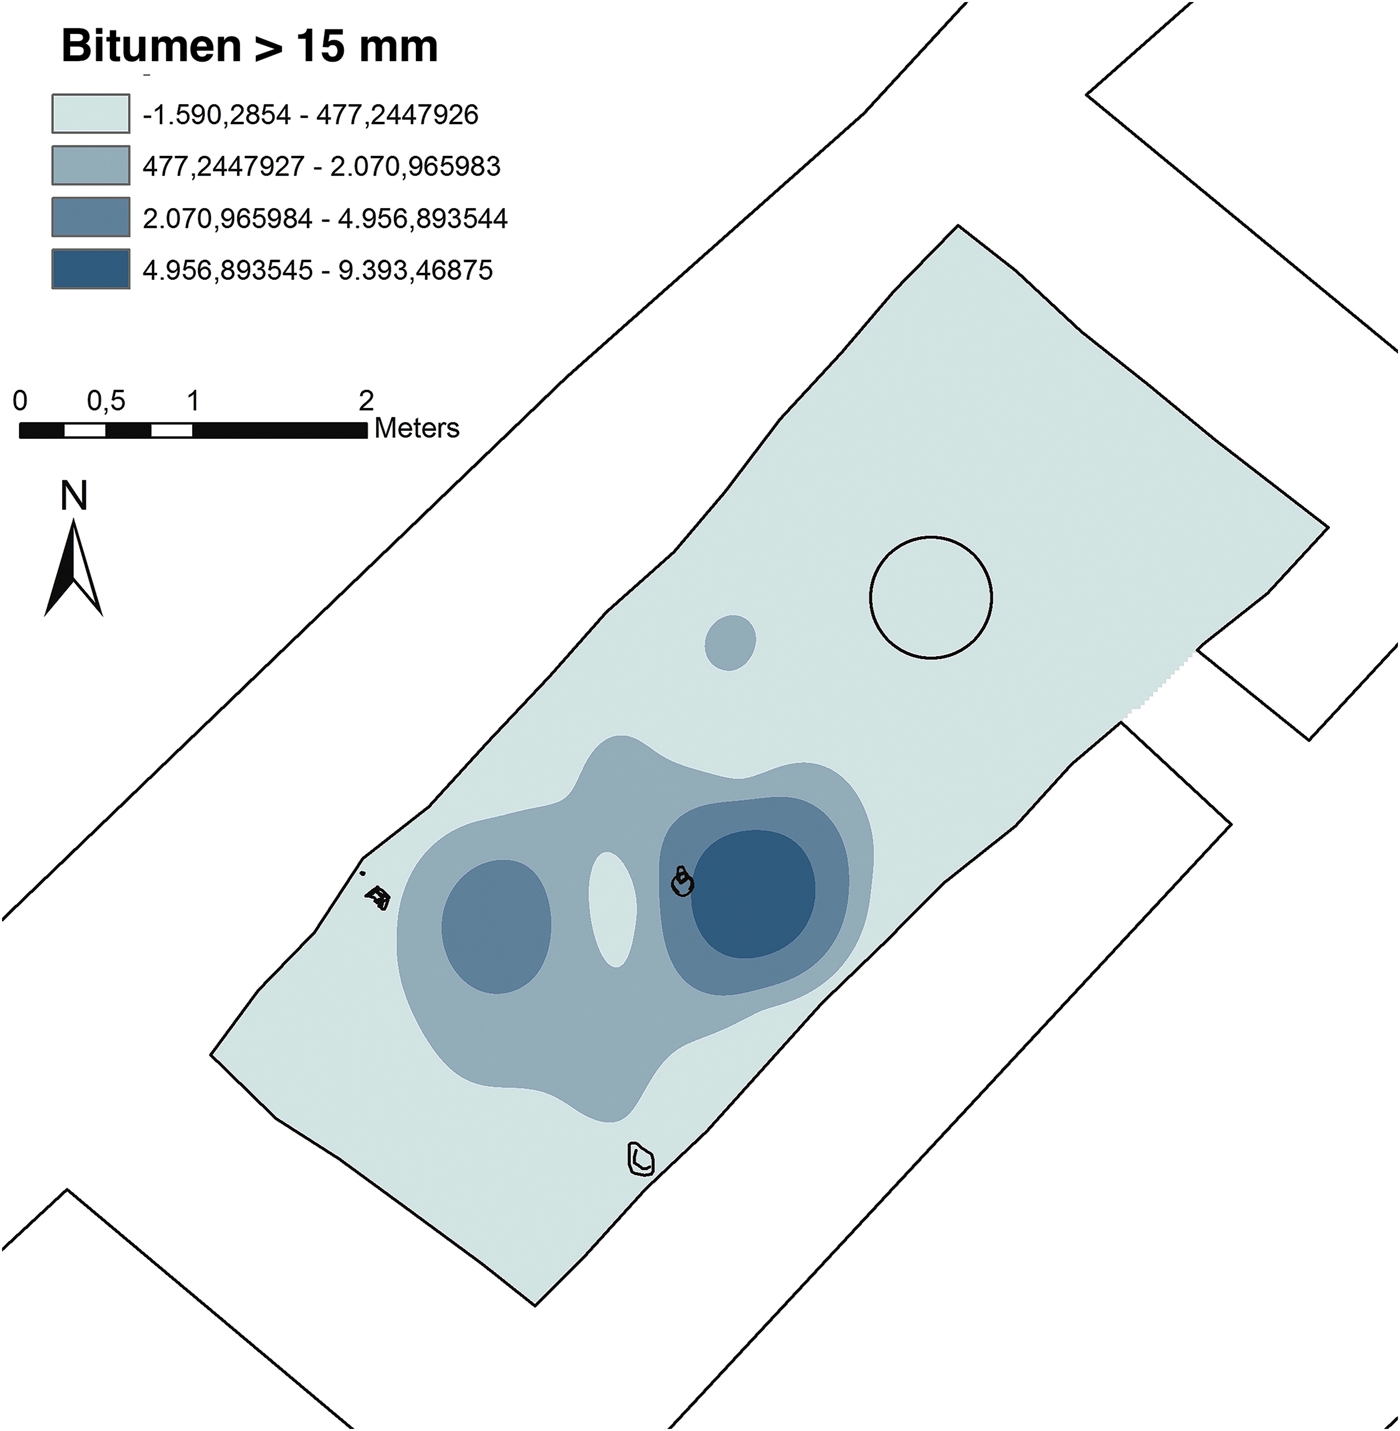
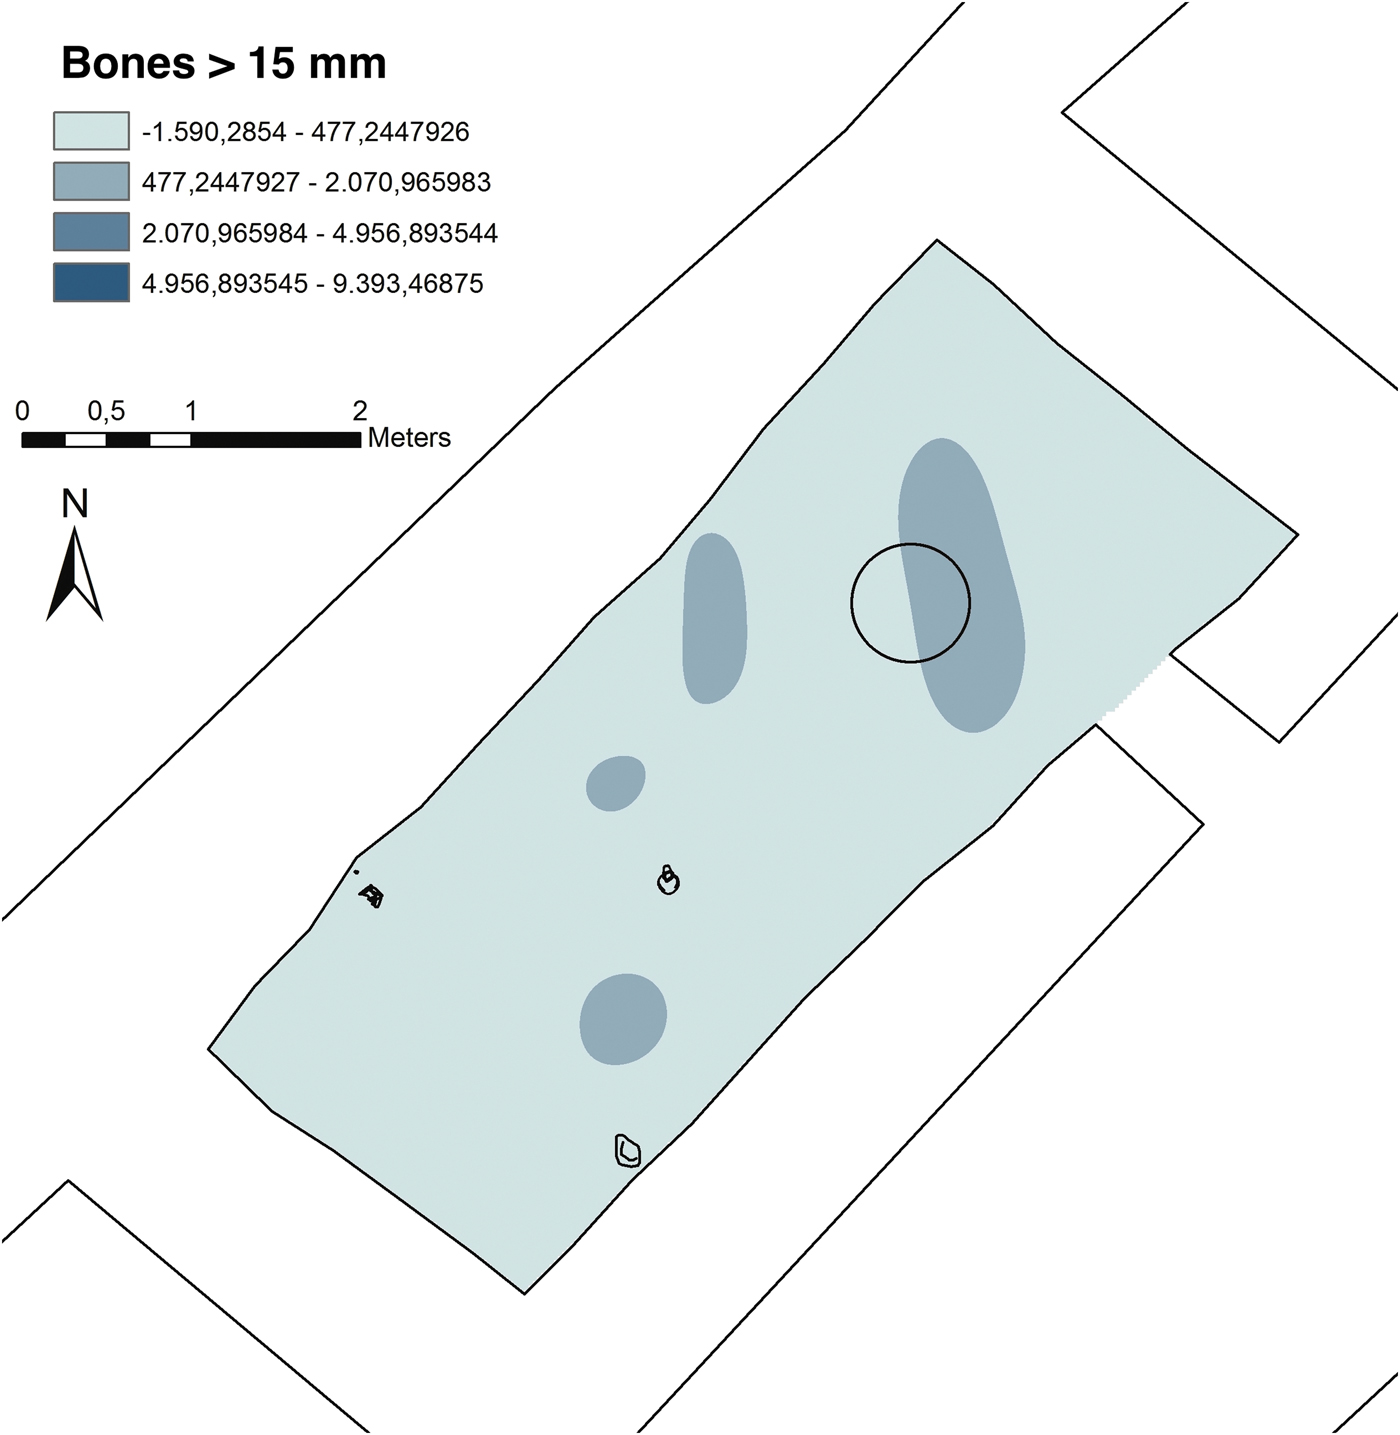
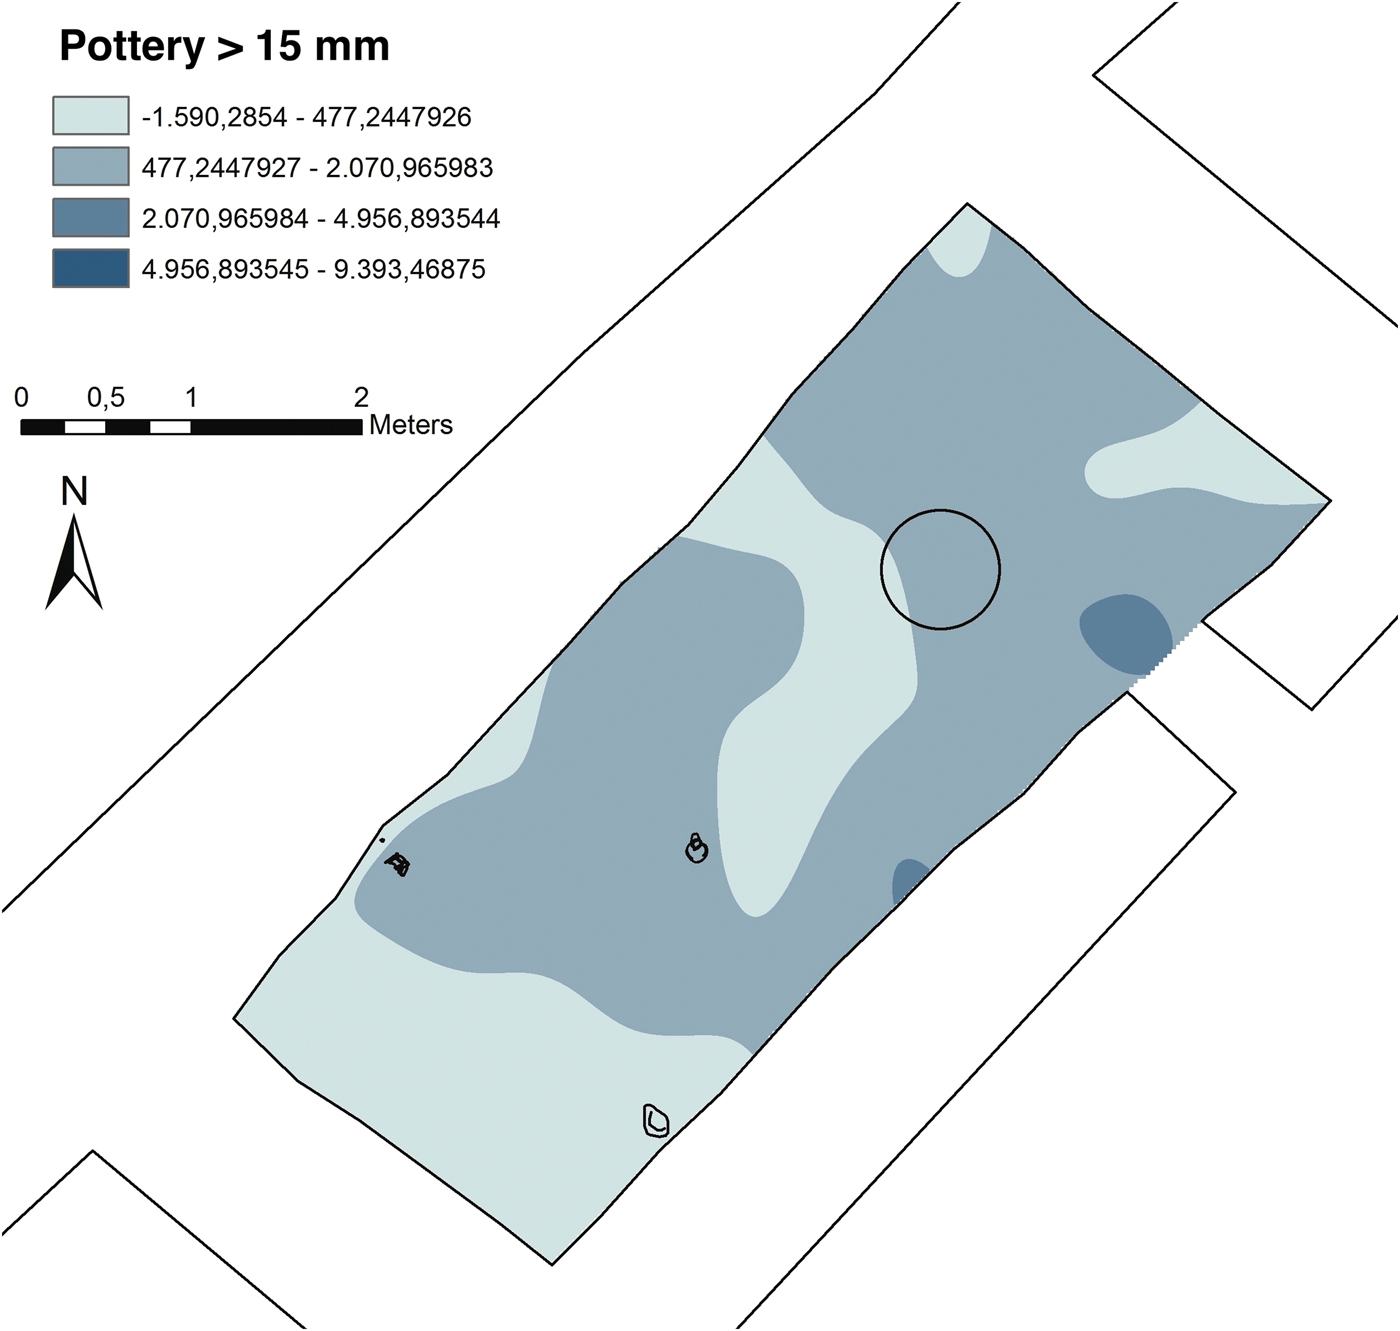
The examination of their distribution patterns reveals that bitumen reflects almost exactly the distribution of the micro-residues of the same material (Fig. 19). Bones, however, are scattered much more evenly in the room, with just a few small and sparser concentrations (Fig. 20). Pottery, finally, presents a more articulated distribution, that at the same time differs considerably from the behaviour of the micro-fragments of pottery. In this case, the centre of the room and the area to the south of the fireplace appear noticeably “clean”, while smaller more evident concentrations are distributed along the south-eastern wall and, in particular, in front of the threshold (Fig. 21).
Interpolation map of the bitumen residues larger than 15 mm.

Interpolation map of the bone residues larger than 15 mm.

Interpolation map of the pottery residues larger than 15 mm.

5. Discussion of the results
When observing the spatial behaviour of micro-residues, one of the most striking aspects is their general scarcity in front of the south-western wall. Here density values appear more homogeneous than in the rest of the room, and no distinctive concentration of materials can be recognised. The floor of this area shows neither signs of disturbance, nor traces of re-openings and/or re-makings, contrary to the opposite side of the room (with Grave 19). Thus, the data do not support the hypothesis that these values represent the consequence of a surface alteration. Conversely, a possible reason for the distinctive behaviour of this portion of the room might be the presence of (not preserved) domestic fittings or mats covering the surfaceFootnote 59, which would have inhibited the ability of materials to accumulate and become embedded within the sediment.Footnote 60 A few residues were nonetheless identified, meaning that they either managed to find their way to the floor or that they were already inherently part of it as residual material (i.e. “background noise”). Despite their possible residual nature, it is worth mentioning that the small stone bead and the few red pigment bits, the only residues with a more decorative/symbolic value, were found precisely in this area. Ultimately, this part of the room conveys the impression that it served as a more private space where people gathered, sat and possibly engaged in activities that left, however, no visible traces.
Another clear feature of the room is the likely presence of a food preparation and cooking area around the fireplace. Indeed, the distinctive concentration of eggshell and bones in connection with the fireplace suggests that cooking was taking place in this location. In addition to bones and eggshell, the area surrounding the fireplace also shows concentrations of pottery and flint fragments, possibly resulting from the manipulation of pots and stone tools during food processing and preparation.
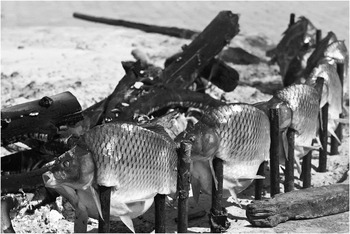
Fish bones were specifically copious in this area, and fish was probably an important resource in the diet of the communities living in AbT, as reflected by the findings in Room 5 and those from other contexts of the site.Footnote 61 The relevance of fish resources is attributable to the natural environment of the marshlands where, in the ethnographic context of the Maʼdan (“Marsh Arabs”), fishing represents a central activity for the economy of the village.Footnote 62 Today, one of the national Iraqi dishes is the masgouf (Fig. 22), a simple recipe where one fatty fresh water carp is butterflied, fixed to the soil with wooden pegs and exposed (indirectly) to the fire.Footnote 63 This is a plausible way our fish could have been cooked, and the small holes found around the fireplace in Room 1 of the same building seem to support this interpretation.Footnote 64 Eggs may also have represented a common food for local communities: it is known, indeed, that the marshlands hosted numerous bird species in the past,Footnote 65 and that would have made eggs a readily available resource for the inhabitants of AbT.
Photo of masgouf fish fixed and cooked on wooden pegs around a fireplace. From Al Jazeera English [CC BY-SA 2.0 (https://creativecommons.org/licenses/by-sa/2.0)], via Wikimedia Commons.

Less markedly than in the fireplace area, the occurrence of fair concentrations of bones, eggshell and especially of pottery, can be also noticed in front of the north-eastern wall. It is important to remember that this area is characterised by the presence of Grave 19, which was re-opened during the use of the room and might have altered the occurrence and distribution of micro-residues within the floor. After a careful look, this suggestion seems not to be supported by the trend expressed in the materials. In the case of an altered context, we should notice anomalies in the distribution of residues, such as abrupt decreases or homogenization of density values. As said before, though, fair amounts of residues were identified in this area, showing no sudden “gap” and, in the case of pottery, also showing clear concentrations (especially in the north-eastern corner). Furthermore, even if the density of eggs and bones diminishes, these materials occur nonetheless in much higher amounts than in the southern half of the room, and this behaviour probably reflects the natural spread of materials with a progressive decrease in density values from the centre of the activity area (the fireplace) towards the outside. Overall, the analysis of micro-residues leads us to the conclusion that, even if a re-opening and an alteration of the surface took place, it must have occurred far before the abandonment of the room, allowing the materials to accumulate during its life and use.
Not only does Grave 19 not impair our reading of the floor, but it also represents a relevant feature to take into account when analysing this space, since it was dug during the time the room was used and it has a direct connection with its life and occupiers. The burial, with its rich deposition of ceramic vessels probably placed to contain foodstuffsFootnote 66 and other goods for the deceased, seems to suggest the existence of funerary practices involving libations.Footnote 67 These rituals, periodically performed by the living, are well known in the Mesopotamian world from written sources and through archaeological evidence from contemporary sites, as well as from other burials at AbT itself.Footnote 68
The distribution of the food residues, which spread from the cooking area of the fireplace, could therefore be (at least partially) related to these practices. Also the relatively high concentrations of pottery may be connected to a more intense handling of vessels, which in turn could be linked to the performance of periodic libations. At the same time, it must be noted that the distribution of the micro-finds in this area also reflects a natural tendency of residues to pile up more easily in room corners. And if we assume a possible presence of pottery in this end of the room (given once again the concentration of micro-ceramics), this may have further acted as an obstacle to cleaning operations and favoured the trapping of the residues.
Moving our focus to the south of the fireplace, the first clear feature that can be observed is the proximity of the charred seeds, which all originate from a single sample, to the big fragment of grinding stone AbT.14.12. This association suggests that both presence and position of the seeds is anything but casual. On the contrary, it possibly pinpoints the existence of an area where, at least to a certain extent, cereals were processed, while the recovered seeds represent some production waste (discarded because burnt) of that same activity.
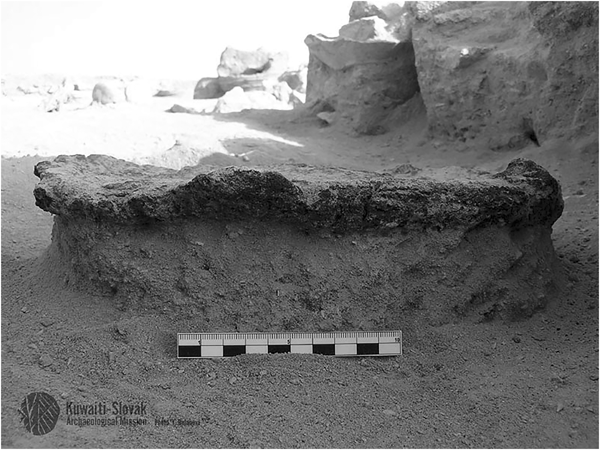
In the same area of the room, but rather more to the centre, we mentioned the occurrence of the most abundant material of the room, bitumen, in two concentrations that make up almost the totality of the recovered finds. Considering their exceptionally high and exclusive concentrations, and the comparison with a well-preserved find (Fig. 23) from the Al-Khidr excavation in Kuwait,Footnote 69 these residues are thought to represent pieces of an in situ cake of bituminous material, compressed by the later deposits and not identified during the excavation of the room. Bitumen was a widely attested raw material in southern Mesopotamia, and it is frequently recovered in the archaeological deposits of AbT as well as in ethnographic contexts.Footnote 70 The most frequent use of bitumen in the past was as mortar in building construction (mixed with straw, clay and sand), but it was also extensively appreciated as a waterproofing agent for baskets, mats, earthenware, etc.; moreover, thanks to its adhesive qualities, it was also used to repair broken pottery, to fix flint implements on wooden handles of sickles and to manufacture tools.Footnote 71 Finally, it is relevant for the interpretation of this part of the room that the entirety of in situ tools (apart from the grinding stone, a pestle, a chert core, a clay cone, and a weight were recovered) is located in this area between the fireplace and the southern end of the room. Indeed, their association with the two material concentrations just described emphasises the distinctive character of this space, which was probably allocated to production activities and craft work.
Photo of an in situ flat bitumen lump found at the site of Al-Khidr (Kuwait). From Kuwaiti-Slovak Archaeological Mission [CC BY-NC-ND 3.0 (https://creativecommons.org/licenses/by-nc-nd/3.0/)].

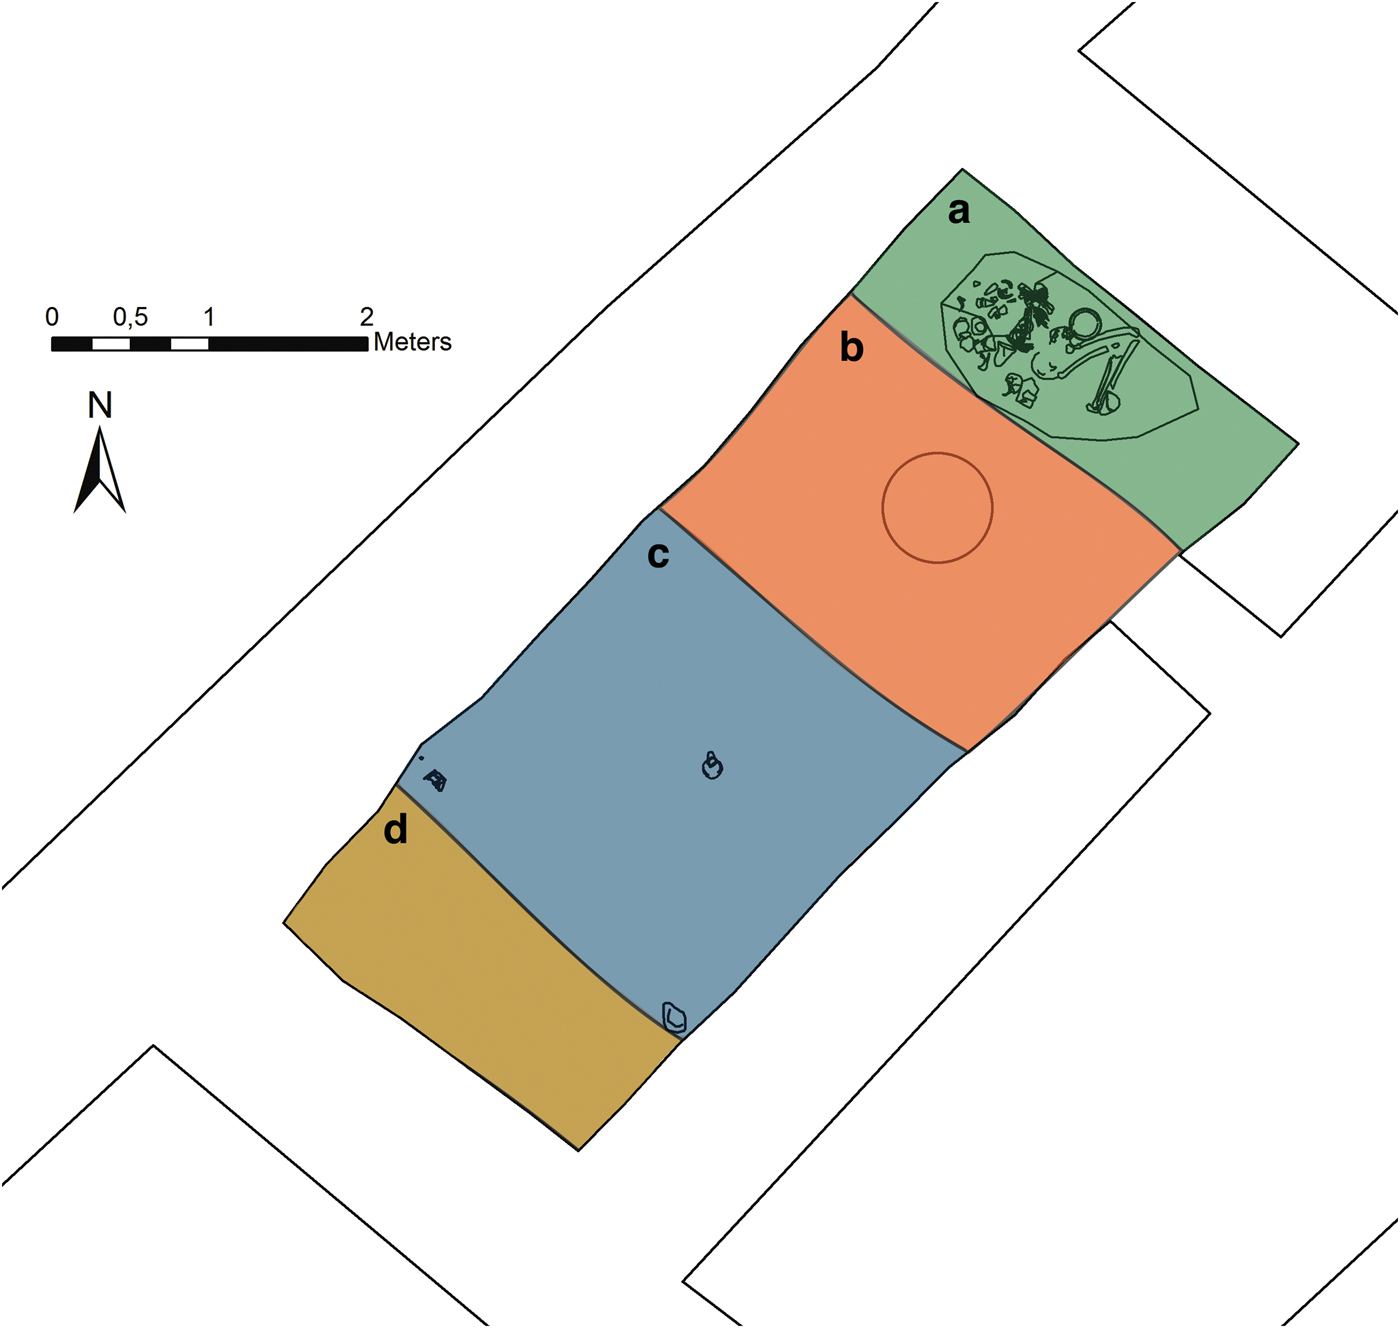
In summary, the behaviour of macro- and micro-residues suggests the existence of four distinct spaces within Room 5, from north to south (see corresponding areas in Fig. 24):
a) An end with the sub-floor burial, possibly involving offering-related practices;
b) An area designated for food preparation and cooking;
c) An area connected to domestic production/maintenance activities;
d) The other end, probably covered with mats, serving as sitting/gathering area.
Plan of the four functional areas identified in Room 5.

A final remark has to be made about maintenance practices within the room. Indeed, the >15 mm pottery fragments, which were probably more easily swept away than the residues of smaller dimensions, show no accumulation in the centre, and the few areas where they accumulate are along the walls. This trend clearly diverges from that of smaller pottery residues and probably reflects cleaning practices carried out in the room.
6. Conclusions
This contribution aims to show how, by means of micro-residue analysis, it is possible to gain a sound insight into a built environment and the way its space was used. According to our interpretation, Room 5 constitutes a small-sized space where traces of moderate-intensity domestic activitiesFootnote 72 are found in association with possible practices destined for the care of the dead buried at one of its ends. It is interesting to note that, except for the burial itself, Room 5 shows no specific symbolic features. On the contrary, as far as we could see, its purpose as a kitchen/ production area is the major feature of the room, so that if ritual practices in connection with the burial were performed, these would have been intertwined with a more mundane use of the space.
As we have seen, micro-residue analysis finds its most fruitful application when integrated with information from architecture and (when present) from in situ materials. The combination of different sets of data not only allows acquisition of a more detailed picture of the context, but at the same time also plays a ʽfeedbackʼ role by cross-checking the information obtained from each class of data. Thus, the presence of a fireplace better explains the concurrence of bone and eggshell concentrations; the occurrence of residues related to production/working activities complements the distribution of in situ tools and suggests a primary deposition for those finds; the supposedly covered portion, possibly a gathering/sitting area, is located, not unexpectedly, at the southern extremity of the room, far from the only passage area and from the main foot traffic.
At the same time, thanks to micro-residues alone, it has been possible to grasp details that would have eluded an exclusively macroscopic observation. The pottery recovered in the room, for example, does not suggest cooking activities within the room, given the almost complete absence of kitchenware (except for one specimen), while before the micro-residue analysis it could not be understood that one area of the room was probably covered by mats.
We mentioned at the beginning of this paper the “background noise” problem, and above we explained how cross-validation of different data sets is a useful tool for identifying the micro-residues (that are related to the use of a given space). Another effective way to distinguish residual from contextual material is the occurrence of both distinctive material concentrations and densities diverging from a mean. This method is based on the assumption that a prepared floor, even if inherently contaminated by residual material, would present relatively homogeneous density values across it, due to the normalising action of the mixing and re-working of sediment for the making of a floor. Shells, found in basically all samples in low and quite homogeneous amounts, exemplify this issue. Indeed, they were not included in the final discussion because their spatial behaviour evokes no link with possible human behaviours, suggesting instead a residual derivation.
In conclusion, despite the promising results, we have to bear in mind that Room 5 constitutes only the first tile of a rich and composite mosaic. Further investigations are required to complete the picture, here only delineated, and future analyses will include specialist examination of the materials recovered in the room (both micro-and macro remains), as well as the broadening of spatial and functional analyses to the other rooms of the mud-brick building. Indeed, as stated in the first lines of this paper, Building A represents an extraordinary example of a Sumerian domestic complex, and its study offers an invaluable opportunity to contribute to research on Mesopotamian households, by providing new insights into the daily life of the inhabitants of Abu Tbeirah.